INTRODUCTION
Parasitism is a deceptively simple term, covering different ecological realities (Leung and Poulin, Reference Leung and Poulin2008). Although all parasites share being smaller than their hosts, requiring host interaction to survive at one or more steps of their life cycle, and negatively impacting host fitness (Crofton, Reference Crofton1971), many different ‘shades’ of this interaction exist (Poulin and Morand, Reference Poulin and Morand2000). The easiest distinction to establish is between facultative and obligate parasites, i.e. those that respectively can or cannot adopt a free-living lifestyle in the absence of their host.
Network theory (Strogatz, Reference Strogatz2001) proved instrumental in developing a robust understanding of mutualistic communities (Bascompte, Reference Bascompte2007), as well as other which can be represented as bipartite graphs (Poulin, Reference Poulin2010). In a bipartite community, organisms from one set interact with organisms from a second set. Bipartite graphs are therefore excellent tools to investigate the structure of host–symbiont communities (Dormann et al. Reference Dormann, Frund, Blüthgen and Gruber2009). Recently, some authors have shown that looking at multiple interactions types changes our interpretation of network structure (Fontaine et al. Reference Fontaine, Guimarães, Kéfi, Loeuille, Memmott, van der Putten, van Veen and Thébault2011; Kéfi et al. Reference Kéfi, Berlow, Wieters, Navarrete, Petchey, Wood, Boit, Joppa, Lafferty, Williams, Martinez, Menge, Blanchette, Iles and Brose2012); in short, different organisms, because they have different interaction mechanisms, contribute differently to the overall structure of the community. As structure is used to infer the evolutionary history (Jordano et al. Reference Jordano, Bascompte and Olesen2003), eco-evolutionary mechanisms (Weitz et al. Reference Weitz, Poisot, Meyer, Flores, Valverde, Sullivan and Hochberg2013) involved in species interactions, or epidemiological properties of networks (Danon et al. Reference Danon, Ford, House, Jewell, Keeling, Roberts, Ross and Vernon2011), it is an important research goal to assess how the observed structure of symbiontic networks is affected by the functional structure of the symbiont community.
However, there are still remarkably few studies using network approaches to investigate the structure of host–parasite interactions. There has been a recent increase in the number of studies using microbial systems (see Weitz et al. Reference Weitz, Poisot, Meyer, Flores, Valverde, Sullivan and Hochberg2013, for a review), as well as plant–frugivore interactions (Schleuning et al. Reference Schleuning, Fründ, Klein, Abrahamczyk, Alarcón, Albrecht, Andersson, Bazarian, Böhning-Gaese and Bommarco2012), but very few attention has been given to this methodology in animal–macroparasite networks (Poulin, Reference Poulin2010). Most of the studies have been done using ectoparasitic fleas and mammals. Mouillot et al. (Reference Mouillot, Krasnov, Shenbrot and Poulin2008) showed that when the number of species increased, connectance (the proportion of realized interactions) decreased; this can be due to interactions having a strong phylogenetic component, in which case adding new species only marginally increases the number of interactions (Krasnov et al. Reference Krasnov, Fortuna, Mouillot, Khokhlova, Shenbrot and Poulin2012). Other studies have shown that several components of network structure (specialization, asymmetry of interaction strength), can be predicted from species abundances (Vazquez et al. Reference Vazquez, Poulin, Krasnov and Shenbrot2005, Reference Vázquez, Melián, Williams, Blüthgen, Krasnov and Poulin2007). These results stress the benefits of adopting a community-level approach through network analysis, as it allows uncovering patterns which would be unobservable otherwise.
In this paper, we analyse a large dataset of parasitic interactions between mammals and ectoparasitic mite samples in central Europe (Stanko et al. Reference Stanko, Miklisová, Goüy de Bellocq and Morand2002). By studying how looking at only facultative ones, only obligate ones, and all types of parasitisms change our interpretation of the network, we show that different types of parasites exhibit opposing network properties. Obligate parasites networks are more modular and less nested than expected by chance, whereas facultative parasites networks are more nested. We furthermore show that facultative parasites are more spatially versatile in their host choice, leading to a greater between-network variability of structure. We discuss the ecological and epidemiological consequences of our results, and call for a better integration of network theory in parasite community ecology.
METHODS
Data
We studied 125 bipartite networks of mammals and ectoparasitic mites from central Europe, as described by Stanko et al. (Reference Stanko, Miklisová, Goüy de Bellocq and Morand2002). We used data on gamasid mites parasitic on rodents and insectivores found within the sampling area. A total of 12 999 individuals of 26 host species were trapped from March 1983 until April 2001, in several regions of Slovakia (mainly in the Javorie mountains and Krupinská Planina plain, Volovské Vrchy mountains, East Slovakian Lowland). Each trapping session (125 in total) was within a limited period (1–3 nights) at the same location. The traps (on average, 700 traps per session, ranging from 100 to 2000 traps) were deposited following the same protocol at each trapping session. Each trapped animal was identified and examined for ectoparasites in the laboratory. The animal's fur was combed thoroughly, using a toothbrush, over a plastic pan, and mites were carefully collected. A total of 68 667 specimens of 27 species of mites (10 facultative and 17 obligate species) were removed and identified from the small mammals.
The mites we investigated are parasitic mesostigmatic mites of the superfamily Dermanysoidea. These laelapid mites include a large number of parasitic genera and are common in the nests and on the bodies of various terrestrial mammals. Some species are strictly nest dwellers feeding on small animals and organic debris, some are facultative parasites, mostly feeding on other invertebrates as predators but taking occasional blood meals and others are obligate parasites feeding exclusively on the blood of their host. The mites were divided into facultative and obligate parasitic according to reference texts (Mrciak et al. Reference Mrciak, Daniel and Rosický1966; Haitlinger, Reference Haitlinger1977). Generally, the parasitizing ranges of different recognized mite species vary, and there is no strong phylogenetic signal conservatism of the different lifestyles.
Networks, each representing the host–parasite community of either all parasites (n=125), only obligate (n=97) or only facultative (n=96), for one trapping session, are represented by their adjacency matrix (networks with fewer than four species in each class of organisms were removed). A bipartite adjacency matrix (Newman, Reference Newman2010) has hosts as rows and parasites as columns, and is filled with ones and zeros, if (respectively) there is an interaction between the parasite and the host, or not. This matrix thus represents the occurrence of parasites and host, and encodes many of the classical metrics used to describe parasite community structure. The sum of rows is the richness of the parasite community of a single host species, and the sum of columns is the number of hosts each parasite species can infect.
Network analysis
We measured several metrics on each network. First, we measured connectance, Co. This reflects the proportion of established interactions; when there are H hosts and P pathogens, establishing a total of I interactions, Co=I/(H×P). Second, we measured nestedness, using the nodf formula (Almeida-Neto et al. Reference Almeida-Neto, Guimaraes, Guimaraes, Loyola and Ulrich2008). This method returns values between 0 and 100. Larger values indicate that, within the network, specialist parasites infect hosts which are also infected by generalist parasites (and conversely, hosts with few parasites have mostly specialized parasites). It serves as a measure of niche overlap (in that in a nested network, the niche of all parasites overlap with the niche of the most generalist one). Finally, we estimated the modularity of the networks. We optimized the bipartite modularity value proposed by Barber (Reference Barber2007), through an asynchronous lp-brim process, as described by Liu and Murata (Reference Liu and Murata2010). The best community partition out of 1000 runs was retained for each network, to avoid local optima. This measure returns values in the 0–1 range, where values close to 1 indicate high modularity (subsets of hosts and parasites interacting strongly between themselves, but not with other subsets), and values close to 0 indicate that no clusters of hosts and parasites exist in the network. For each parasite in the network, we measured its generality (i.e. which proportion of hosts it is found on), using the RR measure proposed by Poisot et al. (Reference Poisot, Canard, Mouquet and Hochberg2012a). This measure is a ranging of the generality measure of Schoener (Reference Schoener1989), allowing comparison between networks of different sizes. For a parasite with h hosts out of H total host species in the network, its host range is (H−h)/(H−1). This gives values between 0 and 1, with 1 meaning that the parasite has a single host, and 0 that it exploits all hosts available.
Network dissimilarity
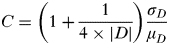
We measured network dissimilarity with the β OS′ estimator (Poisot et al. Reference Poisot, Canard, Mouillot, Mouquet and Gravel2012b), using β w as a dissimilarity measure (Koleff et al. Reference Koleff, Gaston and Lennon2003). To measure this value for a network M, we first took all networks in the dataset, and for each pair of species (i.e. here, each host with each parasite) in M, determined if they interact at least once. This results in a ‘regional’ equivalent of M, that we call M′ (M′ is a metaweb sensu Dunne, Reference Dunne, Dunne and Pascual2006). The value of β OS′ is simply the interaction composition distance between M and M′. It takes values in the 0–1 range, where values closer to 1 indicate that interactions in this network differ strongly with what can be expected knowing the regional interactions, thus indicating that parasites in the network experience high host-choice turnover across sampling points. The information about the overall dissimilarity of networks in the dataset is summed up by the coefficient of variation of the distribution of β OS′, termed D, and calculated by,
 $$C = \left( {1 + \displaystyle{1 \over {4 \times |D|}}} \right)\displaystyle{{\sigma _D} \over {\mu _D}} $$
where σ and μ are respectively the sample standard deviation and sample mean of the distribution D. |D| is the cardinality of the distribution. Using the sample-size corrected coefficient of variation (i) removes the impact of networks having different sizes and (ii) corrects for the unequal number of networks between all parasites, facultative parasites and obligate parasites. Large values of C indicate that interactions are less conserved across samples, i.e. parasites are more variable in their host choice.
Statistical analysis
As nestedness and modularity can be biased by network connectance and size, we compared the results to null models. These null models re-distribute the links either at random in the network (type I, Fortuna and Bascompte, Reference Fortuna and Bascompte2006), or by respecting the number of interactions of each species (type II, Bascompte et al. Reference Bascompte, Jordano, Melián and Olesen2003). We conducted 1000 replicates of each null model for each network. Each replicate simulates a network with as many hosts and parasites, and as many interactions, but distributed stochastically across hosts and parasites. For both nestedness and modularity, we tested whether the empirical value of the metric is equal to the mean of the distribution of the metric after randomization (see the given references for each model, and Veech, Reference Veech2012, for more details). We mostly discuss the results of more constrained null model II (as they are qualitatively similar to the results of the null model II), but the complete data are available online (see ‘Data availability’ in the acknowledgements).
RESULTS
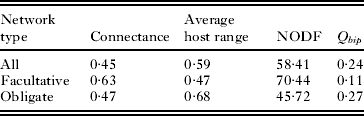
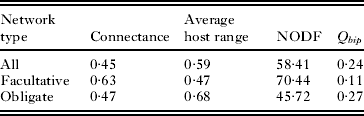
We observed differences between the network structure of the three types of networks (all parasites, only obligate, and only facultative ones – Table 1). Networks of obligate parasites are more specialized, more modular, and less nested than networks of facultative parasites. Networks including all parasites have values between facultative and obligate parasites. These results indicate that obligate parasites tend to have fewer hosts (high specificity), with less overlap between their hosts (low nodf and high modularity), whereas facultative parasites are more generalists. The nestedness value of 45·7 we report for obligate parasites is within the range of what is reported by Krasnov et al. (Reference Krasnov, Stanko, Khokhlova, Shenbrot, Morand, Korallo-Vinarskaya and Vinarski2010) for another system of flea parasites of mammals, and so is the value of modularity (Krasnov et al. Reference Krasnov, Fortuna, Mouillot, Khokhlova, Shenbrot and Poulin2012, keeping in mind that the measure we use in this paper is not strictly equivalent).
Summary of the network metrics for the three types of networks. Complete data are available online
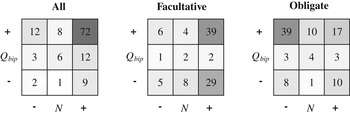
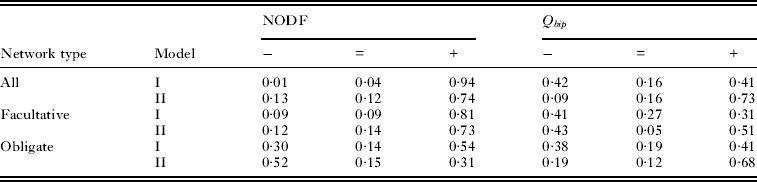
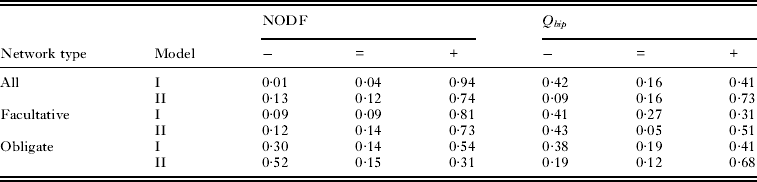
Using null models, we show that network structure of all, obligate, and facultative parasites differs (Table 2). Looking at all parasites, or at facultative parasites only, a majority of networks are more nested than expected by chance, which is congruent with previous results (Poullain et al. Reference Poullain, Gandon, Brockhurst, Buckling and Hochberg2008; Flores et al. Reference Flores, Meyer, Valverde, Farr and Weitz2011). This pattern is lost when looking only at obligate parasites. Accounting only for network connectance (null model I), this pattern is lost when looking only at obligate parasites. Accounting only for network connectance (null model I), only 54% of networks are more nested than expected, a proportion falling to 31% when also accounting for the degree of species (i.e. the number of interactions established by this species; null model II). The effects are less marked for modularity, except for the fact that, using null model II, there appear to be as many facultative parasites networks being more or less modular than expected by chance (Fig. 1), despite the fact that they are significantly more nested than expected by chance. In contrast, 68% of obligate parasites networks are more modular than expected by chance, and also significantly less nested (Fig. 1). This latter result is congruent with the higher specificity of obligate parasites (Table 1), as more specialized networks are also more modular (Espinosa-Soto and Wagner, Reference Espinosa-Soto and Wagner2010). Importantly, looking at the networks with all parasites, one would conclude that they are both more nested (74%) and more modular (73%) than expected.
A heatmap visualization of the results of null model analysis. For all three types of parasites, the number being less, equally or more nested (x axis) or modular (y axis) than expected by chance is given. For example, 72 networks with all types of parasites are both more nested and more modular than expected by chance. The shading intensity of each square represents the proportion of the networks in it.

Results of running the two null models on the different types of networks. For both modularity and nestedness, the columns −, = and + indicate respectively the proportion of networks found to be less, equally or more nested/modular than expected by chance. Due to rounding, the frequency may not add up exactly to unity. Full data are available online
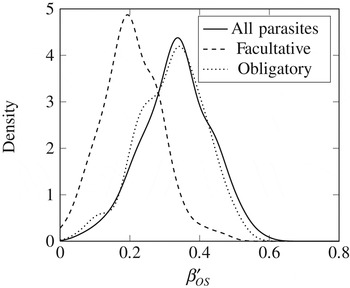
The distribution of raw β OS′ values is given in Fig. 2. Networks of facultative parasites have a larger variability of interactions (C=0·41) than networks of obligate (C=0·29) or all parasites (C=0·28). Comparing β OS′ values across types of networks with an anova, we find a significant difference (F=58·4, P<10−6). Tukey's HSD test reveals that facultative and all parasites, and obligate and facultative parasites networks differ (both P<10−6), but obligate and all parasites do not (p≈0·51). This indicates that obligate and facultative parasites differ in the consistency of their interactions (i.e. which hosts they interact with) across time and space, with obligate parasites being more consistent.
Distribution of the values of β OS′ (how different the interactions within one network are from the regional pool), for the three types of networks. Values closer to 1 indicate that the local networks are highly dissimilar from the regional pool of interactions.

DISCUSSION
Facultative and obligate parasites evolved different niche requirements (Combes, Reference Combes2001), and thus exhibit different specialization. Obligate parasites, requiring stricter adaptations to their hosts, are expected to be more specialized, thus establishing fewer interactions (Poisot et al. Reference Poisot, Bever, Nemri, Thrall and Hochberg2011). This simple difference changes the network structure of obligate and facultative parasites communities. With recent calls to integrate more network theory in our analysis of antagonistic systems (Poulin, Reference Poulin2010), it is important to understand to what extent heterogeneity of strategies among parasites can alter our view of network structure.
The correlation between excess nestedness and modularity (when compared with null models) has been explained in a variety of ways (Fortuna et al. Reference Fortuna, Stouffer, Olesen, Jordano, Mouillot, Krasnov, Poulin and Bascompte2010). Our results show that, if two types of organisms with different strategies are merged into a single network, they can cause properties to emerge in this network. In our data, obligate parasites are more modular, facultative parasites are more nested, and networks with both types are both more modular and more nested. As modularity and nestedness are linked to species persistence in complex communities (Thebault and Fontaine, Reference Thebault and Fontaine2010), this offers the opportunity to study how different classes of organisms contribute to network properties.
Matching with the fact that they are more constrained by their hosts, obligate parasites are more consistent in their interactions over time and space. Studies in recent years focused on host use turnover (Krasnov et al. Reference Krasnov, Mouillot, Shenbrot, Khokhlova and Poulin2011; Poulin et al. Reference Poulin, Krasnov and Mouillot2011), but none of them tried to separate the fact that some categories of parasites are inherently more variable than others. Krasnov et al. (Reference Krasnov, Fortuna, Mouillot, Khokhlova, Shenbrot and Poulin2012) proposed that high geographical consistency in fleas–mammals (obligate parasitism) associations reflected phylogenetic conservatism. Our results neither confirm nor oppose this finding, as phylogenetic relatedness between parasites is unknown. However, they emphasize the need to compare, and account for, different functional groups of parasites, when making inferences about the geographical or temporal consistency of interactions.
Finally, the fact that facultative parasitism networks vary more than obligate do bears importance for epidemiological research. Pathogens which can exploit a large number of hosts are also more likely to acquire new hosts and trigger outbreaks (Woolhouse and Gowtage-Sequeria, Reference Woolhouse and Gowtage-Sequeria2005). It can thus be hypothesized that parasites being exposed to different host assemblages in different environmental conditions (as are facultative ones) will be selected for heightened generalism (Poisot et al. Reference Poisot, Bever, Nemri, Thrall and Hochberg2011), thus making them good candidates for disease emergence, meaning that they should be more closely monitored. Seeking similar patterns in systems representing potential threats for public health can help address this issue. The important goal of better integrating epidemiology and community ecology (Roche et al. Reference Roche, Dobson, Guegan and Rohani2012) can in part be achieved by finer network analyses of host–pathogen systems, and by a stronger understanding of how interactions vary in responses to different environmental drivers.
ACKNOWLEDGEMENTS
TP thanks the Canadian Research Chair on Continental Ecosystems Ecology for computational support. We thank three anonymous referees for comments which greatly improved a previous version of this manuscript. Data availability: data used in this paper are available and citable online at http://dx.doi.org/10.6084/m9.figshare.96302.
FINANCIAL SUPPORT
This paper has been partially supported by grants 2/0042/10 from the Slovakian Grant Agency VEGA and Slovak Research and Development Agency APVV-0267-10.