1 Introduction
At the end of 2020, two key events impacted the dynamics of the covid-19 pandemic in opposite directions. First, the B.1.1.7 (“British”) variant emerged. It is more transmissible and more lethal than the original virus. The health measures implemented in France, for example, that were strong enough to imply a R0 smaller than 1 for the original virus were insufficient to maintain the variant’s R0 below 1. In the anticipation of a vaccine, and without an effective test-trace-and-isolate strategy, or a cure to the covid-19, the French government implemented a stop-and-go policy to “flatten the curve,” implying a terrible death toll among vulnerable people, and a sizable destruction of economic wealth in the medium term. But the good news at the end of 2020 was that several highly effective vaccines started their mass production and inoculation phases. These vaccines do not only erase the most severe consequences of the virus for the infected patients, in particular hospitalization and death, they also eliminate the risk of transmission of the virus from vaccinated but infected patients.
However, the production capacity for these vaccines is too small to allow most countries to win the race between mass vaccination and the dissemination of the new variant. This raises the critical question of the allocation of the flow of available vaccines over time. This issue is complex because of its ethical, health, social, and economic implications. The WHO (2020a) has worked out a values framework based on 12 objectives and 6 principles (human wellbeing, equal respect, global equity, national equity, reciprocity, and legitimacy). From this framework, WHO (2020b) “justifies an initial focus on direct reduction of morbidity and mortality and maintenance of most critical essential services, while considering reciprocity toward groups that have been placed at disproportionate risks to mitigate consequences of this pandemic (e.g., front-line health workers).” Duch et al. (Reference Duch2021) surveyed 13 countries to measure the population’s willingness to prioritize the supply of vaccines to different categories of citizens. In most countries, people favor giving priority to key workers and to those at high risk, but the public also favors giving priority to various categories of citizens such as poorer people.
In Table 1, I describe the most recent statistics on the infection-to-ICU and infection-to-fatality rates (IFR) in France. The later (IFR) takes into account of a 64 % increase in the mortality rate of the B.1.1.7 variant observed in the UK (Challen et al., Reference Challen, Brooks-Pollock, Read, Dyson L, Tsaneva-Atanasova and Danon2021). According to Lapidus et al. (2020), the IFR increases exponentially with age, doubling every 5.2 years. This suggests that the vaccination strategy that maximizes the number of lives saved is to prioritize older people, together with people with co-morbidities. Most European Union (EU) members are currently following a “stop-and-go” policy to “flatten the curve” of the ICU utilization. Because older people are also susceptible to need intensive care in case of infection, giving priority to older people is also useful for the economy, by relaxing the necessary lockdown.Footnote 1 In this paper, I measure the welfare benefit for France of this optimal vaccination campaign by combining its wealth and health impacts.
Estimation of the infection-ICU and the infection-fatality rates by age class in France.

Source: Saltje et al. (Reference Saltje2020) for the ICU rate and Lapidus et al. (Reference Lapidus, Paireau, Levy-Bruhl, de Lamballerie, Severi, Touvier, Zins, Cauchemez and Carrat2021) for the infection-to-fatality rates (IFR). This IFR is multiplied by 1.64, given the observation by Challen et al. (Reference Challen, Brooks-Pollock, Read, Dyson L, Tsaneva-Atanasova and Danon2021) of the 64 % increased lethality of the variant.
To perform this task, I improve the age-structured SIR model that I used in Gollier (Reference Gollier2020c) to compare the welfare impacts of different age-sensitive lockdown policies. I removed from this model its polymerase chain reaction testing element, because no government has used the possibility of mass testing to unlock citizens with a negative test. I replaced this testing element by a vaccination module.
The pandemic has both health and wealth impacts. As is usual in health and environmental economics, I use a value of statistical life (VSL) to value lives saved in the welfare function.Footnote 2 To perform the welfare evaluation of various health policies, I use the official VSL of 3 million euros prevailing in France (Quinet, Reference Quinet2013). I show that the marginal welfare benefit of the vaccine is quickly decreasing with the speed of the vaccination. Compared to the no-vaccine solution, three-quarters of the welfare cost of the pandemic in 2021 would be eliminated in France with the current speed of 100,000 vaccinations per day. And postponing the vaccination campaign in France by one week would kill 2500 additional people along the pandemic, and it would reduce wealth by 8 billion euros. This result could be useful, for example, when performing the benefit-risk evaluation of the (4 days) suspension of the vaccination campaign when some safety concerns emerged for the AstraZeneca vaccine in mid-March.
Suppose now that, for whatever reason, France does not prioritize the supply of vaccines to its most vulnerable citizens. A possible reason is the existence in France of a strong anti-vax movement. In Section 7, I measure the welfare impact of the presence of 30 % anti-vaxxers. In my model, their presence does not affect the intensity of the lockdown, so that it does not worsened the economic crisis. But it increases the death toll by 60,000, most of them were anti-vaxxers. They also exercise a negative externality on senior pro-vaxxers, 5000 of them will die due to additional senior infections during the first three months of the campaign, before their immunization.
Vaccine nationalism is another source of misallocation of the vaccine. In late March, countries like the USA, the UK, and Israel have been able to vaccinate a majority of their population, whereas the most vulnerable people in other countries remain exposed to the virus. According to Mullard (Reference Mullard2020) given information available at the end of 2020, the USA has reserved more than 1.2 billion doses, and Canada has delivery contracts covering more than nine doses per persons. Hafner et al. (Reference Hafner, Yerushalmi, Fays, Dufresne and Van Stolk2020) estimate the economic cost of the predicted disruptions in pandemic-sensitive sectors generated by this nationalism. In this paper, I analyze a thought experiment of vaccine nationalism by assuming a world composed of two identical Frances, one with a vaccine production capacity and the other without it. I compare the first-best allocation where vulnerable people of both countries are vaccinated first, to the nationalistic allocation in which the producing country keeps the production for itself until the completion of its vaccination campaign. I show that such an extreme form of vaccine nationalism raises the aggregate death toll by 20 %. I also show that the producing country gains so much from banning vaccine exports that any sizable international vaccination cooperation, such as the COVAX project supervised by WHO, looks like a definitive illusion, in spite of its public support (Clarke et al., Reference Clarke, Roope, Loewen, Bonnefon, Melegaro, Friedman, Violato, Barnett and Duch2021).
A few papers have examined age-structured SIR models. Most of them examine strategies of mass confinement and/or testing, but none of them have considered a severely constrained vaccination campaign. Acemoglu et al. (Reference Acemoglu, Chernozhukov, Werning and Whinston2020), Favero et al. (Reference Favero, Ichino and Rustichini2020), Fischer (Reference Fischer2020), and Wilder et al. (Reference Wilder, Charpignon, Killian, Han-Ching, Mate, Jabbari, Perrault, Desai, Tambe and Majumder2020) all support a strong sheltering of the vulnerable persons. All these models share the same fundamental structure of the age-structured SIR framework that I use in this paper. Contrary to Gollier (Reference Gollier2020b), I suppose here that all parameters of the pandemic are known with certainty.
2 The age-structured Susceptible-Vaccinated-Infected-Recovered (SVIR) model
The SIR model was introduced by Kermack and McKendrick (Reference Kermack and McKendrick1927). As of today, this model remains the backbone of epidemiological literature. It has long been extended to allow for differences across groups. These extensions are referred to as “multi-group,” and when focusing on age, “age-structured” or “age-stratified.” In the spirit of Acemoglu et al. (Reference Acemoglu, Chernozhukov, Werning and Whinston2020), Favero et al. (Reference Favero, Ichino and Rustichini2020), and Gollier (Reference Gollier2020c), I examine such an extension of a discrete-time version of the SIR model, by adding an economic module and by allowing for a vaccination stage. The whole population, whose size is normalized to unity, is partitioned in three age classes
 $ j\in \left\{y,m,o\right\}=\left\{0-18,19-64,65+\right\} $
. The share of class j in the whole population is denoted by Nj. Each person is either susceptible, vaccinated, infected, recovered, or death, that is, the health status of a person belongs to (S, V, I, R, D). This implies that
 $ {S}_{j,t}+{V}_{j,t}+{I}_{j,t}+{R}_{j,t}+{D}_{j,t}={N}_j $
at all dates
 $ t\ge 0 $
, where Ij,t, for example, measures the number of infected persons in class j at date t. The number of infected persons at date t is denoted
 $ {I}_t={\sum}_j{I}_{j,t} $
, with a symmetric notation for St, Vt, Rt, and Dt. I consider a daily frequency.
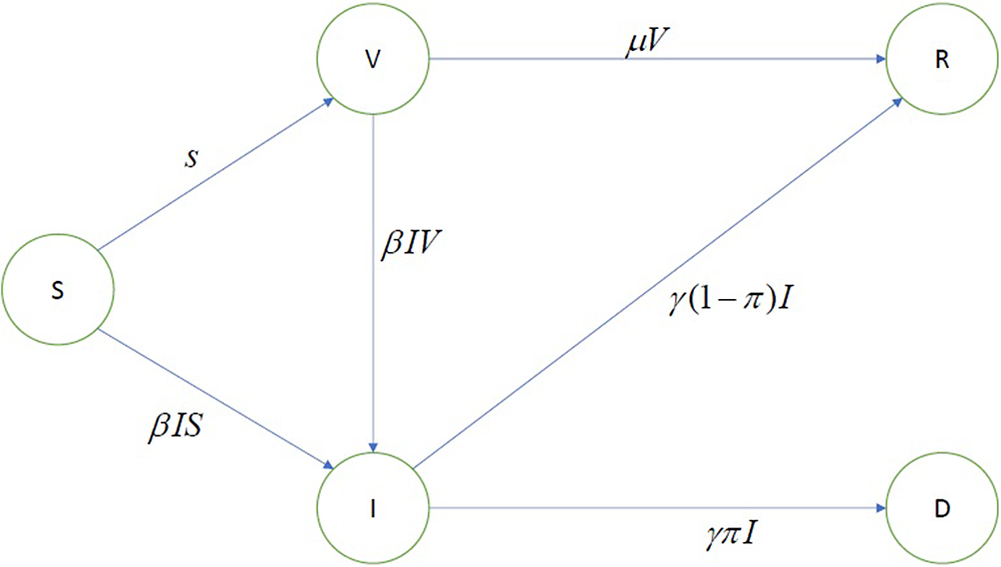
The flow chart of the SVIR model is described in Figure 1. Day 0 corresponds to the date at which the vaccination campaign begins, with exogenous initial conditions
 $ \left({S}_0,{V}_0,{I}_0,{R}_0,{D}_0\right) $
. From day 0 on, a flow
 $ \left\{{x}_t\right\} $
of daily vaccinations can be performed.Footnote
3 This daily vaccination capacity must be allocated to the different age classes according to a specific allocation strategy. Let
 $ {s}_t=\left\{{s}_{yt},{s}_{mt},{s}_{ot}\right\} $
represent this dynamic allocation with
 $ {\sum}_j{s}_{jt}={x}_t $
for all t. The total number of people in age class j who have been vaccinated prior to or on day t is
 $$ {v}_{j t}=\sum \limits_{\tau =0}^t{s}_{j\tau}. $$
Flow chart of the SVIR model.

The cumulative number of vaccinated people in the population on day t is
 $ {v}_t={v}_{yt}+{v}_{mt}+{v}_{st} $
.
Newly vaccinated people are transferred into the V pool. Because antigens take time to be produced, people in that pool remain susceptible. A fraction μ of the V pool is transferred into the R pool every day, that is, they become immunized. Thus, the mean transit time in the V pool is 1/μ days. I assume that vaccination is 100 % efficient after the V-transition, and that infected people who recovered from the virus are permanently immunized. They are also all detected as such at no cost. Thus, the R status can be attained either through a successful vaccination or from recovering from the disease.
People with the S status and the V status face the same risk to become infected. They can be infected by meeting an infected person. Following the key assumption of all SIR models, this number of new infections is assumed to be proportional to the product of the densities of infected and susceptible persons in the population, weighted by the intensity of their social interaction. Under the SIR framework, and with no further justification, this is quantified as follows:
 $$ {I}_{i,t+1}-{I}_{i,t}=\left(\sum \limits_{j=1}^J{\beta}_{ijt}{I}_{j,t}\right)\left({S}_{i,t}+{V}_{i,t}\right)-{\gamma}_i{I}_{i,t}. $$
I will soon describe how βijt, which measures the intensity of the risk of contagion of a susceptible person in class i by an infected person in class j at date t is related to the social interactions between these two groups and by the confinement policy. Once infected, a person in age class i quits this health state at rate γi, as described by the last term in Equation (2). The net outflow of susceptible persons between days t and t + 1 combines people who are infected and people who get vaccinated:
 $$ {S}_{i,t+1}-{S}_{i,t}=-\left(\sum \limits_{j=1}^J{\beta}_{ijt}{I}_{j,t}\right){S}_{i,t}-{s}_{it}. $$
Similarly, the net outflow from the
 $ V $
pool is given by the following equation:
 $$ {V}_{i,t+1}-{V}_{i,t}={s}_{it}-\left(\sum \limits_{j=1}^J{\beta}_{ijt}{I}_{j,t}\right){V}_{i,t}-\mu {V}_{i,t}. $$
There are two exit doors to the infection status, as one can either recover from the virus or die:
 $$ {R}_{i,t+1}-{R}_{i,t}=\left(1-{\pi}_i\right){\gamma}_i{I}_{i,t}+\mu {V}_{i,t} $$
 $$ {D}_{i,t+1}-{D}_{i,t}={\pi}_i{\gamma}_i{I}_{i,t}. $$
The mortality rate among the infected persons of class i at date t is denoted πi. In this paper, I compare health policies that all share the same property of never overwhelming hospitals. This allows me to assume that the mortality rate is constant along the pandemic cycle. Equations (2)–(6) fully describe the age-structured SVIR model examined in this paper. The dynamics of the pandemic depends in particular upon the β coefficients, which are sensitive to the intensity of the social interaction within and across different age groups. They also depend upon the policy of social distancing. Symptomatic infected people are quarantined, whereas the remainder of the population – which includes the asymptomatic infected people – faces some restrictions in terms of social distancing. I assume that a fraction κ of infected people is asymptomatic and cannot be identified during their contagion period.
The policy of social distancing on day t is described by vector
 $ \left\{{b}_{jt}\right\} $
where
 $ {b}_{jt}\in \left[0,1\right] $
is the intensity of the lockdown imposed to age class j. Symptomatic infected people have a low contagion index βq because they are quarantined. Asymptomatic infected people cannot be detected and are just partially confined. They have a contagion index
 $ \underline{\beta}{b}_{jt}+\overline{\beta}\left(1-{b}_{jt}\right) $
. Thus, infected people in age class j have a mean contagion of
 $ {\beta}_q\left(1-\kappa \right)+\left(\underline{\beta}{b}_{jt}+\overline{\beta}\left(1-{b}_{jt}\right)\right)\kappa $
. Susceptible people in age class i are confined in intensity bit. Given the frequency αij of interactions between age-classes i and j, the rate of transmission of the virus between infected people of age class j and susceptible people of age class i is given by:
 $$ {\beta}_{ij t}={\alpha}_{ij}\left({\beta}_q\left(1-\kappa \right)+\left(\underline{\beta}{b}_{jt}+\overline{\beta}\left(1-{b}_{jt}\right)\right)\kappa \right)\left(1-{b}_{it}\right) $$
An important feature of Equation (7) is that the intensity of the contagion between age classes i and j is a quadratic form of the confinement intensities bi and bj. In the case of a uniform confinement rule, the intensity of contagion is quadratic in the intensity b of confinement. This is due to the fact that the lockdown reduces the interaction from both sides, infected and susceptible.
How can we compare different policies in relation to their welfare impacts? Two dimensions should be taken into account. First, life is valuable, so death has a welfare cost. Let me associate a cost ℓj to the death of a person in age class j. Footnote 4 The pandemic has also an economic cost associated to the deaths, quarantines, confinements, and vaccination during the pandemic. I assume that quarantined people are unable to work. A fraction ξj of confined people in class j can telework. The value loss of a person in class j who cannot work is denoted wj. For workers, wm can be interpreted as their labor income. For young people, wy includes the lost human capital due to the reduced quality of their education during lockdown. For the retired people, it’s the value of their contributions to the common good. We must also take account of the economic cost of mass vaccination. In total, assuming a unit cost of vaccination equaling p, the economic loss of the pandemic in class j is measured as follow:
 $$ {W}_j={pv}_{jT}+{w}_j\sum \limits_{t=0}^T\left.(\left(1-{\xi}_j\right){b}_{jt}\left({S}_{j,t}+\kappa {I}_{j,t}+\left(1-\omega \right){R}_{j,t}\right)+\left(1-\kappa \right){I}_{j,t}+{D}_{j,t}\right), $$
where T is the time horizon of the social planner. I assume that a proportion ω of people with the R status receives an “immunity passport” which allows them to be relieved from the lockdown constraints. Finally, the total loss is thus equal to
 $$ L=\sum \limits_{j=1}^J\left({\mathrm{\ell}}_j{D}_{j,T}+{W}_j\right). $$
A key dimension of the health policy during a pandemic is the risk of overwhelming the healthcare system facing limited capacities in health workers, beds, ICUs, or respirators. I summarize this capacity problem by a capacity limit on covid ICUs in hospitals. The social distancing policy
 $ \left\{{b}_t\right\} $
is aimed at making sure that the national ICU capacity
 $ \overline{ICU} $
is never overwhelmed. I assume that at the end of the infection period, a fraction hi of infected people needs an ICU.
 $$ {newICU}_{i,t}={h}_i{\gamma}_i{I}_{i,t}, $$
where hi is the fraction of infected people in class i developing an acute version of the virus and requiring intensive care. Because the mean duration in intensive care is TICU, the total number of people of age class i in intensive care on day t is given by
 $$ {ICU}_{i,t}=\sum \limits_{\tau =1}^{T_{ICU}}{newICU}_{i,t-\tau }. $$
I constrain health policies to make sure that the ICU capacity is never overwhelmed:
 $ {\sum}_j{ICU}_{j,t}\le \overline{ICU} $
. Finally, I assume that the virus can be obliterated by an aggressive testing-and-tracing strategy if the global infection rate in the whole population goes below some threshold Imin.
In this paper, I measure the impact of the vaccination strategy on social welfare under the standard uniform “stop-and-go” lockdown policies that have been implemented in Europe after the first wave of the pandemic. These policies have the advantage of preserving some ICUs, but they ignore the fact that the short term economic advantage of the weak lockdown could be dominated by the medium term cost of the much longer duration of the lockdown, waiting for herd immunity or a mass vaccination campaign. They also ignore the benefits of sheltering more intensely the most vulnerable fraction of the population (Gollier, Reference Gollier2020c). So, I assume bjt = bt. The limited social acceptability of these measures justifies the more realistic approach considered in this paper. The stop-and-go policy is characterized by three possible intensities of confinement,
 $ {b}^l<{b}^m<{b}^h $
, and three ICU thresholds:
 $ 0\le {r}_l<{r}_m<{r}_h\le \overline{ICU} $
. I assume that the medium intensity bm of lockdown is implemented on day 0. This intensity is maintained as long as ICUt remains in between rl and rh. If ICUt goes below rl, the intensity is reduced to bl, and remains at that level as long as ICUt is below rm. If ICUt goes above rh, the lockdown intensity is increased to bh, and remains at that level as long as ICUt is above rm. Finally, we must recognize that the usefulness of the lockdown is reduced when the proportion of vaccinated people increases. I therefore assume that the effective lockdown intensity is linearly decreasing with the fraction of vaccinated people:
 $ {b}_t={b}^i\left(1-{v}_t\right) $
.
Because older people faces a much larger risk of needing intensive care and of mortality in case of infection, the efficient vaccination strategy is to allocate the vaccine in priority to this age class.Footnote 5 The benchmark calibration of the model is based on the assumption that the vaccination campaign allocates the vaccine according to this first-best rule. I then examine the welfare cost of alternative allocation strategies.
3 Calibration of the SVIR model
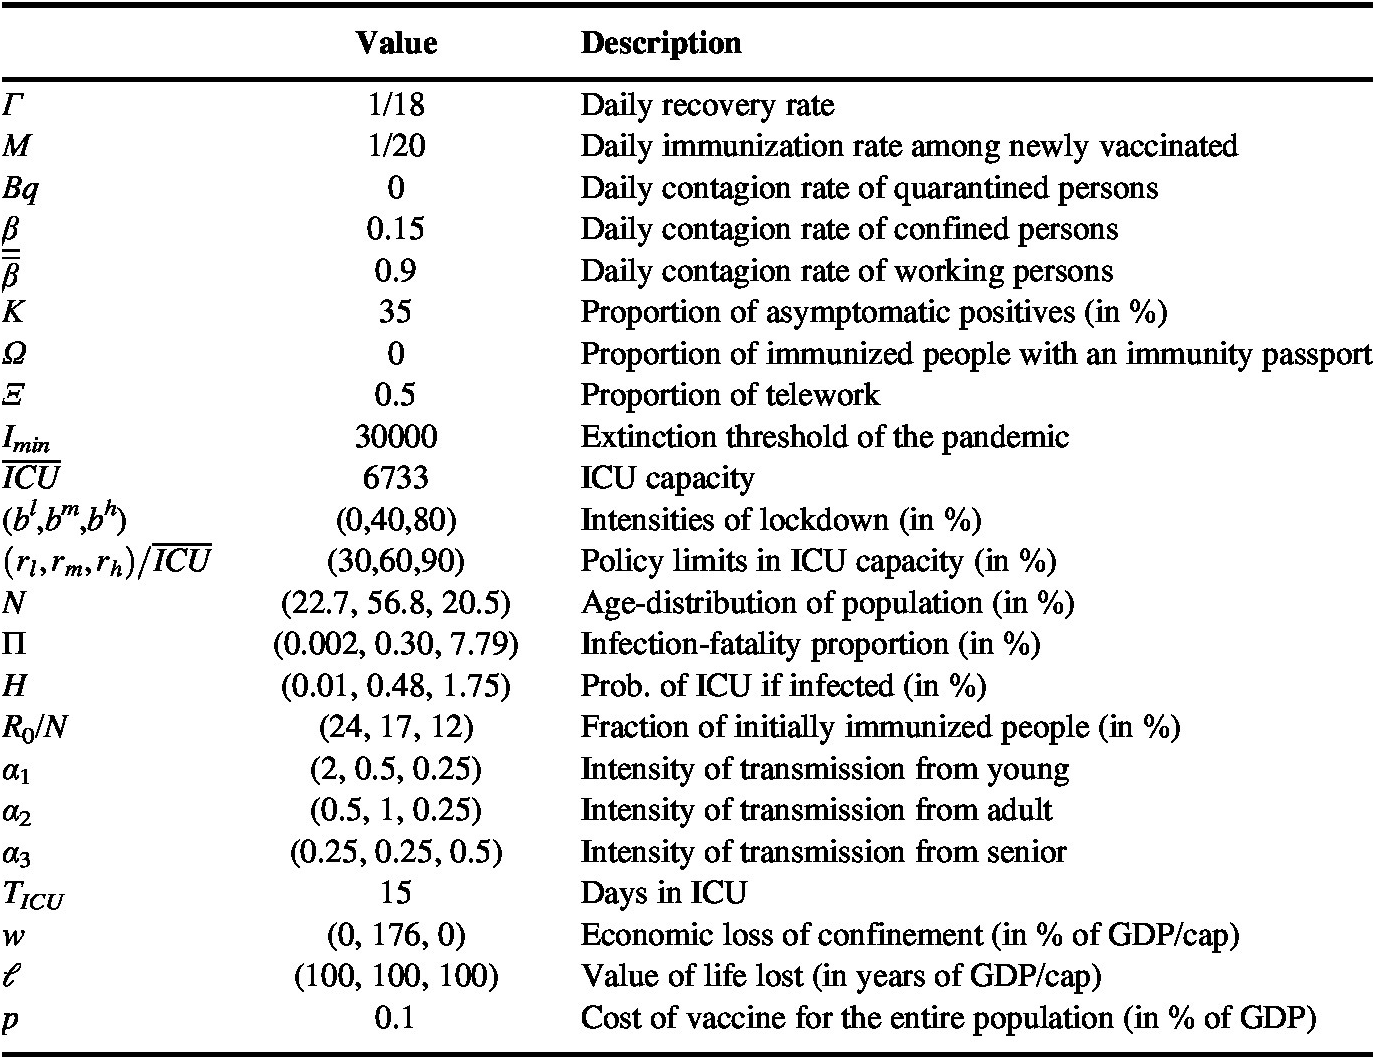
I calibrate the model on French data. I normalize the French population of n = 67 million people to unity. The size of the population in the different age classes is N = (0.227, 0.568, 0.205). At date t = 0, I assume that 1 % of the population is infected, uniformly across the three age classes. At that time, there is a number R 0 = (0.24, 0.17, 0.12).N of recovered people in the population.Footnote 6 I also assume that 1 % of the population is in the I status at that date. All others are in the S pool on day 0.Footnote 7
I calibrate the virulence of the B.1.1.7 variant as follows. According to Volz et al. (Reference Volz2020), it is 40–70 % more transmissible than the original virus. I therefore increase the
 $ \left(\underline{\beta},\overline{\beta}\right) $
by 50 % compared to my original calibration in Gollier (Reference Gollier2020c). It yields
 $ \underline{\beta}=0.15 $
and
 $ \overline{\beta}=0.9 $
, whereas I continue to assume that quarantined (symptomatic) individuals do not transmit the virus. According to Challen et al. (Reference Challen, Brooks-Pollock, Read, Dyson L, Tsaneva-Atanasova and Danon2021), the B.1.1.7 variant is also 64 % more lethal than the original virus. Thus, I multiplied by a factor 1.64 the historical infection-fatalities ratio estimated for France by Lapidus et al. (Reference Lapidus, Paireau, Levy-Bruhl, de Lamballerie, Severi, Touvier, Zins, Cauchemez and Carrat2021). This yields an infection-fatality ratio π equaling 7.79 and 0.3 % for respectively the 65+ and the 19–64. Compared to the calibration for the original virus, these are very bad news.
The daily outflow rate γi = γ = 1/18 from the infection pool is assumed to be the same across age classes. This corresponds to the observation that infected people remain sick for 2 or 3 weeks on average. The daily outflow rate μ = 1/20 from the recently vaccinated V pool to immunity R pool corresponds to a mean time of 20 days to develop antigens. The rate of asymptomatic cases is particularly difficult to calibrate. The Center for Evidence-Based Medicine has estimated this rate somewhere between 5 and 80 %.Footnote 8 He et al. (Reference He2020) found a 95 % confidence interval of [25 %, 69 %] for the proportion of asymptomatic cases. The U.S. Center for Disease Control and Prevention (CDC) has edited five scenarios of the pandemic with two plausible levels of the rate of asymptomatic, 0.2 and 0.5, with a central assumption at 0.35.Footnote 9 I assumed a κ = 35 % rate of asymptomatic people. The social contact matrix across age classes has been estimated in France by Béraud et al. (Reference Béraud2015). Social interactions go down with age, within and across age classes. I approximate their results by the following contact matrix:
 $$ {\alpha}_{..}=\left(\begin{array}{ccc}2& 0.5& 0.25\\ {}0.5& 1& 0.25\\ {}0.25& 0.25& 0.5\end{array}\right) $$
The social distancing policy is characterized by the lockdown intensities bl = 0, bm = 40 %, and bh = 80 %, and by the ICU thresholds (r1,rm,rh) of respectively 30, 60, and 90 % of the ICU capacity
 $ \overline{ICU} $
. The minimum rate of infection below which the virus can be obliterated in the population is assumed to be Imin = 30,000/n.
Wealth losses are measured in fractions of annual GDP (around 2400 billion euros). I assume that a full lockdown would reduce the flow of wealth production by ξ = 50 %, coming from a mixture of people who cannot telework and of the inefficient nature of teleworking technologies compared to work in presence. This is in line with the estimation of a 8.3 % of GDP loss in France in 2020, assuming a 20 % average intensity of lockdown during that year.Footnote 10 I assume an economic loss of a full confinement by a middle-aged person equaling 1/Nm. This means that a 100 % confinement of the middle-aged people without any telework capability during 1 year would generate a 100 % GDP loss. In this calibration, telework halves that loss. I also assume that confining a young or a senior person yields no economic loss. This is in line with the worrying fact that GDP does not take account of most contributions of these two age classes to the wealth of the nation.
In the benchmark calibration of the model, I prohibit immunity passports, so that ω = 0. Recovered and vaccinated people are assumed to be confined with the same intensity as susceptible people.
What is the cost of the vaccination campaign? The purchasing prices of the vaccines have mostly remained secret as I write this paper. The Belgian health authorities told the media that the EU purchased the AstraZeneca vaccine at a unit price of 2.15 euros.Footnote 11 Pharmacists are allowed to inoculate the vaccine in France since mid-March 2021. They are paid 10 euros per inoculation. Because two doses are necessary, I estimate the total cost of the vaccination to around 30 euros per person. This implies a total cost around 2 billion euros, or approximately p = 0.1 % of annual GDP.
In France in 2021, we have 6733 beds in ICU. The probability of requiring an ICU bed in case of infection has been estimated by Saltje et al. (Reference Saltje2020). It equals 0.01, 0.48, and 1.75 % for the three age classes.Footnote 12 It remains to calibrate the value of lives. I discuss this critical issue in Gollier (Reference Gollier2020a), remarking in particular that the absence of any democratic debate on this issue over the last five decades during which Western governments used a “value of statistical life” for policy evaluation is problematic. In this paper, I value a life lost at 100 annual GDP/cap, independent of age. This is aligned with the official VSL of 3 million euros in France (Quinet, Reference Quinet2013).
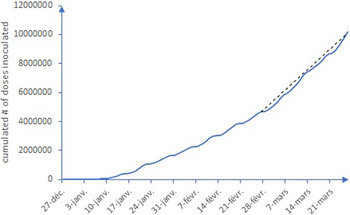
This benchmark calibration is summarized in Table 2. In my reference scenario, I will assume that France is able to maintain its current speed of vaccination at 200,000 doses per day (see Figure 2), that is 100,000 full vaccinations per day. This is compatible with a start of the vaccination campaign in late January 2021. In reality, the French campaign started earlier, but at a much lower speed.
Benchmark calibration of the SVIR model.

Cumulated number of doses inoculated in France during the first 3 months of 2021. The dashed curve corresponds to a speed of vaccination of 200,000 doses per day.

4 Welfare impacts of the vaccination campaign
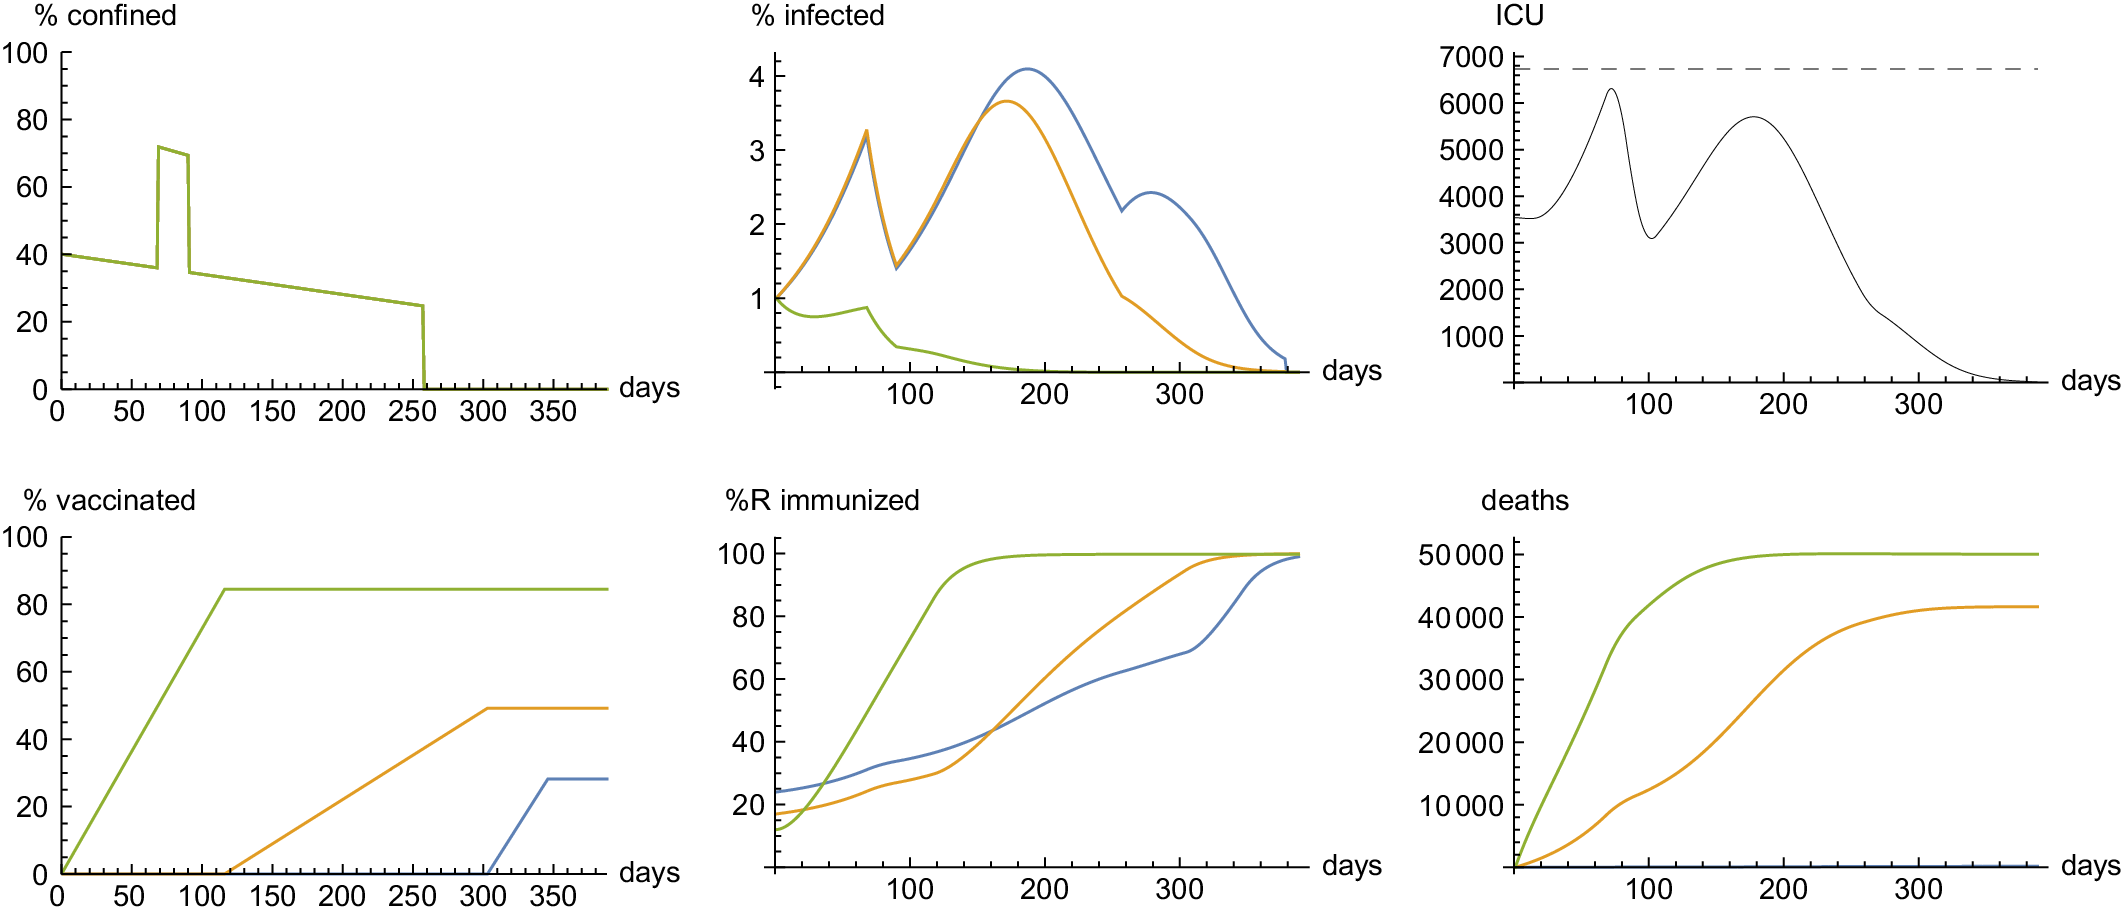
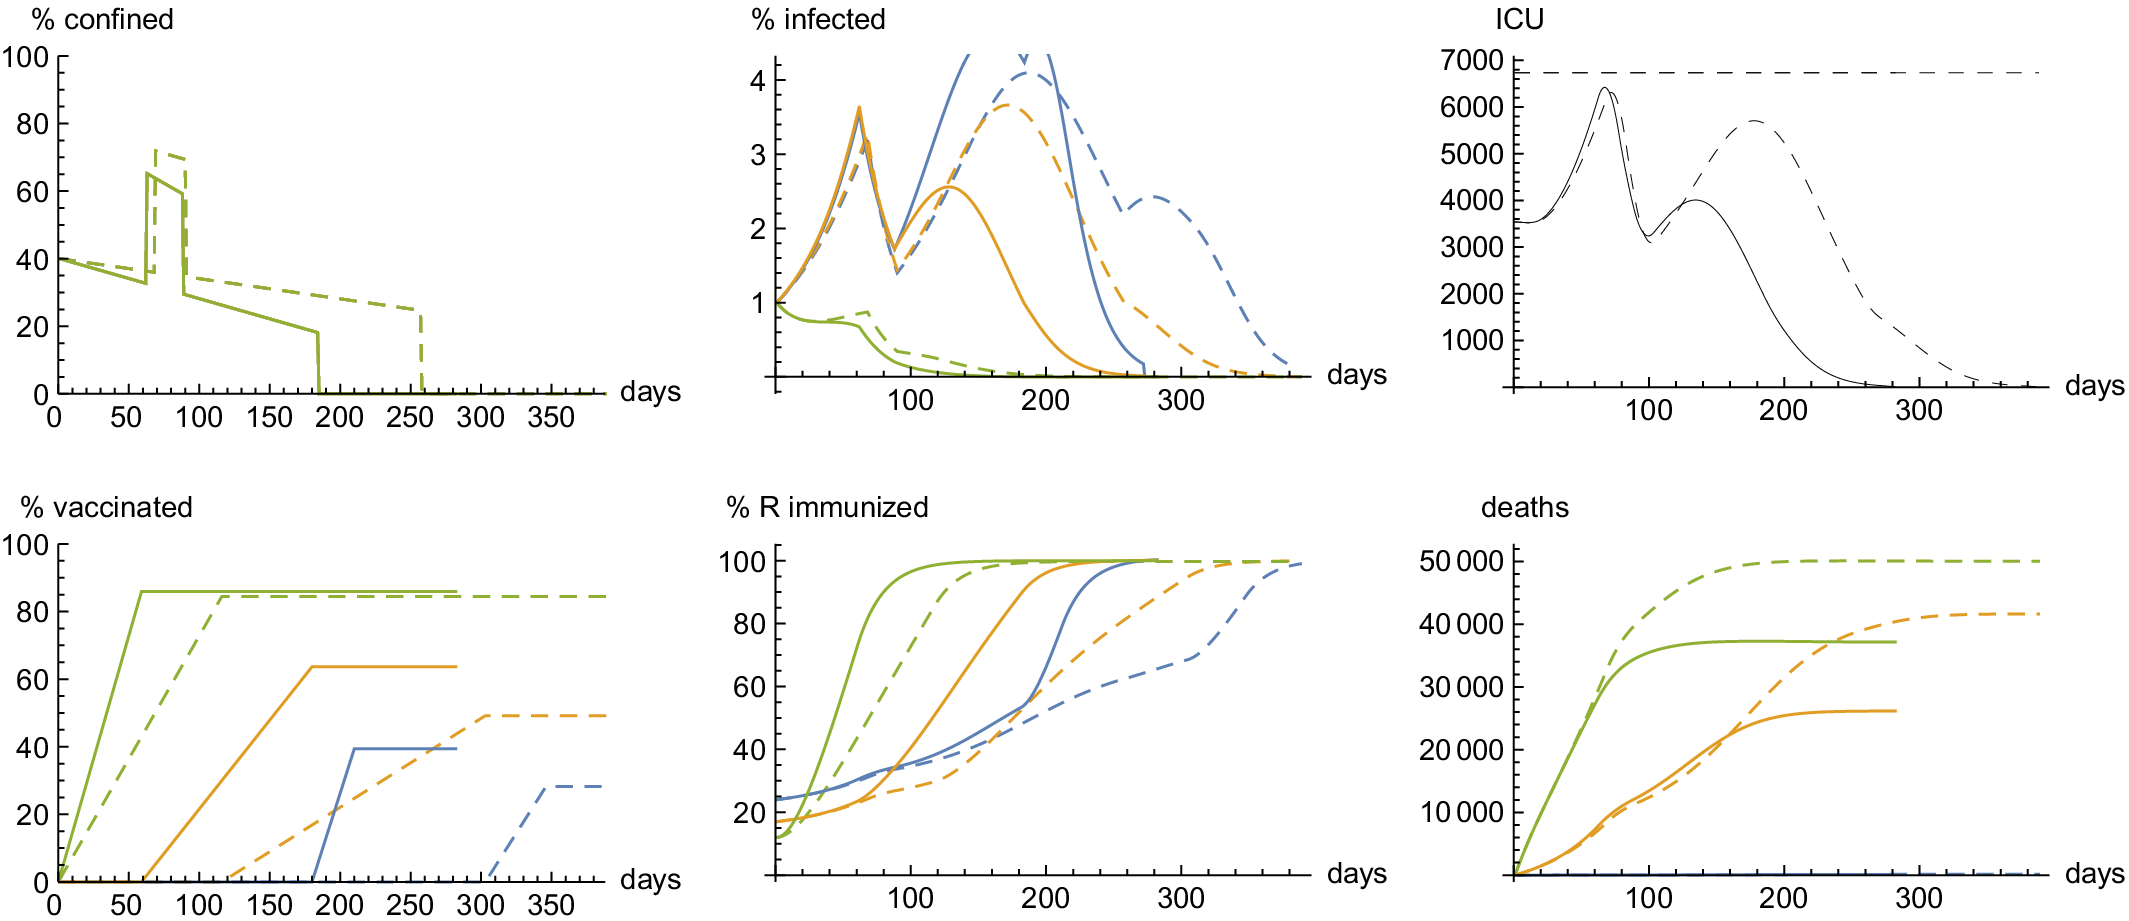
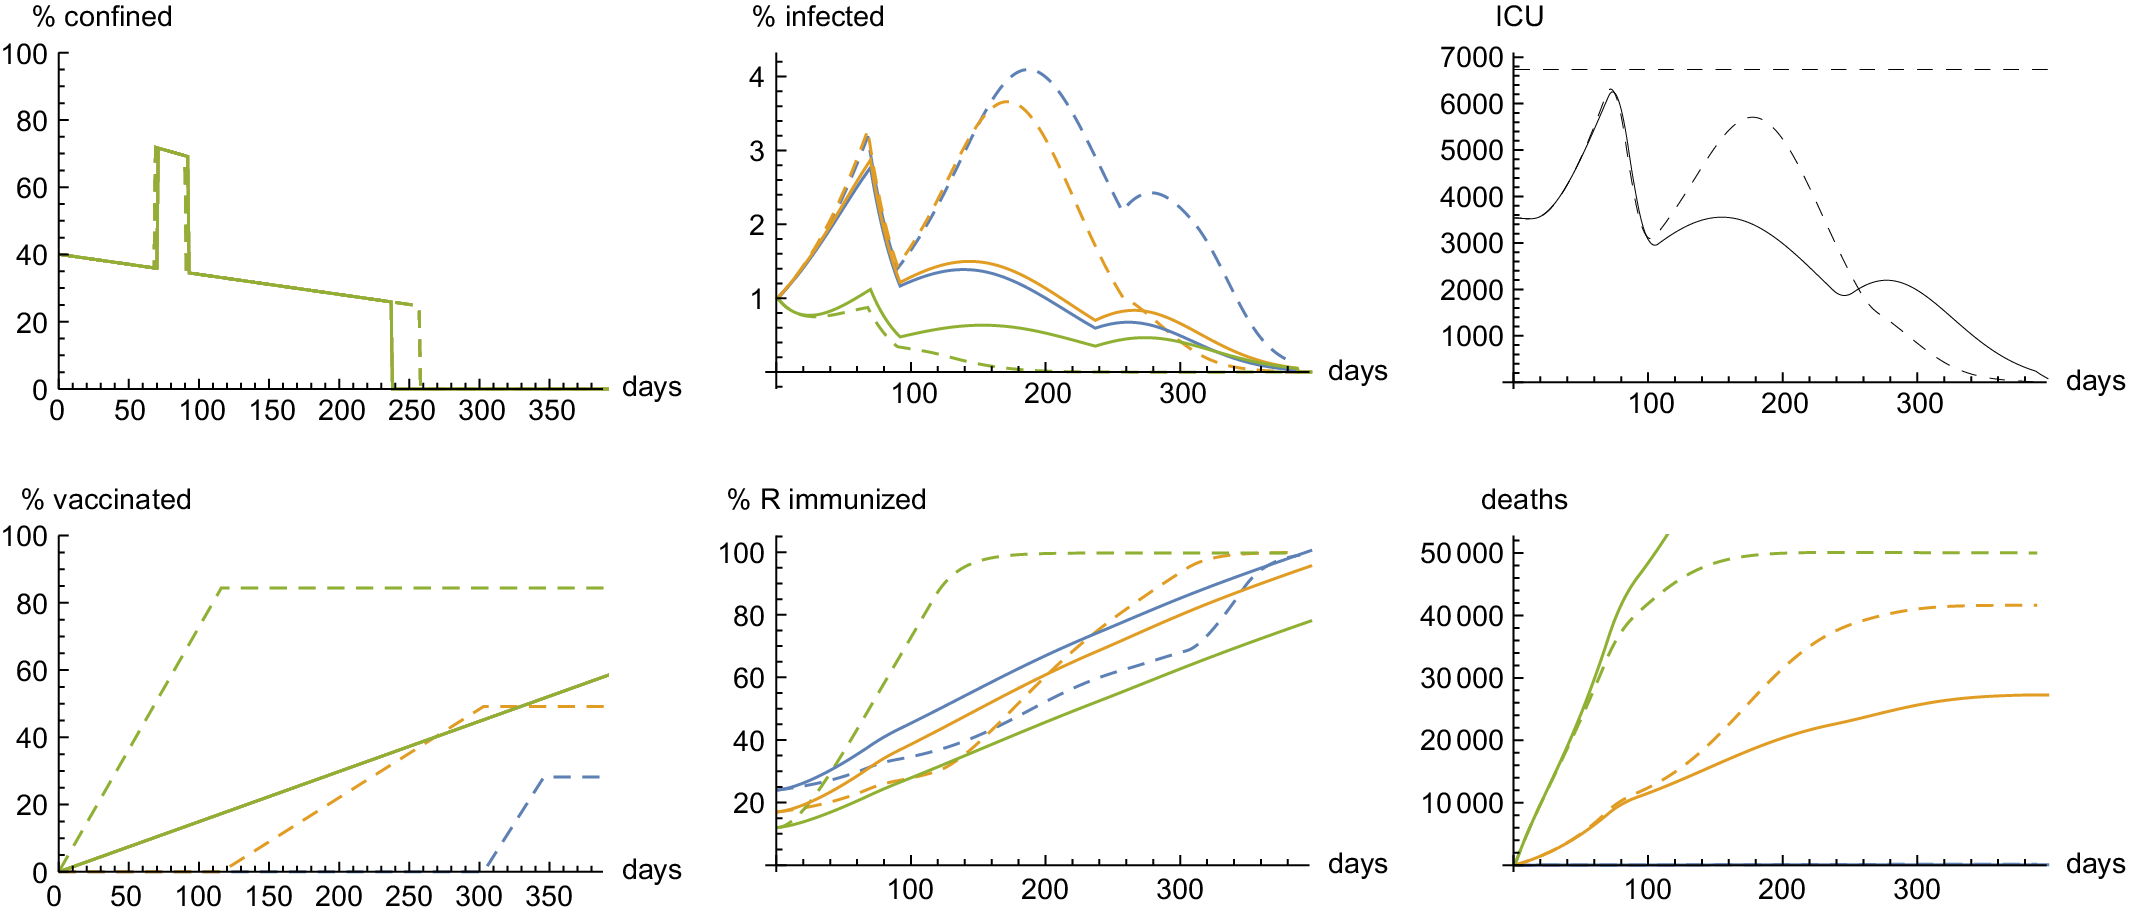
In this section, I examine the dynamics of the pandemic as a function of the speed of the vaccination campaign. In Figure 3, I describe this dynamics when a constant flow of 100,000 vaccinations per day is performed. This corresponds to the objective of vaccination of France for the spring of 2021. The two graphs on the left describe the health policy, in terms of the intensity of lockdown (top) and of vaccination (bottom). The seniors not yet naturally immunized are fully vaccinated within the first 110 days of the campaign. It takes 200 more days to vaccinate the middle-aged people that have not yet been infected at that time. The vaccination campaign is finished before the end of the year. A mild gradually decreasing lockdown is imposed for 260 days with a short period of strong lockdown after the first 2 months of the campaign to limit the exponential growth of ICU utilization that occurs at that time. This shows that the speed of vaccination is too slow to compensate for the large transmission rate of the new variant. When reversing to the milder intensity of lockdown, a new wave of the virus hits the country, but it concerns only the younger generations with a low rate of hospitalization. This implies that this second wave does not require imposing a new intense lockdown, in spite of the fact that the number of daily new cases is larger than during the first wave. Herd immunity is attained within 300 days from the vaccination campaign and from the fraction of the population that recovered from the infection.
Dynamics of the pandemic under 100,000 vaccinations per day. The blue, orange, and green curves correspond respectively to the young, middle, and old age classes.

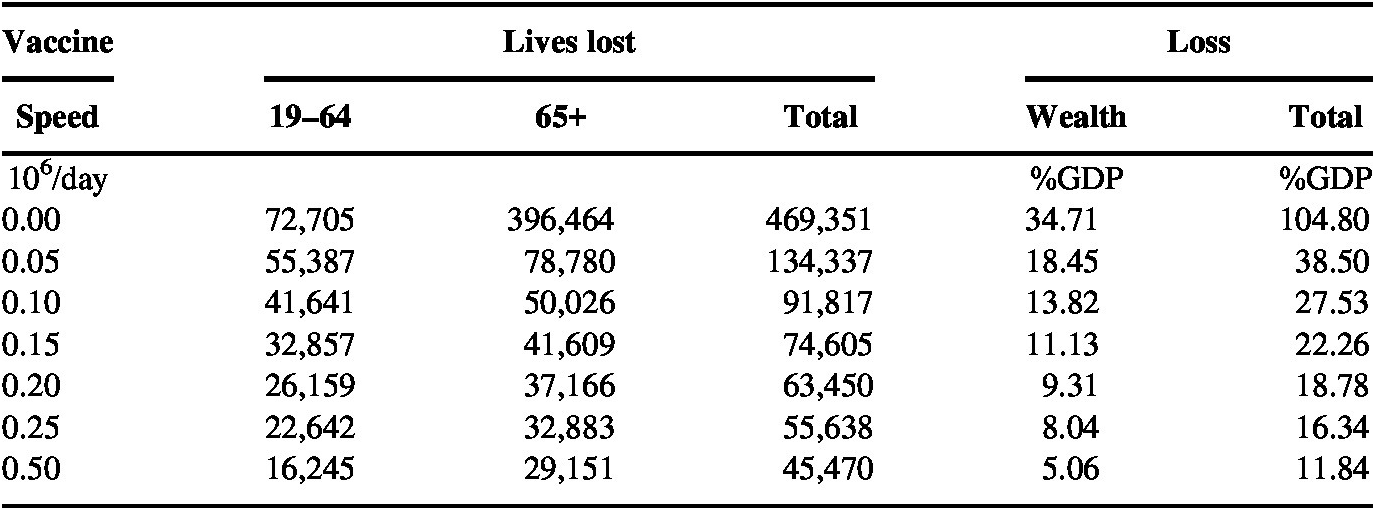
Table 3 describes the welfare costs of the pandemic from day 0 of the vaccination campaign. For this speed of 0.1 × 10⁶ vaccinations per day, one should expect 92,000 lives lost. The vaccination of the seniors is not fast enough to save 50,000 of them from the deadly new variant. The purely economic GDP loss in 2021 is estimated around 14 %, coming mostly from the extended duration of the lockdown. The cost of the vaccination campaign counts for 0.07 % of annual GDP. Finally, valuing lives at 100 years of annual GDP/cap raises the welfare cost of the pandemic from day 0 to 28 % of annual GDP.
Impacts of the pandemic as a function of the speed of the vaccination campaign, starting from day-0 of the campaign.

It is a useful theoretical exercise to compare this outcome to what would have happened in the absence of a vaccine. Under this scenario described in the first line of Table 3, the stop-and-go policy is a dead-end with no other outcome than herd immunity in the long run. A long succession of ups and downs in the lockdown policy will be necessary to preserve hospital, and herd immunity would be attained only after 3 years with a cumulative economic loss of 35 % of annual GDP. Under these catastrophic circumstances, the new variant would kill 470,000 people, 85 % of them being older than 65 years. This dismal outcome reminds us how bad was the news of the emergence of this B.1.1.7 variant on the eve of 2021 in France. The good news is that the 100,000/day vaccination campaign reduces the number of deaths among seniors by 87 % and among adults by 42 %. The economic loss of the pandemic is reduced from 35 to 14 % of annual GDP. The welfare loss is reduced by a factor 4 when aggregating economic and human costs of the pandemic.
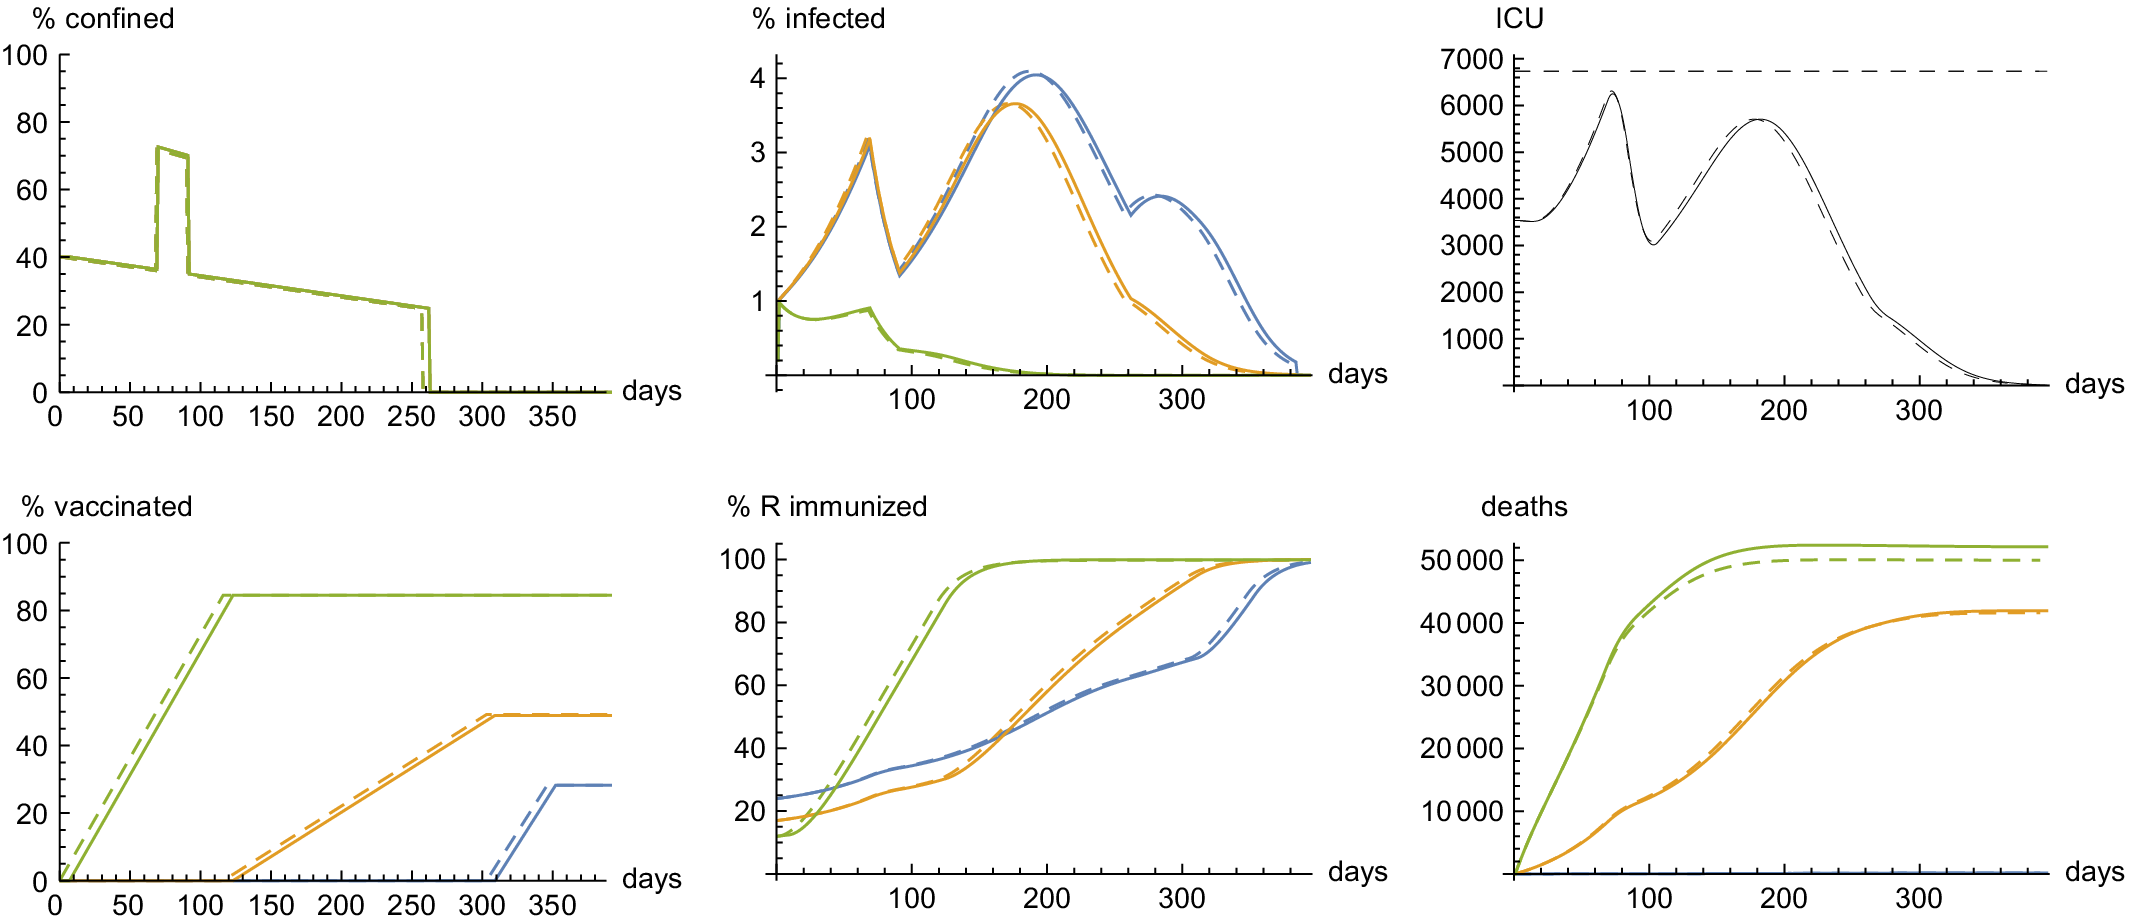
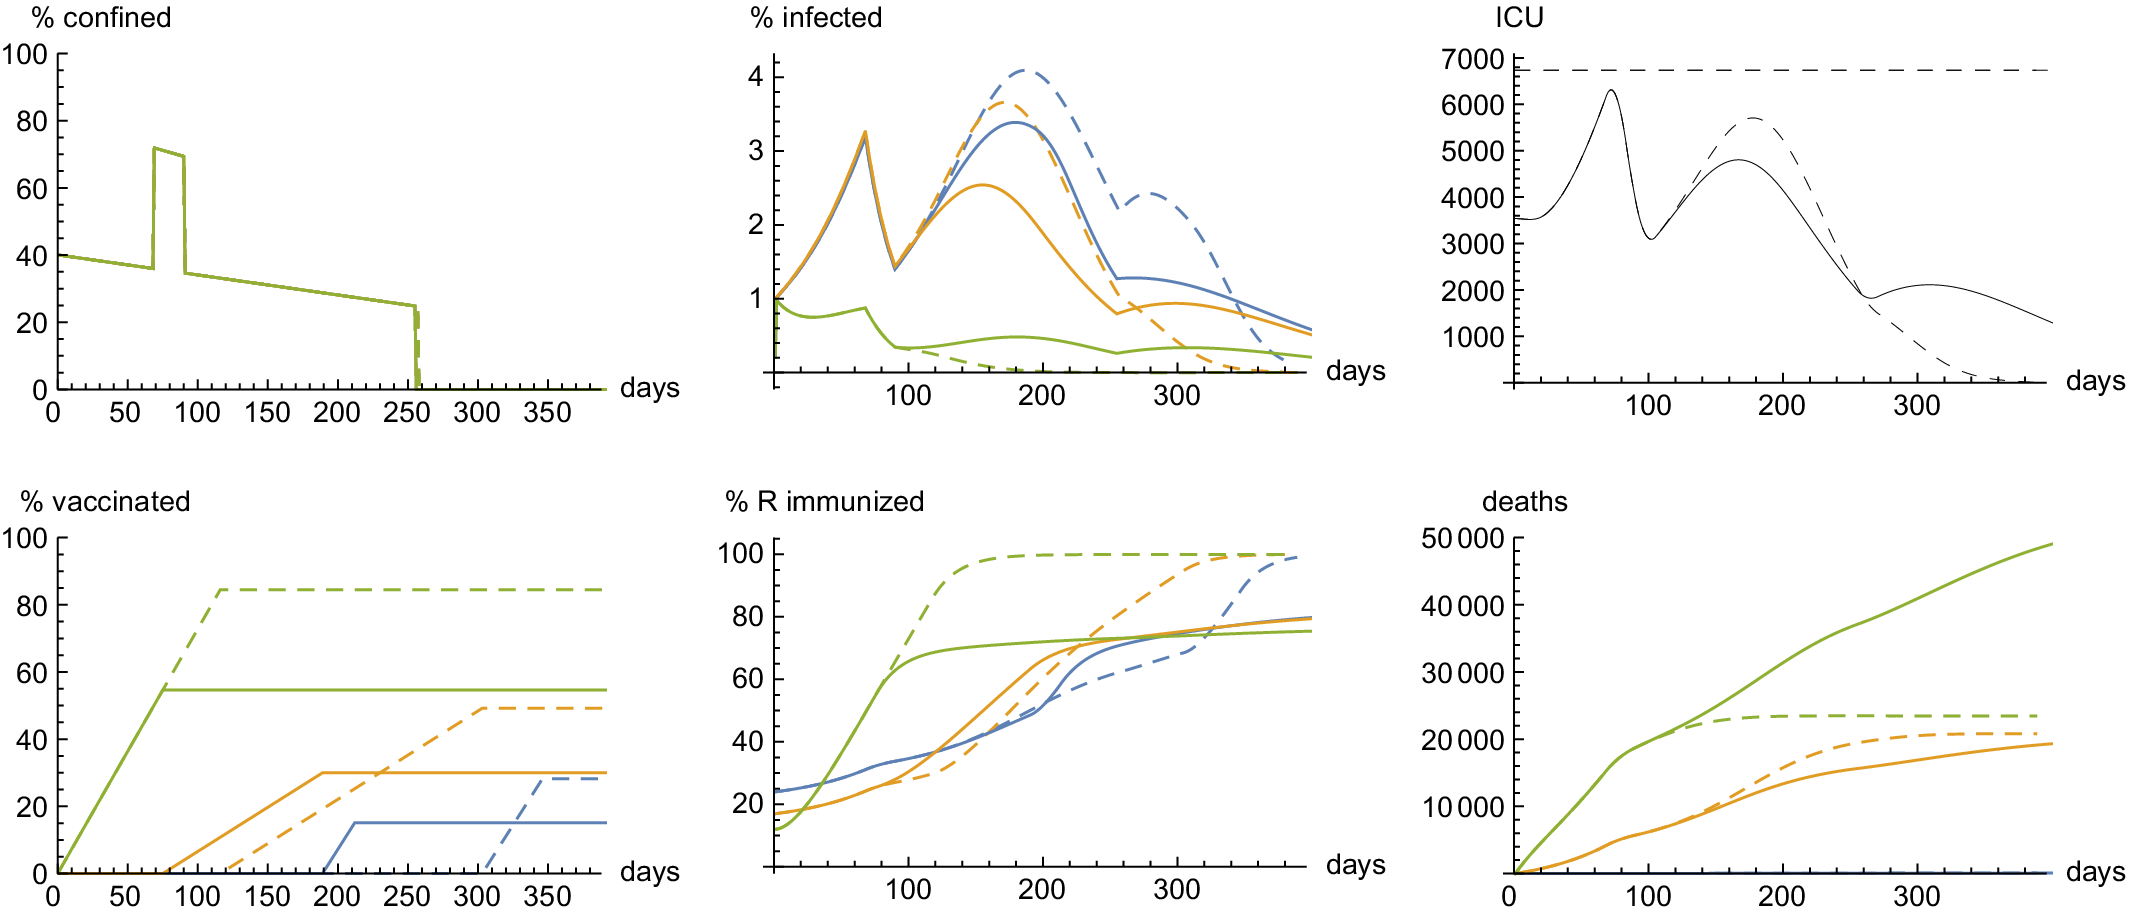
A key insight from Table 3 is the steeply decreasing nature of the marginal benefit of accelerating the vaccination campaign. If going from 0 to 100,000 vaccinations per day reduces the welfare cost of the pandemic by 73 %, going from a speed of 100,000–200,000/day reduces it by only 30 %. Three-quarters of the total cost of the pandemic since day 0 can be eliminated with the benchmark 100,000 speed. The dynamics of the pandemic under 200,000 vaccinations per day is described in Figure 4. The increased speed of vaccination is again primarily beneficial to the seniors in their race between vaccination and infection. But it also allows for a reduction of the intensity and of the duration of the lockdown, which is beneficial to the economy.
Dynamics of the pandemic under 200,000 vaccinations per day. Dashed curves correspond to the dynamics under the benchmark vaccination speed of 100,000 vaccinations per day.

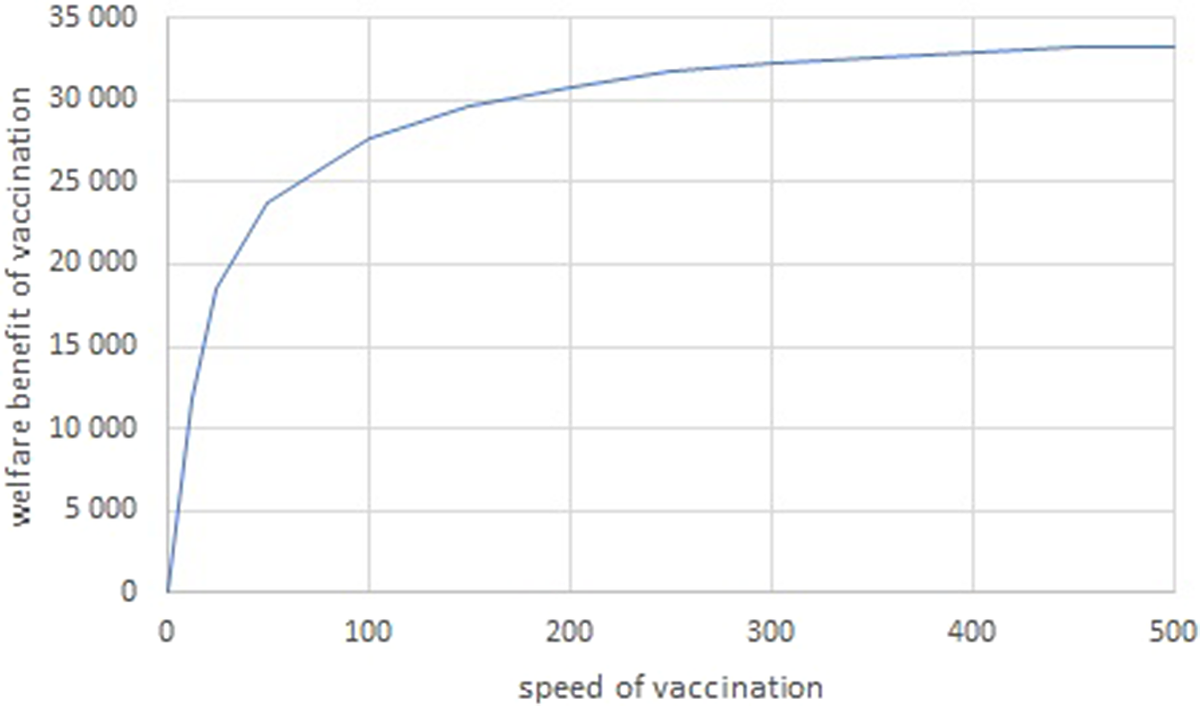
In Figure 5, I represent the welfare benefit of the vaccination campaign as a function of its speed. This welfare benefit is measured in euros per capita rather than by the reduction in total loss expressed in a fraction of annual GDP. For a speed of 100,000/day, it equals (0.1048–0.2753) multiplied by 2400 × 109 and divided by 67×106. It equals 27,679 euros per capita. For a unit cost of vaccination at 30 euros, this vaccination campaign has a social return of approximately 100,000 %.
Welfare benefit (in euros per capita) of the vaccination campaign as a function of the speed of vaccination (in thousands of vaccinations per day).

The decreasing marginal benefit of the speed of vaccination should not hide the fact that countries implementing a faster vaccination campaign will vastly outperform the others both in terms of lives saved and economic performances.
It is useful to measure the welfare cost of forcing immunized people to face the same restrictions as the remainder of the population in spite of the absence of any health and economic benefit of this egalitarian rule. The refusal of the immunity passport is based on an egalitarian principle that is symmetric to the prohibition of requiring a more intense lockdown for more vulnerable people. These prohibitions are not compatible with the minimization of the number of lives lost, or of the economic loss. Offering an immunity passport to immunized people, that is, replacing ω = 0 in the calibration by ω = 1, reduces the economic cost of the pandemic from 14 to 9.5 % in the benchmark case with 100,000 vaccinations per day.
In this paper, I combine a vaccination campaign with a stop-and-go policy of lockdown and social distancing. I follow this approach because most western governments currently consider that there is no socially acceptable alternative. But one may question whether this stop-and-go policy is optimal. In this section, I have shown that it is a viable policy in the context of the development of a massive vaccination campaign, which provides a medium term exit to the pandemic. It is legitimate to ask whether a “no-covid” policy would generate a better outcome. To answer this question, let me re-calibrate the same model with bl = bm = bh=0.8, that is, with the imposition of a 80 % lockdown until the rate of prevalence Imin is attained to eradicate the virus with a test-trace-and-isolate procedure. Under this no-covid policy, the rate of prevalence Imin is attained after 78 days to eradicate the virus. The economic loss is limited to 8 % of annual GDP, and fatalities are limited to 13,351. At a speed of vaccination of 100,000 per day, the vaccination campaign is almost irrelevant for this eradication strategy (although the herd immunity that the vaccination campaign creates is key for the stability of the no-covid outcome). Notice that this result favorable to the no-covid policy heavily relies on the possibility to implement an efficient test-trace-and-isolate strategy at the end of the lockdown, and on the necessity to coordinate such a policy at the EU level. It also raises the question of the social acceptability of a strong lockdown in the spring of 2021.
5 The welfare cost of delaying the start of the campaign
A simple way to measure the urgency of the vaccine is obtained from performing the thought experiment of a 1-week translation of the vaccination campaign. This experiment is related to the suspension by France and Germany (together with other EU members on a different time frame) of the AstraZeneca vaccine from the afternoon of Monday March 15 to the morning of Friday March 19. This interruption in the distribution of that vaccine (which represented half of the daily doses distributed in France in mid-March) was related to a suspicion of a lethal side effect after a number of people developed blood clots and thrombosis soon after receiving a dose.
Technically, as of 16 March 2021, around 20 million people in the UK and the EU had received the vaccine, and the European Medicines Agency (EMA) had reviewed 25 cases of blood clots in this cohort, 9 of which resulted in death. A causal link with the vaccine is not proven. Overall the number of thromboembolic events reported after vaccination was lower than that expected in the general population.Footnote 13
It is useful to compare this potential adverse effect of the vaccine with the additional lives lost and economic cost associated to delaying the campaign by one week. As shown in Table 4 and Figure 6, this delay to launch the campaign increases the death toll by 2481 and it reduces GDP by 0.34 %, or more than 8 billion euros. These estimations suggest that France suffered heavily from the half-week suspension of the AstraZeneca vaccination campaign, without any identified benefit. Moreover, the suspension reduced the public confidence in the vaccination.Footnote 14
Impacts of delaying the vaccination campaign by 1 week.

Dynamics of the pandemic under 100,000 vaccinations per day delayed to start on day 7. Dashed curves correspond to the dynamics under the benchmark vaccination speed of 100,000 vaccinations per day started on day 0.

6 The welfare cost of randomizing the allocation of the vaccine
In this section, I compare the outcome of the health policy when vaccines are prioritized on the basis of vulnerability (proxied in this model by age), to the outcome when no such priority is implemented. More precisely, I assume here that vaccines are randomly distributed until the whole population get inoculated. This is related to various tendencies to allocate the vaccine to specific groups of people on the basis of other principles than vulnerability. WHO (2020b) justified many of these alternatives principles to allocate priority to the vaccine, such as a compensation for front-line essential workers (health workers, teachers, etc.). Other allocation procedures are also discussed, such as the creation of a free market for the vaccine, or prioritizing the poor. Public decision-makers are indeed right to integrate other morale principles of justice when allocating the scarce vaccine supply. In this section, I inform them about the utility cost of integrating these other dimensions into their decisions, in the extreme case of an allocation procedure orthogonal to vulnerability.
It is noteworthy that my model cannot take account of the observed heterogeneity in the intensity of social interactions within a specific age-class. Specific individuals and professions have more potential than others to transmit the virus to vulnerable people. The best examples are health workers in nursing homes. There is a clear efficiency rationale for offering a high priority to these individuals.
I describe in Figure 7 the dynamics of the pandemic under a random distribution of the vaccine with 100,000 vaccination per day. Obviously, the randomization improves the welfare of those who were not prioritized in the benchmark, that is, the two younger classes. They are much less infected, and their mortality rate drops. The opposite outcome prevails for the seniors. Globally, the second wave imposes less stress to ICUs, but a high ICU utilization prevails longer at the end of the pandemic. Because the randomized vaccination procedure reduces the circulation of the virus, the virus can be erased earlier. This reduces the economic loss by 1 % of annual GDP, as shown in Table 5. But the global death toll is increased by 56,000 with 70,000 more fatalities among the seniors, whereas 14,000 middle-aged lives will be saved.
Dynamics of the pandemic under the 100,000 vaccinations per day when the vaccine is randomly distributed.

Impacts of fully randomizing the allocation of the vaccine.

7 The externalities generated by the anti-vaxxers
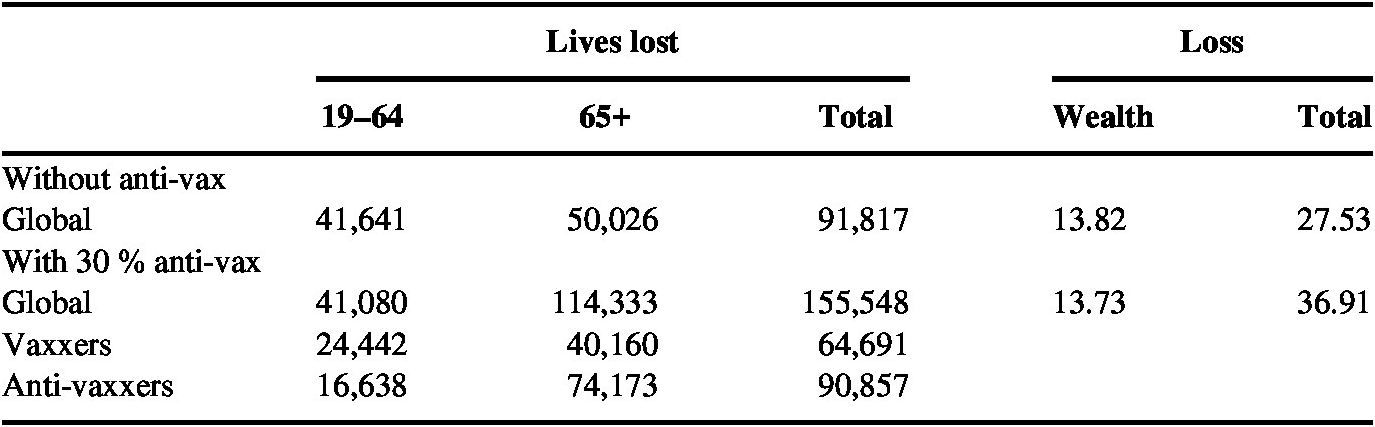
The presence of anti-vaxxers provides another illustration of the welfare cost of an inefficient allocation of the vaccines. France is the western country with the larger share of anti-vaxxers.Footnote 15 Suppose that 30 % of the French population, uniform across age classes, are going to prefer not to be inoculated. What are the consequences of these individual choices on social welfare? In Figure 8, I depicted the dynamics of the pandemic in that context. Table 6 summarize my findings. This phenomenon has several implications. First, many more senior anti-vaxxers will die. But because the virus will circulate more intensely in the senior age class, more senior vaccinated people who are not yet immunized (they have the V status) will also die. Remember that senior people interact much more within their own age class than with other classes, so that the presence of senior anti-vaxxers is a very bad news for other senior people. This illustrates the negative externality that the anti-vaxxers exercise on pro-vaxxers. How can we measure this effect? If everyone would be inoculated, we should expect 35,000 deaths among the senior pro-vaxxers. In reality, with 30 % anti-vaxxers in the population, I predict that 40,000 senior vaxxers will die. Thus, the negative externality of the anti-vaxxers on senior pro-vaxxers is estimated around 5000 additional deaths among this pro-vaxxer population.
Dynamics of the pandemic under the 100,000 vaccinations per day with 30 % anti-vaxxers in the population.

Impacts of 30 % anti-vaxxers.

A second effect comes from the fact that younger people will be inoculated earlier than in the benchmark scenario. The virus will circulate less in these age classes as soon as they start their vaccination period. Globally, the ICU capacity is more stressed because of the misallocation of the vaccine during that second wave with many senior people needing intensive care. But the net effect of the presence of anti-vaxxers on middle-aged pro-vaxxers is positive. Indeed, without the anti-vax movement, one should expect 29,000 lives lost among middle-aged pro-vax at the end of the pandemic. Thanks to the anti-vaxxers, this death toll is limited to 24,000 for this category of people, a reduction by 5000 deaths. This is a positive externality from the anti-vax movement. At the aggregate level across age classes, 419 more pro-vaxxers will die due to the presence of the anti-vaxxers. It is noteworthy that I assume that all people that are vaccinated and that are not infected before producing antigens become fully immunized. This assumption is based on currently available scientific information about the efficacy of the three vaccines used in France.Footnote 16 In an initial version of this paper, I assumed an efficacity rate of 95 %, which implied a much larger global negative externality from anti-vaxxers.
On their side, the anti-vaxxers benefit from the herd immunity built by the vaccination effort of the pro-vaxxers. At the aggregate level, if nobody would get the vaccine, one should expect that 141,000 anti-vaxxers will die. But the presence of the pro-vaxxers in the population will reduce the death toll faced by the anti-vaxxers to 91,000, a 35 % reduction. This is the positive externality exercised by pro-vaxxers on anti-vaxxers.
Finally, the global effect of a 30 % strong anti-vax movement would increase the death toll by 64,000, a 69 % increase compared to the benchmark without the movement and an efficient vaccination campaign of 100,000 vaccinations per day. The presence of anti-vaxxer has a small positive effect on the economy by reducing the duration of the lockdown.
8 The welfare cost of vaccine nationalism
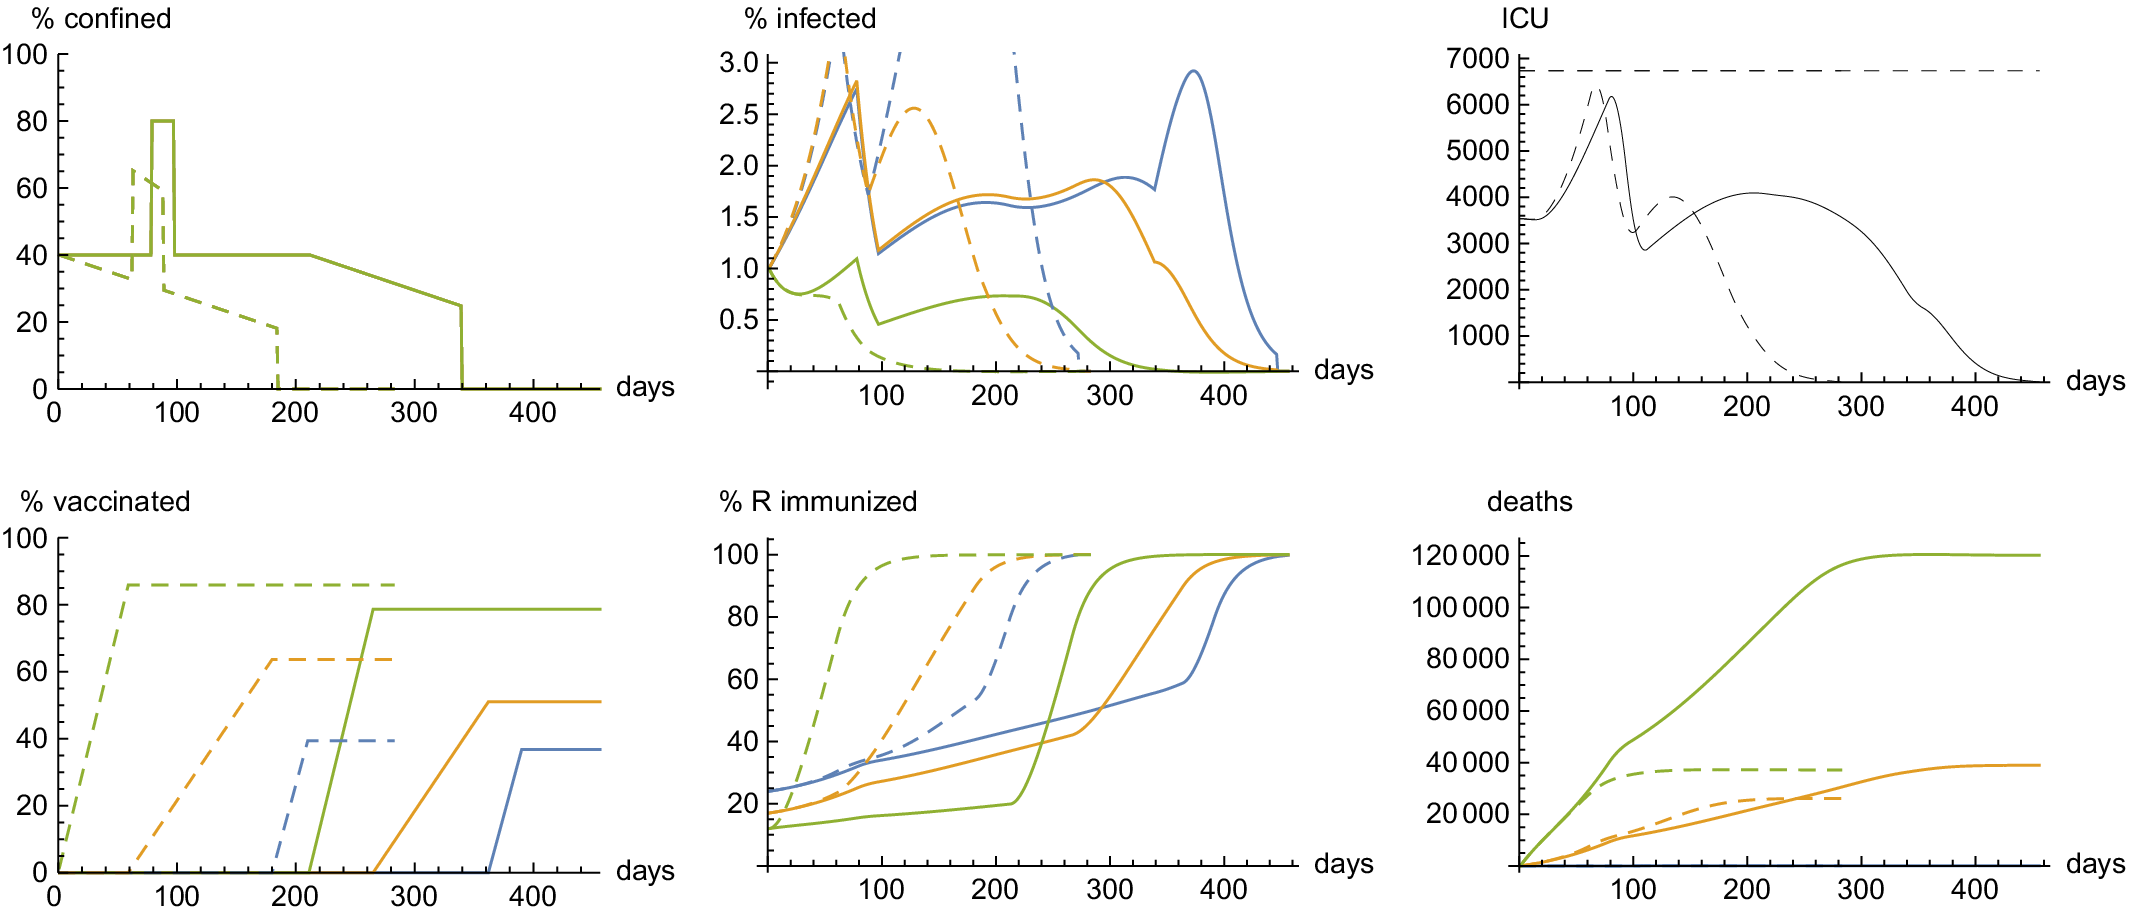
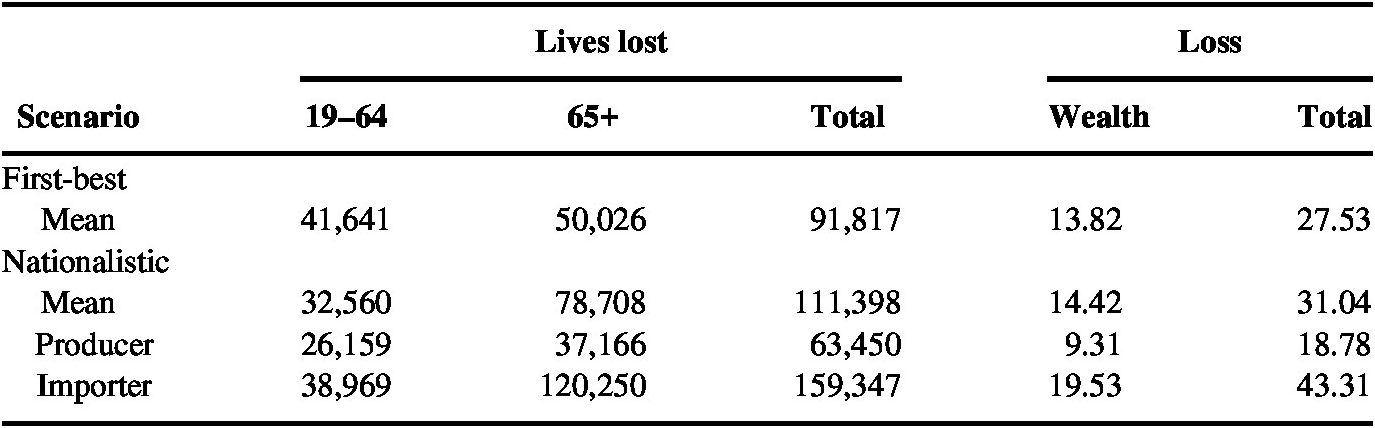
Vaccine nationalism is another good example of misallocation of a vaccine, because vulnerable people in importing countries will be vaccinated (if they survive) potentially long after people with much lower risk in vaccine-rich countries. To explore this effect, let me examine the following thought experiment. Suppose that the world is made up of two identical Frances as described in this paper, except that one France, named the producer, controls the unique production site of the vaccine whereas the other must import the vaccine for its vaccination campaign. Finally, suppose that the production site has a production capacity of 200,000 vaccines per day. I compare two solutions. In the first-best solution under the veil of ignorance, the two countries equally share the resource by vaccinating 100,000 people each every day. Figure 3 describes the dynamics of the pandemic in the two countries in that context. Suppose alternatively that the producing country is able to secure priority in the allocation of the vaccine so that its whole population must be vaccinated before allowing exportation. For the producing country, the dynamics of the virus is described in Figure 4.
In the nationalistic scenario, the importing country must wait 211 days before starting its vaccination campaign. In that country, this long delay has dramatic consequences in terms of lives lost that is only partially compensated by the more intense and longer lockdown, as described in Figure 9. I summarized the impacts of the different international allocations of the vaccine in Table 7. The importing country must maintain some form of social distancing rules for almost 1 year, whereas the producing country can fully exit the pandemic within 6 months. This implies that the economic damage in that country is more than twice its equivalent in the producing country. And the death toll at the end of the pandemic is more than 150 % larger in the importing country. Given the large discrepancy between the intensities of the health and economic crises incurred by the producing and importing countries, it is illusory to expect any politically acceptable cooperation to allocate the vaccine capacity efficiently at the international level, in spite of the efforts of the World Health Organization (COVAX).
Dynamics of the pandemic in the thought experiment of vaccine nationalism. The importing country (plain curves) starts its vaccination campaign on day 211 after the producing country (dashed curve) has fully vaccinated its population.

Impacts of vaccine nationalism.

Because of the vastly inefficient allocation of the vaccine in this nationalistic scenario, the worldwide death toll is 20 % larger than under the first best allocation, yielding 39,000 additional deaths globally. Because the wealth creation technology used in this model is linear, the average economic loss of the pandemic is increased only marginally, from 13.82 % of world annual GDP to 14.42 %. Global welfare is reduced by approximately 13 %.
9 Conclusion
Because the degree of vulnerability to the B.1.1.7 variant is highly sensitive to individual characteristics such as the age of the infected person, and because the covid vaccines are a scarce resource in 2021, it is critically important to allocate them wisely. If the objective is to minimize the welfare loss, the optimal solution is to give vaccination priority to the most vulnerable people. I first show that, under this optimal rule, the marginal benefit of the vaccine quickly decreases with the cumulated number of vaccinated people in the population. The key issue is to vaccinate the most vulnerable people quickly, so that the pressure on ICUs and hospitals can be relaxed, together with the intensity of the lockdown. For France, the planned speed of vaccination is not sufficient to compensate for the emergence of the highly transmissible variant, so that the intensity of the lockdown must be temporarily increased to “flatten the curve.” The race undertaken by our vaccination campaign against the variant cannot be won in the short term given its high virulence and the lack of vaccination capacity. However, the current vaccination capacity at 100,000 vaccinations per day, if maintained permanently at that level, would reduce the welfare cost of the pandemic by 74 %. Doubling the vaccination capacity would only reduce the welfare cost by an additional 8 % (to 82 % of the initial cost). This result should not hide the dismal death toll of the pandemic.
The objective of this paper was to estimate the welfare cost of the misallocation of the vaccine, with a special focus on the consequences of the vaccine nationalism that is currently raging in the western world. By vaccinating low-risk people in vaccine-rich countries before high-risk people in vaccine-poor countries, we worsen the global welfare consequences of the pandemic. There is no doubt that the vaccine-rich countries will greatly benefit from hoarding their vaccine. But under the veil of ignorance, this allocation is undesirable. In a simple two-country model, I show that the extreme form of vaccine nationalism in which vaccine-rich countries fully prioritize their own population before exporting their vaccine, the global death toll could be increased by 20 %.
The allocation of the vaccines entails a large range of societal issues. Counting the number of additional fatalities and the additional GDP loss of the different possible allocations provides only a partial view of the deeper societal questions that emerge in this context. For example, some workers have faithfully accepted to expose themselves to the virus to save other lives, or to exercise essential activities for the economy. Decision-makers may consider a reciprocity or recognition measure that could take the form of giving them priority for the vaccine. My ambition in this paper is limited to the measure of the measurable costs of such a decision, in terms of expected lives lost and economic loss. Finally, my estimations should be taken with caution, given the many uncertainties surrounding many parameters of the standard SIR model calibrated on the new variant.
Acknowledgment
I thank J. Zheng and participants to my keynote lecture at the 14th Financial Risks International Conference in Paris for helpful comments. The research leading to these results has received the support from the ANR grants Covid-Metrics and ANR-17-EURE-0010 (Investissements d’Avenir program).