Introduction
The first pregnancy from preimplantation genetic testing (PGT) was reported in 1990 (Handyside et al., Reference Handyside, Kontogianni, Hardy and Winston1990). This technology has shown a marked advancement in the last decade, particularly with the change from polar body and blastomere biopsy to blastocyst trophectoderm (TE) biopsy. TE biopsy has been recognized as a more effective and informative procedure compared with cleavage-stage and polar body biopsy. More importantly, the removal of a few TE cells from a blastocyst has been proven to have less effect on embryonic developmental potential when compared with cleavage-stage biopsy (Scott KL et al., Reference Scott, Hong and Scott2013; Scott RT et al., Reference Scott, Upham, Forman, Zhao and Treff2013).
Blastocysts are usually cryopreserved to provide sufficient time for genetic testing. This strategy postpones embryo transfer to the subsequent frozen embryo transfer (FET) cycle. There were many factors associated with the outcomes in PGT–FET cycles, including the developmental stage of blastocysts (days 5, 6, or 7), the biopsy methods applied (Zhao et al., Reference Zhao, Tao, Li, Liu, Wu and Ma2019), the number of cells biopsied (Guzman et al., Reference Guzman, Nunez, Lopez, Inoue, Portella, Vizcarra, Noriega-Portella, Noriega-Hoces and Munne2019), the quality of blastocysts, and the testing methods used (Homer, Reference Homer2019).
The implementation of vitrification has enhanced embryo cryo-survival rates of up to more than 99% (Cimadomo et al., Reference Cimadomo, Capalbo, Levi-Setti, Soscia, Orlando, Albani, Parini, Stoppa, Dovere, Tacconi, Ievoli, Maggiulli, Ubaldi and Rienzi2018). It is generally believed that there is a negative correlation between the blastocyst cavity volume and the survival rate and clinical outcomes during FET. Large blastocyst cavity volume is associated with increased ice crystal formation, reduced survival rate and compromised clinical outcomes (Hiraoka et al., Reference Hiraoka, Hiraoka, Kinutani and Kinutani2004; Darwish and Magdi, Reference Darwish and Magdi2016; Levi-Setti et al., Reference Levi-Setti, Menduni, Smeraldi, Patrizio, Morenghi and Albani2016). Blastocysts are usually shrunken using laser pulse before biopsy and gradually re-expand after the biopsy. To what extent the interval time between TE biopsy and vitrification influences the clinical outcomes remains controversial. Hsiu-Hui Chen and colleagues (Chen et al., Reference Chen, Huang, Cheng, Lee, Chien and Lee2017) reported that the optimal interval time was 3 h after the biopsy. Maggiulli et al. (Reference Maggiulli, Giancani, Cimadomo, Ubaldi and Rienzi2019) revealed that vitrification within 30 min tended to result in a higher live birth rate. However, the results did not reach statistical significance. The European Society for Human Reproduction (ESHRE) PGT Consortium recommended cryopreserving blastocysts as soon as possible before re-expansion. However, it did not provide the exact maximum threshold for the interval time (ESHRE PGT Consortium and SIG-Embryology Biopsy Working Group et al., Reference Kokkali, Coticchio, Bronet, Celebi, Cimadomo, Goossens, Liss, Nunes, Sfontouris, Vermeulen, Zakharova and De Rycke2020).
The interval time between TE biopsy and vitrification is a crucial factor. It is necessary to set a late-time threshold, especially in a heavy workload laboratory setting. However, it remains unclear to what extent the interval time influences the clinical outcomes and what late-time threshold of the interval time is acceptable. That is the question this study aimed to address.
Materials and methods
Patient population
This study was a retrospective single-centre study that included PGT–FET cycles at the clinic of Chongqing Health Center for Women and Children from January 2015 to December 2019. There were 623 PGT–FET cycles during the study period. To eliminate the influence of potential confounders, the following cycles were excluded: with thawed embryos (n = 19), double blastocyst transfers (n = 50), biopsy on day 6 or day 7 embryos (n = 156), and lack of details for the vitrification (n = 51). PGT cycles for monogenic disease (PGT-M) were also excluded from this study (n = 50). Finally, the remaining 297 cycles with single day 5 euploid blastocyst transfer were recruited, including preimplantation genetic testing for chromosomal structural rearrangement (PGT-SR; n = 218) and preimplantation genetic testing for aneuploidy (PGT-A; n = 79).
These cycles were divided into three groups according to the different interval times between TE biopsy and vitrification: <1 h group, 1–2 h group, and ≥2 h group. Blastocyst survival, clinical pregnancy, miscarriage, and ongoing pregnancy rates were compared across the three groups in PGT-SR and PGT-A cycles.
The flow chart (Fig. 1) demonstrates the patient population selection. All patients signed informed consent forms for all the procedures during PGT treatment. This study was approved by the Institutional Review Board of Chongqing Health Center for Women and Children.
Flow chart of the patient selection process.

Ovarian stimulation, oocyte retrieval, and insemination
Two ovarian-stimulation protocols were used in this study: the gonadotropin-releasing hormone (GnRH) long agonist protocol and the GnRH antagonist protocol. The stimulation protocols used were mainly based on individual patient characteristics. Human chorionic gonadotropin (HCG; Ovidrel, Merck Serono, Italy) was administered when at least three follicles were measured at >18 mm. Transvaginal oocyte retrievals were performed 36 h after HCG injection. The ovarian-stimulation, oocyte-collection, and denudation procedures were performed as described previously (Ye et al., Reference Ye, Huang, Zeng and Pei2009).
To minimize the risk for both maternal contamination from residual cumulus cells and paternal contamination from surplus sperm attached to the zona pellucida (ZP), all the mature oocytes were inseminated using intracytoplasmic sperm injection (ICSI) under an inverted microscope by three experienced embryologists. The embryo culture programme was conducted according to the routine of our centre (Xiong et al., Reference Xiong, Han, Liu, Zhang, Liu, Liu and Huang2011).
Blastocyst biopsy and next-generation sequencing
In the morning of day 3 following the procedure (˜68–72 h after ICSI), an ˜10-μm hole on the ZP was created using a 180-μs laser pulse (Lykos, Hamilton Thorne Bioscience, USA). After ZP opening, embryos were rinsed several times with G2 medium, transferred to fresh G2 medium, and cultured in time-lapse monitored incubators until the blastocyst stage. Blastocysts with the TE cells herniated from artificial openings on day 5, day 6, or day 7 were transferred to a culture dish containing four microdroplets of G-MOPS medium (VitroLife Sweden AB, Sweden) and overlaid with 5 ml of mineral oil (VitroLife Sweden AB, Sweden) for further biopsy. Briefly, the blastocysts were secured on the holding pipette with TE cells herniated at approximately the 3 o’clock position. The herniated TE cells were then gently aspirated using the biopsy pipette while laser pulses were applied to remove the TE cells. After 3–5 laser pulses, TE cells were removed by a quick flicking movement of the biopsy pipette against the holding pipette. No more than five laser pulses were applied for each blastocyst.
Only blastocysts graded no lower than 4BB were biopsied in our centre. On average, 4–8 TE cells were removed from each blastocyst. After the biopsy, TE cells were rinsed three times in G-MOPS medium (VitroLife Sweden AB, Sweden) before being transferred to the PCR tubes. Whole-genome amplification (WGA) of the TE cells was conducted within 1 week after the biopsy prior to sending samples for sequencing using a next-generation sequencing (NGS) platform.
Blastocyst vitrification and thawing procedures
After biopsy, blastocysts were vitrified as previously described (Xiong et al., Reference Xiong, Liu, Gao, Liu, Wu, Han, Zhang, Han, Liu and Huang2016). Briefly, blastocysts were first suspended in equilibration solution for 12–15 min, followed by exposure to the vitrification solution for 45–60 s. Finally, blastocysts were loaded onto the tip of a Cryotop and immediately plunged into liquid nitrogen. The interval time between TE biopsy and vitrification was chosen according to the working arrangement in the laboratory during the study period. The exact interval time was recorded for each blastocyst. There were no further artificial shrinkages performed before blastocyst vitrification.
Thawing of blastocysts was performed with a four-step protocol. First, vitrified blastocysts placed on the tip of a Cryotop were dipped into 1.0 M sucrose solution (TS), which had been preheated to 37°C for 2 h, and remained submerged for 1 min. Blastocysts were then suspended in 0.5 M sucrose solution (DS) for 3 min, WS1 for 5 min, and WS2 for 1 min, respectively, in sequence. Finally, blastocysts were transferred to G2 medium (G2; VitroLife Sweden AB, G€ Goteborg, Sweden) and cultured in a 37°C, 6% CO2 in air incubator until being transferred the following day.
The Cryotop and Kitazato Vitrification Kit (Kitazato BioPharma Co., Shizuoka, Japan) was used in all freezing and thawing procedures. Vitrification and thawing processes were performed at room temperature (˜25°C).
Blastocyst transfer and pregnancy diagnosis
Blastocyst transfer was performed under the guidance of transabdominal ultrasound. Following the procedure, women were advised to rest for 0.5 h after transfer. The luteal phase was supported by the combination of oestrogen and progesterone. Serum β-hCG was measured 14 d after embryo transfer. Clinical pregnancy was established when the gestational sac was detected using transvaginal ultrasound 28 d after embryo transfer.
Statistical analysis
Statistical analysis was performed using Stata version 10.0. Quantitative data were expressed as mean ± standard deviation (SD) and compared across all groups using analysis of variance (ANOVA). The differences between groups were compared pairwise using the least squares method. Clinical pregnancy, miscarriage, and ongoing pregnancy rates were presented as percentages and compared using the trend chi-squared test. A P-value of <0.05 was considered statistically significant.
Results
There were 623 PGT–FET cycles during the study period. Following the selection criteria, 297 cycles with single day 5 euploid blastocyst transfer were recruited, including PGT-SR (n = 218) and PGT-A (n = 79). Overall clinical pregnancy and ongoing pregnancy rates were 65.32% (194/297) and 54.55% (162/297), respectively. There was no blastocyst degeneration after biopsy and 99% of the blastocysts survived after thawing.
We first analyzed the PGT-SR cycles with single day 5 euploid blastocyst transfer (n = 218). The demographic characteristics are shown in Table 1. No differences in age, treatment attempts, BMI, and thickness of the endometrium were found among the three groups. However, the numbers of oocytes retrieved, MII oocytes, and transferable embryos on day 3 in the ≥2 h group were significantly higher than that in the 1–2 h group. There was also a tendency towards a higher number of blastocysts biopsied in the ≥2 h group compared with the 1–2 h group. Furthermore, both the 1–2 h and ≥2 h groups included some blastocysts that failed to survive the thawing process. The survival rate in the ≥2 h group was 96.72%, significantly lower than that in the 1 h group (100%, P = 0.047). In general, the above results indicated that prolongation of the interval time between TE biopsy and vitrification had a detrimental effect on blastocyst survival.
Demographic characteristics in PGT-SR cycles

Values are presented as mean percentage (%) ± standard deviation (SD).
Note: MII oocyte, metaphase II oocyte; OPU, oocyte pick up.
* Means the comparison between these two groups.
The clinical outcomes in PGT-SR cycles are compared in Table 2. The overall clinical pregnancy and ongoing pregnancy rates in PGT-SR cycles were 66.97% (146/218) and 56.88% (124/218), respectively. The clinical pregnancy rate in the <1 h group was 74.26%, significantly higher than that in the ≥2 h group (55.93%, P = 0.017), which also tended to be higher than that in the 1–2 h group (65.52%, P > 0.05). The ongoing pregnancy rate in the <1 h group was 67.33%, significantly higher compared with the 1–2 h and ≥2 h groups (48.28% and 47.46%, respectively, P < 0.05). The miscarriage rate in the 1–2 h group was 18.42%, significantly higher than that in the <1 h group (5.33%, P = 0.027). There were no statistical differences in the miscarriage rate between the 1–2 h and ≥2 h groups (12.12%, P = 0.464). In general, the above results suggested that clinical outcomes were compromised by prolongation of the interval time between TE biopsy and vitrification.
Clinical outcomes in PGT-SR cycles

Values are presented as percentages (%).
* Means the comparison between these two groups.
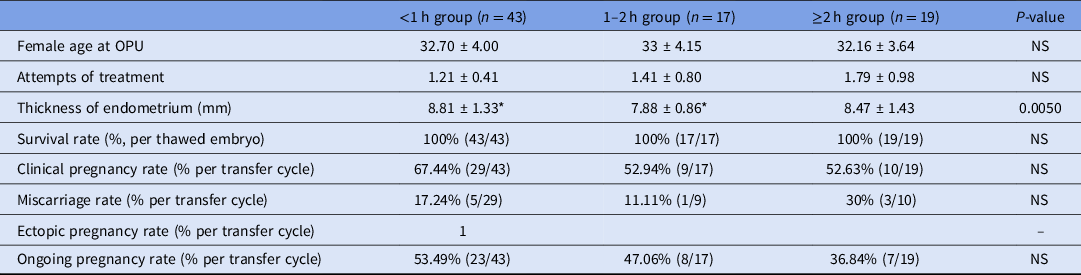
Next, PGT-A cycles with single day 5 euploid blastocyst transfer were compared (Table 3, n = 79). Consistently there were no statistical differences in the female age at oocyte retrieval, attempts of treatment, and survival rate after thawing. The mean endometrium thickness from women in the <1 h group was higher than that in the 1–2 h group (P = 0.0050). The overall clinical pregnancy and ongoing pregnancy rates in PGT-A cycles were 60.76% (48/79) and 48.10% (38/79), respectively. The corresponding rates in the <1 h group were 67.44% and 53.49%, which tended to be higher than that in the 1–2 h group (52.94% and 47.06%) and the ≥2 h group (52.63% and 36.84%). However, the differences did not reach statistical significance.
Demographic characteristics in PGT-A cycles

Values are presented as number (%) or mean ± standard deviation (SD).
Note: OPU, oocyte pick up.
* Means the comparison between these two groups.
Discussion
This study aimed to evaluate the effects of different interval times between TE biopsy and vitrification on the outcomes of PGT–FET cycles. The results from PGT-SR cycles indicated that the survival, clinical pregnancy, and ongoing pregnancy rates in the ≥2 h group were significantly lower than that in the <1 h group. The miscarriage rate in the 1–2 h group was significantly higher than that in the <1 h group. Data from PGT-A cycles showed that the clinical pregnancy and ongoing pregnancy rates in the ≥2 h group had a decreasing trend when compared with the <1 h group. The above results revealed that embryo survival and clinical outcomes were compromised with prolongation of the interval times between TE biopsy and vitrification in PGT–FET cycles.
At the beginning of this study, prolonged interval times between TE biopsy and vitrification were expected to yield the optimal clinical outcomes based on the study by Hsiu-Hui Chen and colleagues (Chen et al., Reference Chen, Huang, Cheng, Lee, Chien and Lee2017). To our surprise, our results were the opposite to those reported by Hsiu-Hui Chen’s group, in which they proposed that the optimal interval time between TE biopsy and vitrification was >3 h. They suggested that prolonging culture time after biopsy could be beneficial for tight junction repair of trophoblast cells and could improve the effectiveness of vitrification freezing. However, this result should be interpreted with caution due to potential confounders such as the differences in blastocyst stage (including day 5 and day 6 blastocysts) and the number of blastocysts transferred (1.5–1.6 blastocyst per cycle). These confounders might have influenced the outcomes of the study.
To reduce the influence of potential confounding factors, the following cycles were excluded from our study: two blastocyst transfers, biopsy on thawed embryos, day 6 or day 7 blastocysts. Only cycles with single day 5 euploid blastocyst transfer were included in the study.
We first compared the survival rates in PGT-SR cycles across different biopsy-to-vitrification interval times. The results showed that the survival rate in the ≥2 h group was significantly lower than that in the <1 h group. It is generally believed that there is a negative correlation between blastocyst cavity volume and cryo-survival during blastocyst vitrification. Large blastocyst cavity volume is associated with a compromised survival rate. Removal of blastocoel fluid before vitrification can significantly improve blastocyst survival rates (Hiraoka et al., Reference Hiraoka, Hiraoka, Kinutani and Kinutani2004; Darwish and Magdi, Reference Darwish and Magdi2016; Levi-Setti et al., Reference Levi-Setti, Menduni, Smeraldi, Patrizio, Morenghi and Albani2016; Wang et al., Reference Wang, Feng, Zhang, Zhou, Shu, Lin, Chen and Wu2017). Blastocysts are routinely shrunken by artificial shrinkage before vitrification (Vanderzwalmen et al., Reference Vanderzwalmen, Debauche and Schoysman2002). Most blastocysts are at a shrinkage status of within 1 h after biopsy, as shown by Hsiu-Hui Chen and colleagues (Chen et al., Reference Chen, Huang, Cheng, Lee, Chien and Lee2017), which is beneficial to blastocyst vitrification. This shrinkage time might have contributed to the significantly higher survival rate found in the <1 h group compared with the ≥2 h group in our study.
The clinical outcomes were further compared. The results revealed that the prolongation of the biopsy-to-vitrification interval time was associated with increased miscarriage rate and compromised clinical outcomes, indicating that the developmental potential of blastocysts was impaired during the increased interval times. During the PGT procedure, the longer the interval times between TE biopsy and vitrification, the more the blastocysts will be re-expanded before being cryopreserved, which may be harmful to embryonic development. Paolo Emanuele Levi-Setti and co-workers (Levi-Setti et al., Reference Levi-Setti, Menduni, Smeraldi, Patrizio, Morenghi and Albani2016) reported that blastocyst shrinkage had no significant effects on survival rate. However, implantation, clinical pregnancy, and live birth rates were significantly enhanced after shrinkage. The authors suggested that cryopreservation might damage the ultrastructure of the blastocyst cells and further impair the development potential of blastocysts because of the large blastocyst cavity. Desai and colleagues (Desai et al., Reference Desai, Szeptycki, Scott, AbdelHafez and Goldfarb2008) showed that artificial shrinkage before vitrification reduced the number of dead blastocyst cells (shrunken blastocysts at 5% vs. unshrunken blastocysts at 13%). This might be related to the inadequate dehydration and slow cell recovery in the blastocyst cavity of the unshrunken blastocyst. According to research by Hiraoka et al. (Reference Hiraoka, Hiraoka, Kinutani and Kinutani2004), artificial shrinkage before freezing might increase the proportion of fast-developing blastocysts (≥50% increase in diameter after 2 h of culture). The authors suggested that the fast-developing rate was associated with increased implantation rates. Another report revealed that blastocoel cavity volume reduction before vitrification significantly increased KLF4 gene expression and the hatching rate of the blastocysts from the ZP compared with the vitrified group without artificial shrinkage (Pooyanfar et al., Reference Pooyanfar, Foroutan and Dashtizad2018). In general, the above results indicated that vitrification of blastocysts without shrinkage could affect embryonic developmental potential at a subtle level. Most blastocysts are at shrinkage status of within 1 h after biopsy (Chen et al., Reference Chen, Huang, Cheng, Lee, Chien and Lee2017). However, prolongation of the interval time increases the chance of blastocysts beginning to re-expand. The increased volume of fluid contained in the blastocoelic cavity theoretically poses the risk of cellular damage because of the reduced cryoprotectant penetration and increased ice crystal formation during vitrification. This type of cellular damage may be the reason for the better clinical outcomes observed in the <1 h group compared with the longer interval groups.
It is necessary to set a threshold for the interval time to ensure that the optimal clinical outcomes are achieved during routine procedures. Maggiulli et al. (Reference Maggiulli, Giancani, Cimadomo, Ubaldi and Rienzi2019) investigated the effects of different interval times. There were three groups of intervals investigated in their study: ≤30 min, 31–90 min, and >90 min. They found that the highest live birth rate was achieved in the ≤30 min group (47.9%) compared with the 31–90 min group (36.7%, P = 0.06) and the >90 min group (39.7%, P = 0.16). However, this result did not reach statistical significance. They set 30 min and 90 min as the early and late interval time thresholds between biopsy and vitrification. However, the authors also pointed out that a 31–90 min time interval represented a grey area that may or may not have an effect (Maggiulli et al., Reference Maggiulli, Giancani, Cimadomo, Ubaldi and Rienzi2019). The ESHRE Consortium recommended that blastocysts should be cryopreserved as soon as possible after biopsy (ESHRE PGT Consortium and SIG-Embryology Biopsy Working Group et al., Reference Kokkali, Coticchio, Bronet, Celebi, Cimadomo, Goossens, Liss, Nunes, Sfontouris, Vermeulen, Zakharova and De Rycke2020). However, similarly, this Consortium did not provide a clear recommendation regarding the late interval time threshold (ESHRE PGT Consortium and SIG-Embryology Biopsy Working Group et al., Reference Kokkali, Coticchio, Bronet, Celebi, Cimadomo, Goossens, Liss, Nunes, Sfontouris, Vermeulen, Zakharova and De Rycke2020). Based on the results from Hsiu-Hui Chen and colleagues (Chen et al., Reference Chen, Huang, Cheng, Lee, Chien and Lee2017), none of the blastocysts re-expanded within 1 h after TE biopsy (Chen et al., Reference Chen, Huang, Cheng, Lee, Chien and Lee2017). Blastocyst re-expansion usually begins after 1 h post-biopsy. We speculated that the late interval time threshold may be closer to 1 h. Our results confirmed this speculation. The time of 1 h after biopsy appears be the maximum interval time threshold for an optimal clinical outcome.
Unfortunately, the status of the blastocyst expansion was not recorded at vitrification in our study. The retrospective design and small sample size may have also influenced the outcomes. Further studies with larger sample sizes and randomized design are needed to confirm our findings.
In conclusion, the interval time between TE biopsy and vitrification exerts significant influences on the outcomes in PGT–FET cycles. Embryo cryo-survival and ongoing pregnancy rates were compromised with prolongation of the interval time. It is therefore recommended that blastocysts are vitrified within 1 h after biopsy.
Acknowledgements
The authors would like to thank the colleagues who helped with the study and data collection.
Financial support
This research was supported by the grants from the Research Project of the Chinese Medical Association (grant number: 17020440713) and the Chongqing Health Committee (grant number: 2020MSXM086).
Conflicts of interest
The authors have no conflict of interest in regard to this study.
Ethical standards
All patients signed the informed consent forms for all the procedures during PGT treatment. This study was approved by the Institutional Review Board of Chongqing Health Center for Women and Children.