Introduction
Deep-sea malacofaunal research in the Arabian Sea is infrequent although the fauna has been explored since the late 19th century. Several bivalve species have been described from the bathyal zone of Arabian Sea includes Amygdalum anoxicolum P. G. Oliver, Reference Oliver2001 from the northern Arabian Sea, Lucinoma gagei P. G. Oliver & Holmes, Reference Oliver and Holmes2006, Nucinella owenensis P. G. Oliver & Taylor, Reference Oliver and Taylor2012, Huxleyia habooba P. G. Oliver & Taylor, Reference Oliver and Taylor2012, Thyasira anassa P. G. Oliver, Reference Oliver2015, and Parathyasira bamberi P. G. Oliver, Reference Oliver2015 from the Oman margin, Leptaxinus indusarium P. G. Oliver & Levin, Reference Oliver and Levin2006 from off Pakistan, Ascetoaxinus ravichandrani Ravinesh et al., 2024 from off Southern India, etc. The family Mytilidae Rafinesque, 1815 represented by a total of 138 genera and the genus Amygdalum Megerle von Mühlfeld, 1811, comprising about 14 species that are known to have cosmopolitan distribution with a bathymetric range from the sublittoral to the abyssal plain (Oliver, Reference Oliver2001). The mytiloid species A. anoxicolum was first described by P. G. Oliver in Reference Oliver2001 from soft sediments within the oxygen minimum zone off the coast of Oman in the northern Arabian Sea. The present work is the first report of the species A. anoxicolum P. G. Oliver, Reference Oliver2001 from the summit of a seamount situated in the eastern Arabian Sea, also provides the first-ever DNA barcodes for the species.
Materials and methods
Study area
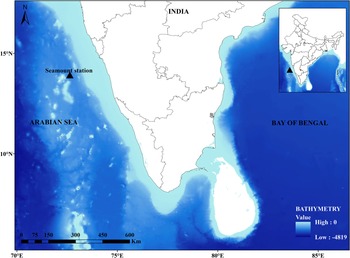
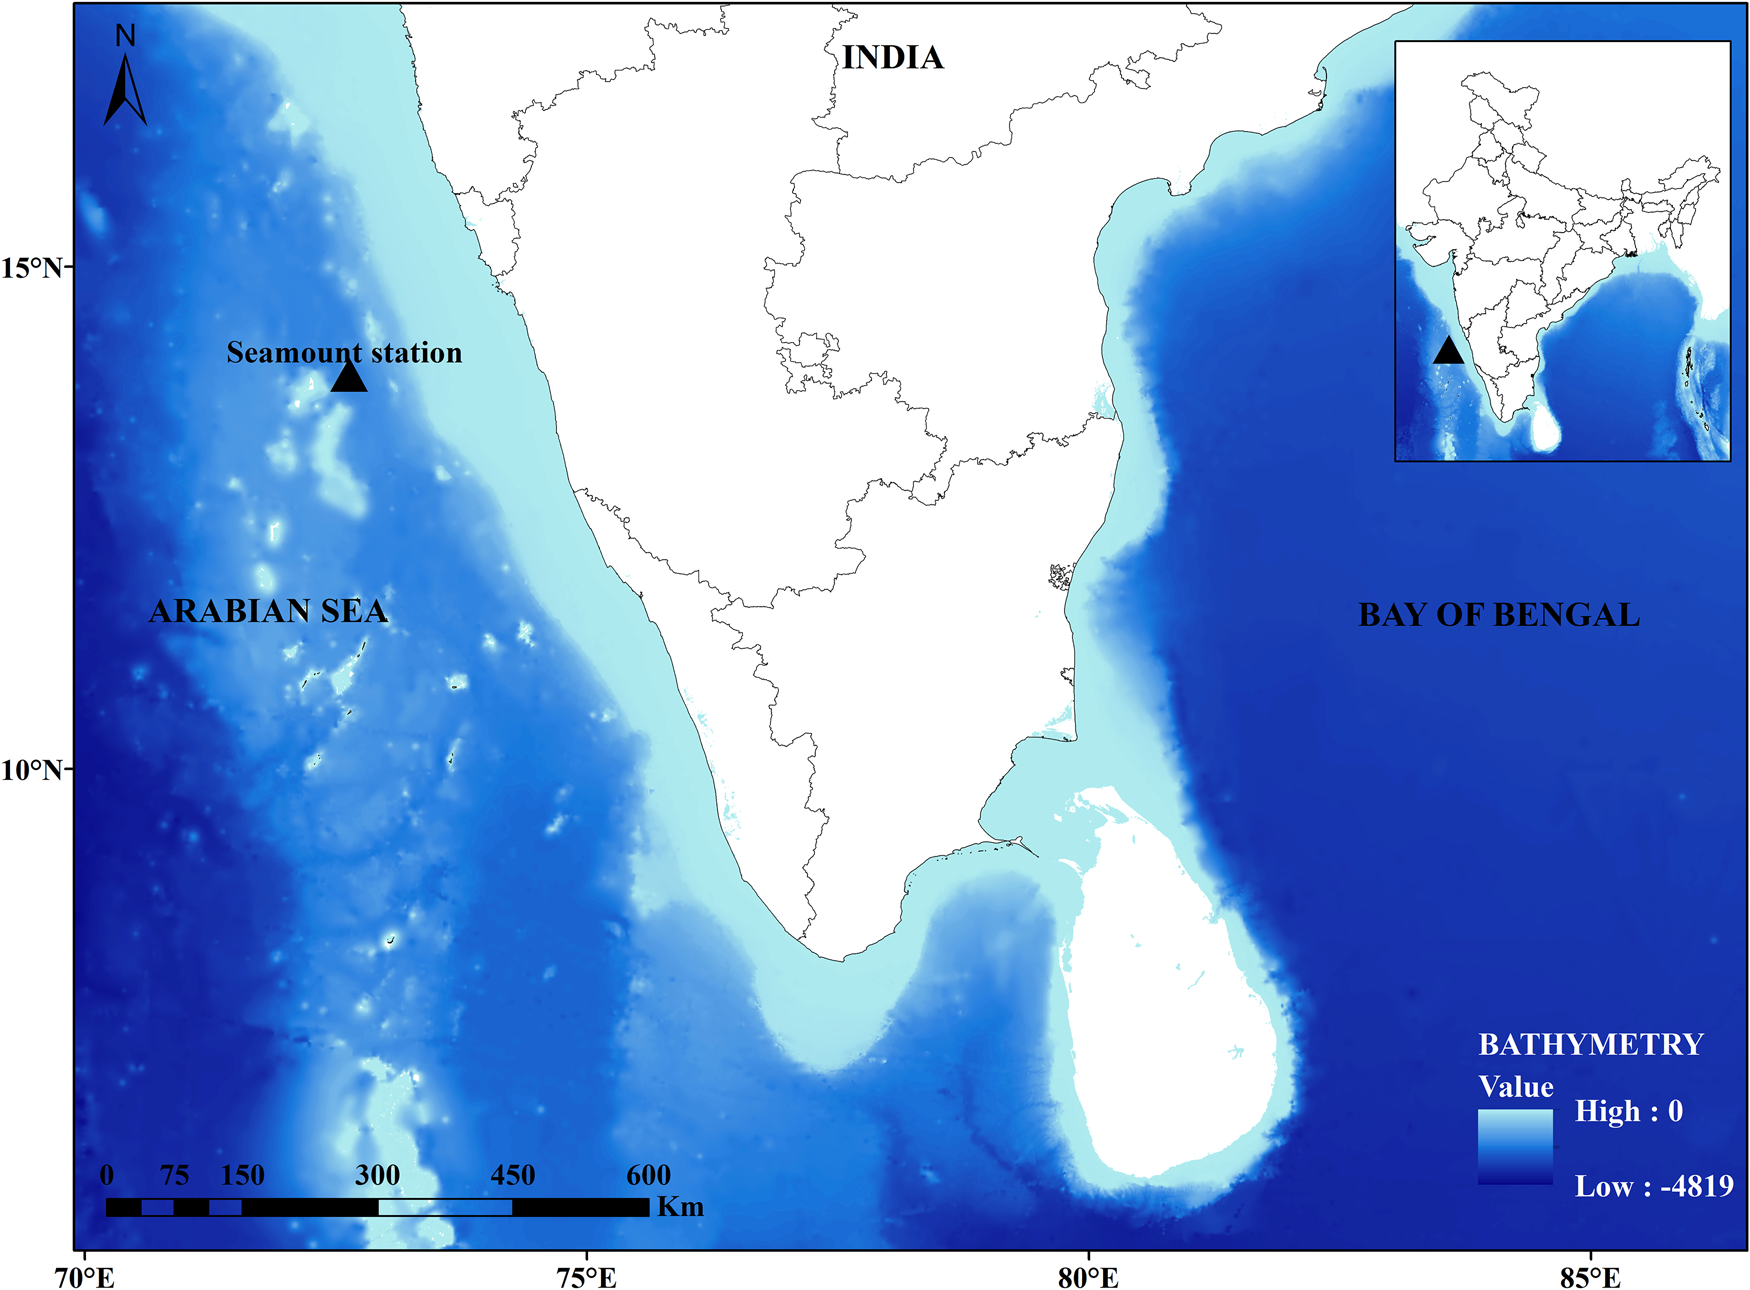
The Laccadive Plateau is the northernmost segment of the Chagos-Laccadive Ridge in the northern Indian Ocean, with the Lakshadweep atolls as the major above-water features. Several submarine bathymetric features, such as seamounts, guyots, hills, knolls, and so on in the Laccadive Plateau and surrounding areas (Bijesh et al., Reference Bijesh, John Kurian, Yatheesh, Tyagi and Twinkle2018). One of these, designated as seamount SM2 (coordinates 72.629°E, 13.943°N), rises 1540 m above the seafloor (1880 m basal depth); it has a summit depth of 340 m and a summit area of 15.11 km2 (Bijesh et al., Reference Bijesh, John Kurian, Yatheesh, Tyagi and Twinkle2018) (Figure 1). Specimen reported in this paper was collected from the summit of seamount SM2 (340 m depth) during cruise no. 148 of RV Sindhu Sankalp in November 2022, using a modified naturalist dredge, having a metal frame (100 × 30 cm2) and nylon mesh bag (1 cm). Species identification was carried out using standard taxonomic description by Oliver (Reference Oliver2001). The samples were preserved using 99% ethanol for molecular barcoding and deposited at the reference collection of the Indian Ocean Biological Centre, National Institute of Oceanography, Regional Centre–Kochi, India.
Geographic map of station location.
DNA extraction, polymerase chain reaction (PCR) amplification, and sequencing
The tissue inside the shell was dissected out for the extraction of DNA using the DNeasy Blood & Tissue Kit (Qiagen, Germany) following the protocol prescribed in the kit. In this study we used three DNA marker genes for the molecular characterization of the organism. They are cytochrome oxidase subunit I (COI) (Meyer et al., Reference Meyer, Geller and Paulay2005), 18S rRNA and H3 histone (Kartavtsev et al., Reference Kartavtsev, Sharina, Chichvarkhin, Chichvarkhina, Masalkova, Lutaenko and Oliveira2018). The nucleotide sequences of these genes were generated using PCRs using the following primers: COI gene: dgLCO (5′ GGTCAACAAATCATAAAGAYATYGG3′) and dgHCO (5′ TAAACTTCAGGGTGACCAAARAAYCA 3′), 18S rRNA: 1F (5′ TACCTGGTTGATCCTGCCAGTAG 3′) and 5R (5′ CTTGGCAAATGCTTTCGC 3′) and H3 histone gene: H3aF (5′ ATGGCTCGTACCAAGCAGACVGC 3′) and H3aR (5′ ATATCCTTRGGCATRATRGTGAC 3′). The PCR reaction mixture (25 μl) containing 1 μl of template DNA (50 ng μl−1), 1 μl of each forward and reverse primers, 12.5 μl of EmeraldAmp GT Master Mix (Takara Bio Inc., Japan) and Milli-Q water (9.5 μl) was exposed to the standard cycling conditions. The reaction conditions for COI gene consisted of initial denaturation at 94°C for 2 min, followed by 25 cycles of denaturation (94°C for 30 s), annealing (45°C for 30 s) and extension (72°C for 12 s). Then the final extension at 72°C for 7 min and infinity hold at 4°C. The reaction conditions for 18S rRNA and H3 histone gene consisted of initial denaturation at 94°С for 3 min; then 30 cycles of denaturation (94°С for 45 s), annealing (49°С for 90 s), extension (72°С for 120 s), and final extension at 72°С for 5 min. The amplified DNA fragments were then sequenced by the Sanger sequencing (18S rRNA and H3 histone) and Oxford Nanopore sequencing (COI gene) methods. The nucleotide sequences were deposited to the NCBI database.
Data analysis
The raw sequence data were analysed and quality trimmed in Sequencher 4.10.1 (Gene Codes Corporation, Ann Arbor, Michigan). BLASTN (Altschul et al., Reference Altschul, Madden, Schäffer, Zhang, Zhang, Miller and Lipman1997) search was performed for comparing the sequence similarity with the relative taxa of Amygdalum anoxicolum. Multiple sequence alignment was done using the CLUSTALW method (Thompson et al., Reference Thompson, Higgins and Gibson1994). A phylogenetic tree was constructed in MEGA11 (Tamura et al., Reference Tamura, Stecher and Kumar2021) using the maximum-likelihood method with the Tamura Kei nucleotide substitution model (Tamura and Nei, Reference Tamura and Nei1993) and bootstrapping value of 1000. Members from phylum Annelida were used as the outgroup to root the tree (Kocot et al., Reference Kocot, Cannon, Todt, Citarella, Kohn, Meyer, Santos, Schander, Moroz, Lieb and Halanych2011).
Result
Taxonomic account
Class BIVALVIA
Order MYTILIDA
Superfamily MYTILOIDEA Rafinesque, 1815
Family MYTILIDAE Rafinesque, 1815
Subfamily Mytilidae incertae sedis
Genus Amygdalum Megerle von Mühlfeld, 1811
Amygdalum anoxicolum P. G. Oliver, Reference Oliver2001
(Figure 2)
Material Examined
Eastern Arabian Sea-Seamount SM2, 13°55′36.0″N, 72°38′00.2″E, 350 m, 29.11.2022, naturalist dredge, 69 specimens.
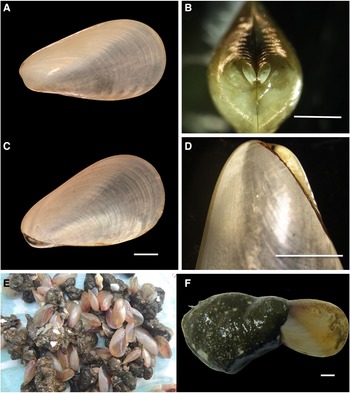
Amygdalum anoxicolum P. G. Oliver, Reference Oliver2001: (A) external view of shell; (B) internal view of the shell; (C) oblique view of the hinge region; (D) view of umbo; (E) live specimen collected on board during survey; and (F) full specimen with byssus nest. Scale bars: 5 mm.
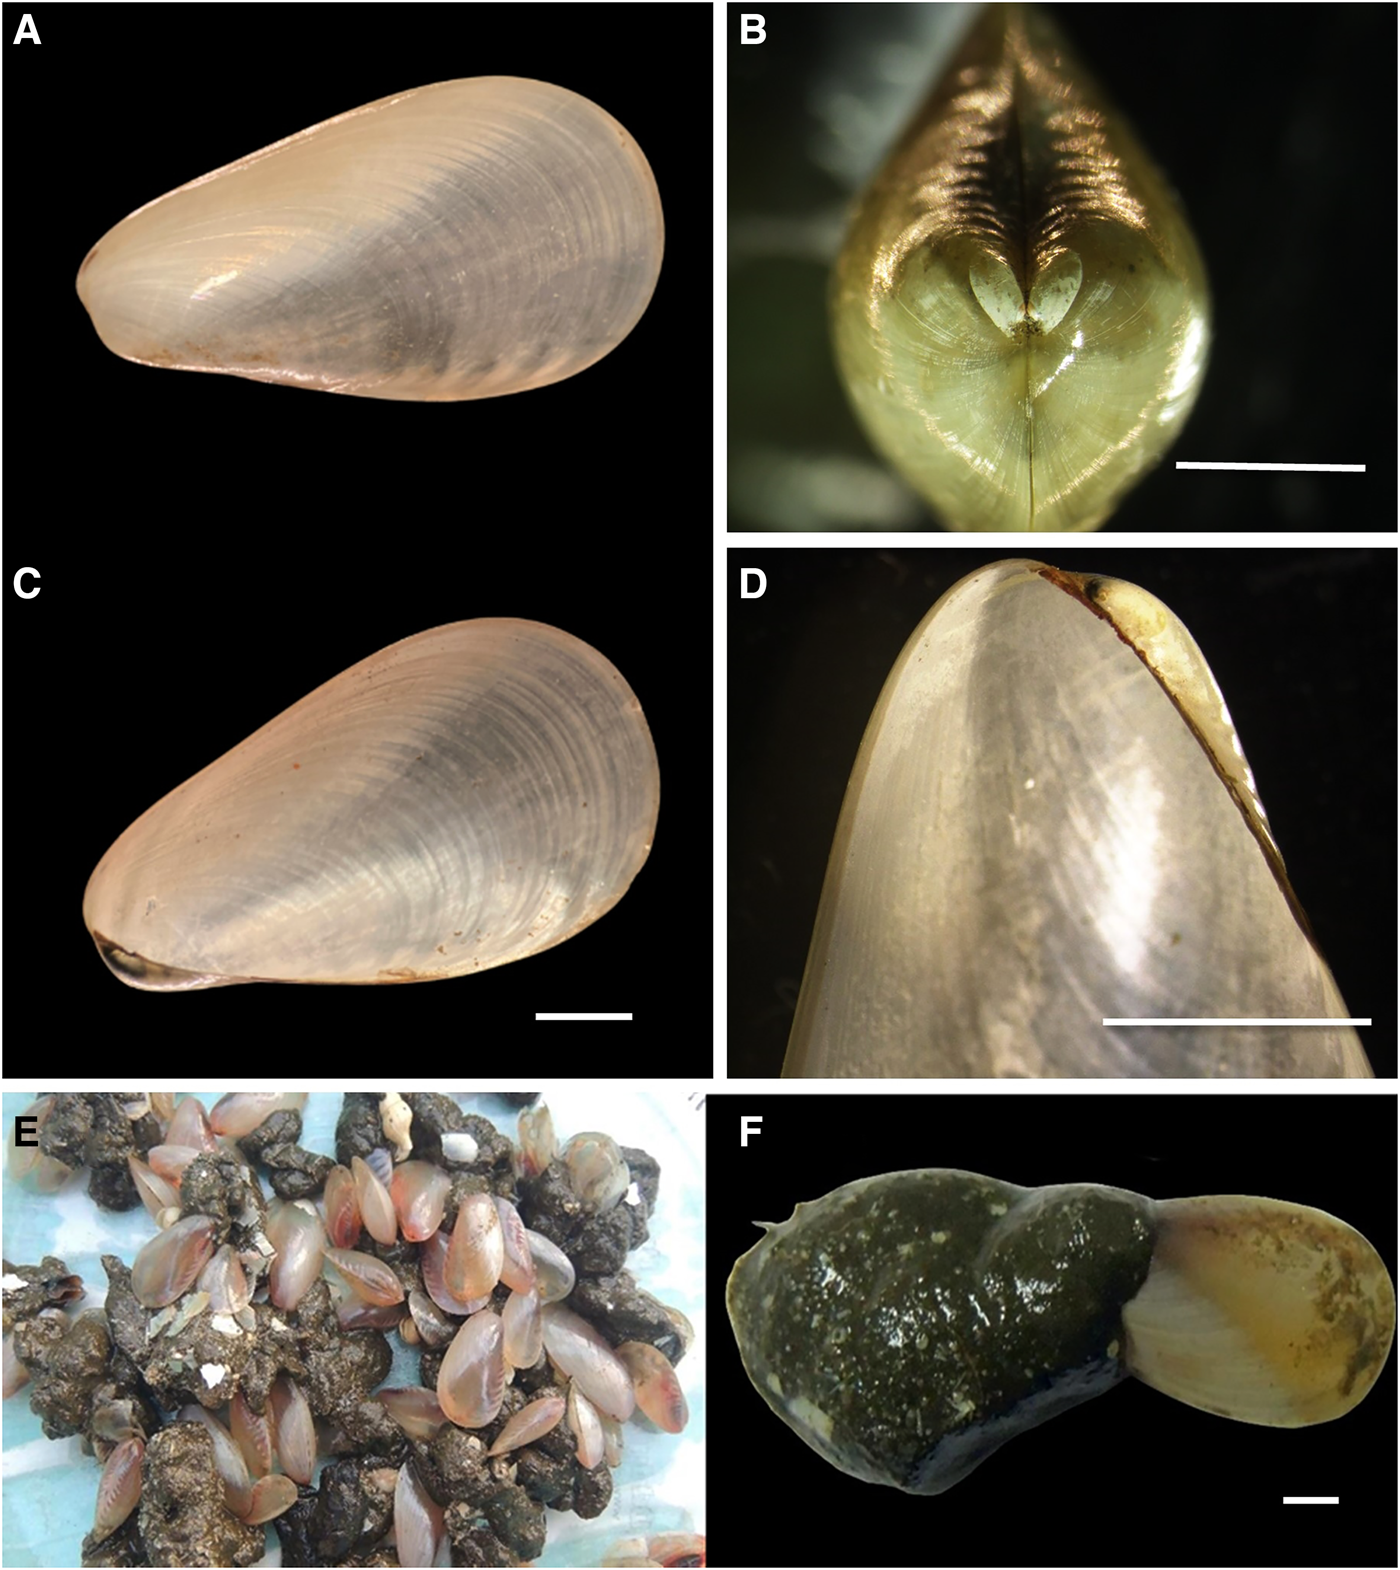
Live observations: Shell thin, translucent, outline modioliform but wedge-shaped and not much elongated. Periostracum weakly coloured, anterior ventral area opaque white, remainder pale grey with a series of darker bands along the dorsal margins. The specimen found with the byssus nest in a large bundle and attached ventrally, some individuals obtained as cocooned state. Body tissues are reddish pink in colour.
Measurements: Sample of 10. Range length 16.1–21 mm; length: height ratio 1.7, range 1.7–1.9 mm; length: tumidity ratio 2.63, range 2.57–2.83.
Shell description: Length 18 mm, thin, fragile, translucent, equivalve. Outline modioliform transversely ovoid and not elongate with a narrow almost acute anterior margin. The umbos slightly below the midline, the beaks prosogyrate located close to the anterior end, the posterior margin rounded, the ventral margin almost straight, dorsal margin straight behind the umbos but soon curving gently into the posterior margin. Hinge without teeth. The ligament is weak, occupying one-third of the dorsal margin behind the beaks. Muscle scars unclear. The colour pattern in the periostracum is opaque white below a line running diagonally through the umbo to the posterior-ventral margin, above this translucent area with a series of short opaque bars running obliquely from the dorsal margin and umbo region with a white opaque spot.
Molecular Taxonomy
Partial nucleotide sequences of the COI gene (560 bp), 18S rRNA (728 bp), and H3 histone gene (376 bp) were obtained after the quality trimming of the raw sequences without indels and stop codons. The BLASTN search of the nucleotide sequences resulted in similarity matches with Amygdalum politum (COI gene: <80% identity) and Amygdalum watsoni (18S rRNA: 99% identity and H3 histone: 98% identity). There were no sequence data available for any other Amygdalum species for further comparisons. Hence, the partial nucleotide sequences of the COI, 18S rRNA, and H3 histone genes of A. anoxicolum, were deposited to NCBI/GenBank as the first sequence deposition for the organism, with accession numbers PP856256, PQ333125, and PQ360899, respectively.
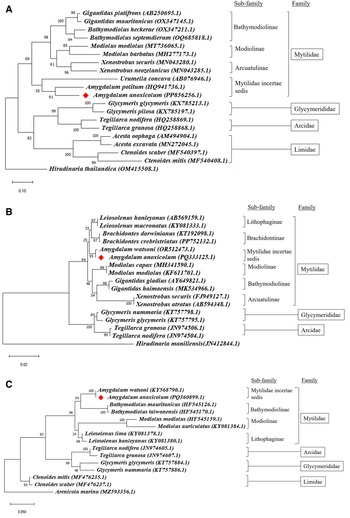
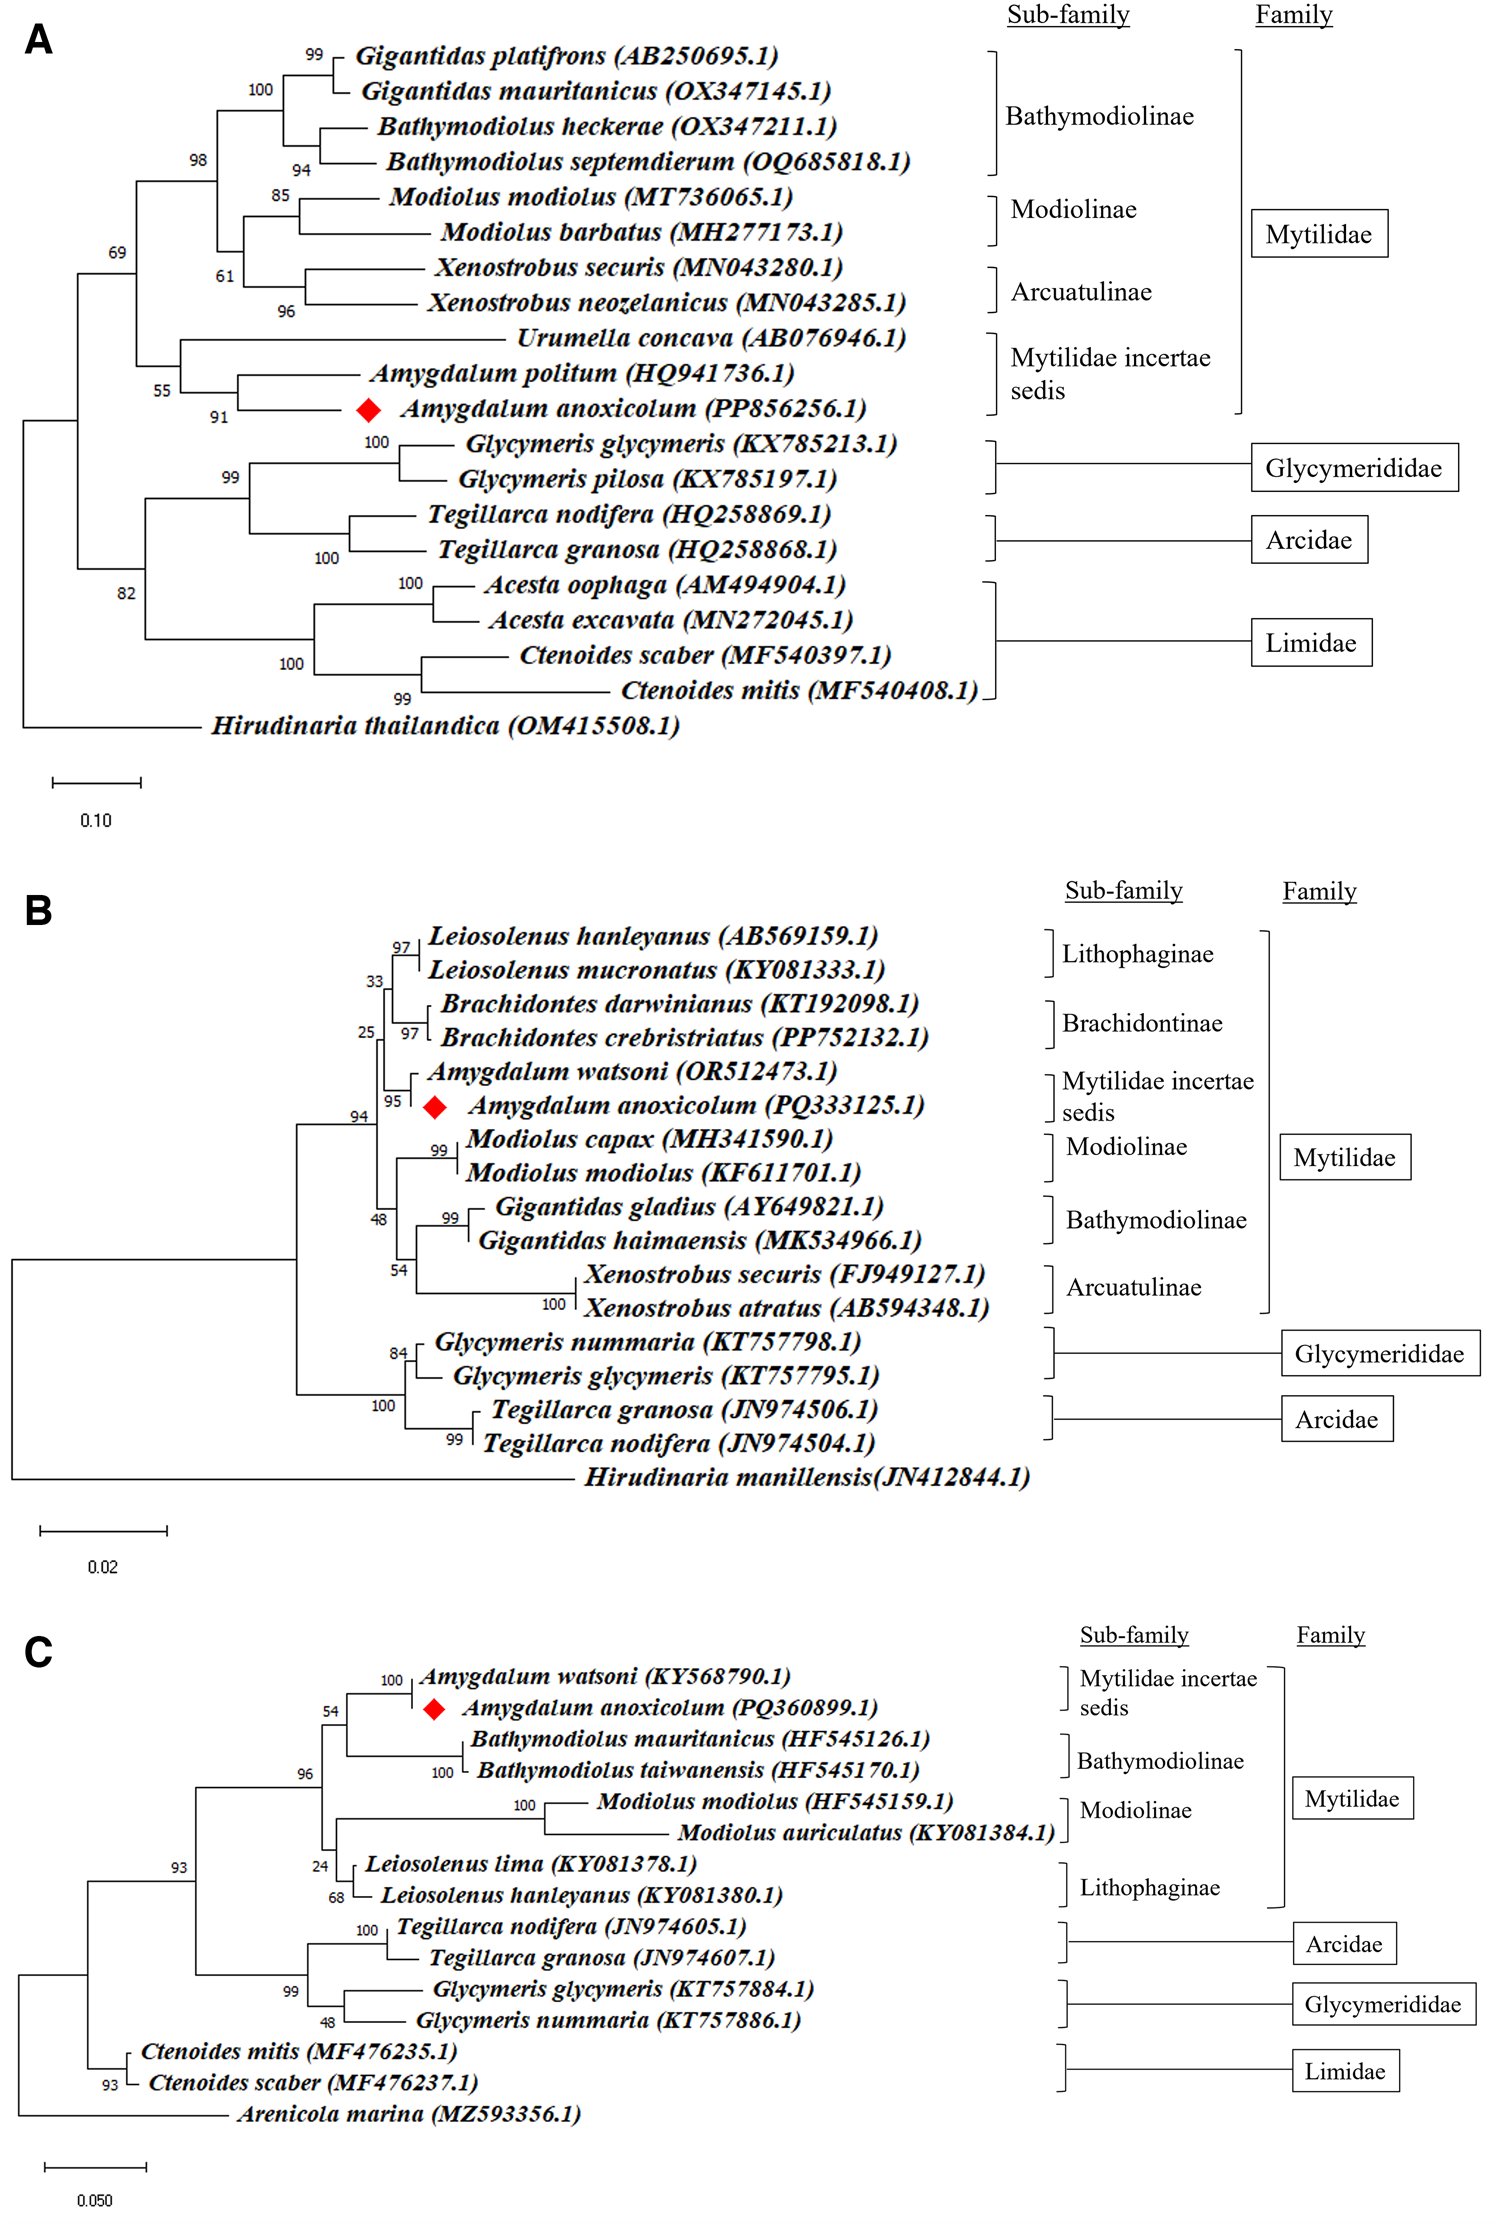
On the basis of multiple sequence alignment performed with different organisms belonging to family Mytilidae and other families such as Glycymerididae, Arcidae, and Limidae, the phylogenetic relationship of A. anoxicolum was visualized by constructing maximum-likelihood phylogenetic trees (Figure 3). The phylogenetic tree depicted a clear clustering of the incorporated gene sequences of the A. anoxicolum with A. politum (COI gene) (Figure 3A) and with A. watsoni (18S rRNA and H3 gene) (Figure 3B, C). The Amygdalum species formed a single clade with bootstrap support of 91% (COI), 95% (18S), and 100% (H3).
Maximum-likelihood tree constructed in MEGA11 for (A) COI gene; (B) 18S rRNA gene; and (C) H3 histone gene sequence data using Tamura–Kei nucleotide substitution model, with a bootstrap value of 1000.
Discussion and conclusion
In recent years considerable attention has been directed towards the biodiversity of bathymetric features such as seamounts, as they are postulated to harbour higher biodiversity influenced by regional oceanographic processes (de Forges et al., Reference de Forges, Koslow and Pooro2000). However, the summit of the seamount SM2, surveyed in this work was intercepted by an intense oxygen minimum zone where the concentration of oxygen below 0.5 ml l−1 that impacted the diversity of benthic faunal assemblage. During the survey of the benthic fauna, Amygdalum anoxicolum was the sole species identified from seamount SM2. This paper is the second to document A. anoxicolum in the Arabian Sea and the first to report its presence on a seamount in this region. Amygdalum anoxicolum is found to occur in high abundance within a depth range of 300–700 m in the Arabian Sea (Levin et al., Reference Levin, Gage, Martin and Lamont2000; Oliver, Reference Oliver2001; OBIS, 2024). The species was recovered from similar depths (350 m) on the summit of SM2 in the present study as well. The recorded dissolved oxygen from the summit of seamount SM2 was 0.07 ml l−1 (Kaliyath et al., Reference Kaliyath, Abdulaziz, Chekidhenkuzhiyil, Koovapurath Useph and Menon2024) which indicates hypoxic conditions. This organism has several adaptations to low-oxygen conditions, such as the presence of a thin shell and the evolution of respiratory pigments like haemoglobin, which have a high affinity for oxygen (Oliver, Reference Oliver2001). Its feeding structures indicate that it consumes unsorted food and expends minimal energy in gathering food from loose, biogenic sediment (Levin et al., Reference Levin, Gage, Martin and Lamont2000; Oliver, Reference Oliver2001; Levin, Reference Levin2003). The molecular phylogeny reveals a high level of intrageneric genetic similarity between A. anoxicolum and Amygdalum watsoni, with 99 and 98% sequence identity for the 18S rRNA and H3 histone genes, respectively. Despite this genetic similarity, these two organisms are morphologically distinct. Historical records describe A. watsoni as a larger organism, capable of reaching lengths of up to 65 mm, with a uniform amber-coloured periostracum. Additionally, literatures indicate that A. anoxicolum is unique among the species in this genus for possessing haemoglobin (Oliver, Reference Oliver2001). The present study resulted in the successful generation and deposition of first-ever nucleotide sequence data of A. anoxicolum, to the NCBI/GenBank database.
Data
The authors confirm that the data supporting the findings of this study are available within the article itself. The DNA sequences generated in the present study are deposited in the NCBI/GenBank database (accession nos. PP856256, PQ333125, and PQ360899).
Acknowledgements
The authors express their gratitude to the Director of the CSIR–National Institute of Oceanography (CSIR–NIO) in Goa, India, and the Scientist in Charge at the CSIR–NIO Regional Centre in Kochi, India, for their invaluable support. This research was funded by the Ministry of Earth Sciences, Government of India. We extend our thanks to Dr Graham P. Oliver for his guidance in confirming the identification. The support of the RV Sindhu Sankalp cruise team (Cruise No. 148) is also gratefully acknowledged. This is NIO contribution No. 7367
Author contributions
M. L. Vishnu: conceptualization, investigation, visualization, formal analysis, writing – original draft preparation. K. Devika Raj: conceptualization, visualization, analysis, and writing the manuscript. K. U. Abdul Jaleel: conceptualization, supervision, investigation, visualization, and manuscript editing. B. Anagha: formal analysis. A. Anas: supervision and project administration.
Financial support
This work was implemented with the financial support of the Ministry of Earth Sciences (MoES), Govt. of India (MoES/36/OOIS/Extra/81/2021, GAP3483).
Competing interests
None.