

Statistical surveys might be conceived as huge observation instruments, aimed at producing quantitative images of very large objects, such as the population of the United States as a whole, its rate of unemployment, or its agricultural production. But before any neat figures, charts, or apple pies can be produced, the practice of surveying implies a boots-in-the-mud initial step of going out in the field to grasp some local information. No surprise, those who conceive surveys tend to delegate this step to others, whom they call surveyors. Nowadays, surveyors are either subjected to a short training period before working in a call center, or in the case of more expensive surveys, sent to a series of pre-selected households to fill out questionnaires (Hyman Reference Hyman1954). In both cases, it is not that complicated a job, but statistical practice requires a series of minimal skills taught during training.
When the avalanche of surveys began in the nineteenth century (Hacking Reference Hacking1990), these requirements were not established and statisticians were happy to work with lay people and lay people with statisticians. In this paper I will ask how some of the main characteristics of contemporary interviewing were expressed through the New Deal. This strategy of historicization has the advantage of relativizing the rules of the survey, nowadays taken for granted, by describing two alternative models of surveying, both fairly common and important in the nineteenth century, which have not disappeared today but have become less visible because they lost a contest of legitimacy (Desrosières Reference Desrosières2008). I then argue that this conflict took place during the New Deal. In effect, it has been a period of important statistical professionalization, described in the literature in terms of academic and administrative institutionalization and methodological innovations (Duncan and Shelton Reference Duncan and Shelton1976; Ben-David Reference Ben-David1984; Anderson Reference Anderson1988; Stapleford Reference Stapleford2010a). What's more, a very large number of statistical surveys financed by the relief administration took place at the time. Roughly estimated, between 1933 and 1937 more than 2.5 million positions were funded for those on relief.Footnote 1 Thus, not only were universities and the government subjected to a statistical revolution, but a significant number of lay persons became statisticians (mainly surveyors and tabulators) for a time and thus participated in the overall statisticization of the U.S. and the standardization of the observer's role in statistical surveys.
Reporters
According to H. C. Taylor, the founder of the Bureau of Agricultural Economics (BAE), the first American annual statistical survey began in 1862 and bore on agriculture (Taylor and Taylor Reference Taylor and Taylor1952, 176) (the census is decennial and will be addressed later). It was used to estimate, every month of the growing season, the quantities of various crops (and later of livestock) that would be on sale after harvest. This information was crucial to fight against speculation and purify markets, because once the amount of commodity on sale was made public, it was much harder for the buyers to speculate on low prices.
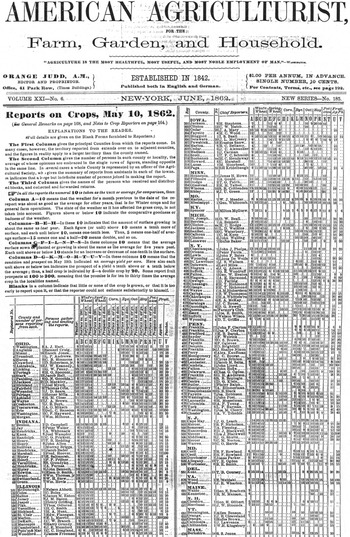
The very first survey was launched not by the federal government but by a journalist, Mr. Orange Judd, the managing editor of a magazine, The American Agriculturist (see fig. 1). Under the heading, “An Important Enterprise – The Co-operation of All Our Readers Asked,” he proposed to “let the readers of the Agriculturist in every town counsel together, and select some man who may be relied upon for good judgment and general ability to estimate [the condition] with some degree of accuracy in regard to the leading crops, wheat, corn, etc.” (Judd Reference Judd1862, 72). Thus, it was an initiative of co-operating farmers who chose, among themselves, some representatives to report information on their neighborhoods, in order to fight the menace of speculation.
In June 1862, Judd published his first crop report. It was organized by state and county, under which the number of reporters was listed (most of the time it was less than 10; figures range from missing or 1 to 30). The individual name of the “Person gathering and sending the reports” or, as stated on the second column, of the “Chief Reporter,” was also listed.

The following year, 1863, the U.S. Department of Agriculture (USDA) was created. The USDA took responsibility for producing these figures (Ebling Reference Ebling1939). It seems, moreover, that the Department retained Judd's methods, but sources do not agree on which representatives were questioned. According to one historian of agricultural statistics, it was members of Congress who designated possible reporters among the local representatives (Vogel Reference Vogel1995), whereas, according to the memoirs of a former practitioner, “monthly questionnaires sent to township supervisors provided the basic information for the published state reports. There were about 1,200 townships each having a supervisor who was elected by popular vote annually in April” (Church Reference Church1944). It is not important here which of these two sources is right. In fact, they may both be right, for the initial surveys had not been standardized. What is important is that when the government took over the publication of the figures, it also believed that the best sources of information were elected representatives.Footnote 2 The statistical division of the BAE (which we will call simply “the Division” in this text) called these interlocutors “voluntary crop reporters,” because they were agricultural information volunteers (and we will use the shorter term “reporters” hereafter). The first statistics thus borrowed their mode of selection from the political sphere – more precisely the democratic sphere: the good informer in statistics was a good representative in the political sense.Footnote 3
Reporters produced information about the state of agriculture in their entire neighborhoods. “Their figures were based on their personal knowledge and investigation” (RG 83, Entry 74: Advisory Committee on Grain Crop Reports, “Grain crop reports,” unpublished article without mention of author or date) and had to “encompass their whole neighborhood and not just their own crops, for their individual yield depended on their ability to farm well or badly” (Taylor and Taylor Reference Taylor and Taylor1952, 177). In other words, each reporter had to conduct a personal investigation, observe agriculture in the neighborhood, avoid being influenced by the reporter's own personal results (which could differ from those of others), and, only after this work had been accomplished, send a series of figures to the Division on the growth condition of the crops.
This cognitive elitism was necessarily accompanied by moral elitism. In fact, once the agency entrusted the surveys to its new recruits, it also assumed that they would not give the agency misinformation. Hence it described its Reporters as “intelligent and reliable,” and dispensed with the misleading answers “of ignoramuses and those who were worried that truth would lead to higher taxes.” Nevertheless, at the beginning of the twentieth century, a Board of Crop Estimates was established in the department to account for a systematic bias that had been identified, generated by the fact that farmers had an interest in underestimating the production observed (to bring higher prices). Thus it can be said that the reporters were as much investigators as investigated. Extremely active, they inspected the land with all their cognitive and moral faculties to translate it into figures. The reporters “knew” for others, and they were “known for their intelligence and their discernment” (Taylor and Taylor Reference Taylor and Taylor1952, 186).
In this situation, the central bureaucracy presented itself not as the place of expertise, but, on the contrary, as a mere “clearing house” of the knowledge of the reporters in the field. “In a sense the Bureau of Crop Estimates is a form of farmers’ cooperation, wherein each farm crop reporter reports about his locality and in return receives information about the entire country, the Bureau merely acting as a clearing house for such cooperative exchange,” noted the head of this bureau (RG 83, W F Callandar, “Organization and Development of Grain Crop Reporting, and Method of Estimating Acreage,” 36/21/02 entry 74, 1924).
Being a clearing house was not a passive job, though. On the contrary, it demanded lots of activity. First, the agency had to devise questions and process questionnaires. On the faith of a series of nearly anthropological studies, which it claimed to have conducted on people in general, it had come to the conclusion that it was difficult for any person to estimate absolute values, whereas it was easier to estimate percentages (Becker Reference Becker1928). Therefore, the questions were worded in terms of “percentage of acres planted compared to last year” and of “percentage of the normal condition of growth,” a proxy for yield per acre. Second, the Division maintained lists of correspondents. With the objective of getting better results, it expanded the group of reporters to include people who were not necessarily elected representatives, but who nevertheless were volunteers, driven by the spirit of public service.Footnote 4 These people were listed in Washington, D.C., and each time a survey was initiated, the Division sent a questionnaire to each farmer on the list – always the same ones – and asked them to complete and send back their responses within a given time.
As they were a rare commodity, the Division strove to turn reporters into loyal allies and tried to forge a lasting link with them. It used to send them, for example, Crops and Markets, a weekly in which the survey results were published. It also sent them guidelines for filling out the questionnaires and for using the published figures, and even Christmas greetings at the end of each year! In short, the Division made efforts to remain in close and enduring contact with its sympathetic interlocutors (RG 83, Entry 85: “Schedules”).Footnote 5
Finally, even though recruitment was never easy – “Making long lists of addresses was quite difficult and progress slow” (Church Reference Church1944, 9) – the Division tried to have one reporter per township: “The list [of reporters] contained mainly farmers, the aim being that each township would be represented by at least one reporter” (ibid., 7). This objective was more or less achieved. In 1926, for example, the list contained no less than 40,000 names, which was much greater than the number of rural townships (USDA 1933, 4). The selection mechanism was thus to find at least one voluntary and impartial representative for each geographical subdivision, which when combined formed the totality.
This method of using reporters was implemented not only in the field of agriculture. Reporters were also called for in social surveys (Bateman Reference Bateman2001); another example is Carol D. Wright's founding of the federal Bureau of Labor Statistics (BLS), modeled after the Massachusetts bureau. When he launched major statistical surveys, particularly on unemployment, he began by asking local “intelligent officials” (for example, members of town councils or philanthropic associations who already knew the local situation well) to send him their own counts of the unemployed in their localities. As in agriculture, he simply tapped the personal knowledge of these town council members and other dignitaries who could, for example, distinguish easily between genuinely unemployed individuals and regular beggars and vagabonds, or between under-employed and genuinely unemployed individuals (Topalov Reference Topalov1994).
This being said, between 1910 and 1920 reporters in the USDA and BLS slowly disappeared. In the Department of Agriculture, in 1914, a network of “trained field agents,” or state statisticians, one in each state or group of smaller states, were hired and paid by the Department. Their task was to inspect fields in their states and build an intimate knowledge about local agriculture, so that they could ascertain or correct the answers of the reporters (Taylor and Taylor Reference Taylor and Taylor1952, 236). Then, in 1921, an important source of error in the estimates was acknowledged. The reporters’ method, now called the “judgment inquiry,” was replaced with an “individual-type” inquiry in which farmers no longer had to inspect and synthesize information about their whole neighborhoods, but only provide information about their own individual farms, as in today's surveys (Didier Reference Didier2002). A similar shift took place in the BLS when federal statisticians replaced the earlier informants – who could be anyone as long as they were closely connected to and knew about the world of work – with trade union leaders who sent counts of the unemployed in only their own unions (Topalov Reference Topalov1994, 276). Lay observers charged with undertaking inquiries and syntheses were slowly replaced by respondents about only their own cases.
These reporters correspond well to the “public officers” described by John Dewey at the end of the period (Dewey [Reference Dewey1927] 1991). According to him, when people suffer from a problem (farmers from speculation; workers from unemployment), they begin to organize to solve this problem. They designate some individuals, whom Dewey calls “officers,” to act and talk on their behalf. Here, these officers are nothing other than statistical reporters. The institutionalization of statistical officers is a process that begins in the field, where the very first of them are members of the group they count, participate in the society they enumerate, and are knowledgeable about the problem they face more than about statistics. But slowly, for the sake of precision, the center – here the federal government – takes away from reporters the responsibility of the inquiry and synthesis and calls upon them to know only about their own personal situations.
Nevertheless, before the Great Depression, the reporter was not the only statistical fact gatherer. It came with another one, quite different but also very famous at the time because of its linkage to the decennial census. We can call this second model the enumerator.
Census Enumerators
The other model of statistical surveyor can be epitomized with the census. In 1790, the year the first census was held in the United States, a network capable of covering the entire territory – even if it was then much smaller than it is today – had to be identified in order to do an exhaustive count of the “noses” (according to the expression used at that time) and to centralize the data in Washington, D.C. The task had first been assigned to the federal marshals, an administratively and geographically well-established network that was responsible for hiring deputies locally to conduct the surveys and transmitting the results to Washington. The attributes that deputies were supposed to have were apparently not specified, but it seems that the marshals retained three principal recruitment criteria (Falkner Reference Falkner1898; Scott Reference Scott1968; Anderson Reference Anderson1988).
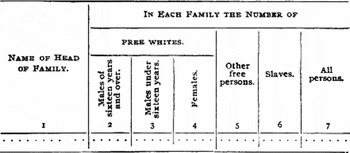
First, like the reporters, they had to be capable of reading the questionnaire, which was quite simple during the first census. Second, they had to be able to visit each and every farm: “The assistants were required to make the returns by a personal visit to each dwelling-house,” without faking the results (Falkner Reference Falkner1898, 36).Footnote 6 Third, unlike the reporters, the selection of enumerators apparently involved political patronage: the bureaucracy used the census in order to provide temporary employment to those who had already proven their loyalty to it (Anderson Reference Anderson1988, 33). Patronage was a way to maintain and improve the subordinate relationship of enumerators to the government (see fig. 2).
The very first census questionnaire (Falkner Reference Falkner1898, 37).

As for the reliability of the census, the results were initially reported locally: “the assistants were required to prepare two copies, one of which was to be posted for the inspection of the public” (Falkner Reference Falkner1898, 37). Thus, at the beginning, it was the public itself that verified the figures concerning it. But in the preparation of the 1880 census, many things changed and the marshals were relieved of this task, for the districts had become too unequal in terms of population and therefore in the distribution of workload. Instead, the federal officer in charge of the census planned to re-organize his network by appointing local supervisors and endorsing the appointment of the census agents that the latter recruited. This practice had the surprising effect of raising the standard of the interviewers, which had become necessary as the questionnaires had become more and more complex with each census. One unexpected consequence of this evolution was the feminization of recruitment: “[The enumerators] were chosen largely among schoolteachers, town clerks, and others familiar with record keeping, and – for the first time in history – they included at least 200 women [in 1880]” (Scott Reference Scott1968, 33).
It should, however, be pointed out that this new organization did not put an end to patronage; quite the opposite. In 1937, which was more than fifty years later, during a heated debate on conducting an unemployment census earlier, without waiting for 1940, Stuart Rice, vice-president of the Census Bureau, again alluded to a recurring suspicion: “the administration wants a census because it would provide more patronage” (RG 51, e144a, box e44, “Why not have an unemployment census?” published in 1937 by the New York Times in the letters to the editor). Enumeration and graft were still associated in the public mind at this time.
The federal census was a rare event, since it took place only every ten years. But its importance and fame made it the model of a whole range of other surveys. Many other networks besides that of the marshals were used to gather data. For example, from 1924 on, the Department of Agriculture itself used post office mail carriers to launch a survey on livestock (Didier Reference Didier2002). Two famous professors of sociology at the University of Chicago, William F. Ogburn and Harold Gosnell, who did huge quantitative studies in political science on Chicago, assigned work on questionnaires to their students, who, incidentally, had to slog their guts out, for they were few and had a gigantic number of questionnaires to process – nearly 6,000 in the case of Gosnell's study (Converse Reference Converse1987). A study undertaken in 1930 by the Federal Reserve Bank of Philadelphia to enumerate the number of unemployed in the city was done in collaboration with the janitors of the city's schools, who were asked to collect information on their respective blocks (Bureau of Labor Statistics 1930). The trained agricultural field agents and the union leaders described above are other examples of such networks.Footnote 7
This model of statistical enumerators is top-down. It transforms any governmental organization that is well dispersed over a whole territory and hierarchically structured, into a network of enumerators, or, when possible, establishes a dedicated network of people who are knowledgeable in statistics. The organization or network receives orders from the central government, which expresses an interest in investigating any question it wants. And the agency might either canvass territories themselves, or, when it is too large, hire local lay persons whom they cast in a hierarchical relation. The impetus comes from the central government, and the key variables are hierarchy and geographical division.
The Relief Statistical Projects
Now that I have sketched these two models of statistical surveyors, which were both well established at the beginning of the twentieth century, we can turn to the relief surveys launched during the New Deal in order to see how original they were. When Franklin D. Roosevelt came into power in 1933, one of his first actions was to establish relief agencies. The Federal Emergency Relief Administration (FERA) was the first, soon to be complemented – in the winter of 1933–1934 – by the Civil Works Administration (CWA), which was itself later replaced by the Works Progress Administration (WPA). Both of the last two agencies were dedicated specifically to providing government-paid work to the unemployed, whereas FERA certainly did occasionally provide relief work but chiefly distributed relief in cash or coupons. These institutions were all headed by Harry Hopkins, a native of Iowa, who had begun to work for Roosevelt when the latter was governor of New York.
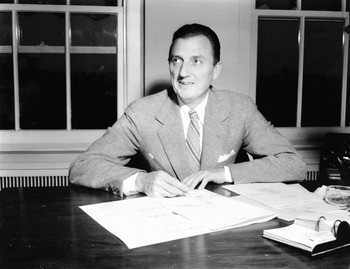
One of the main problems caused by these relief programs was that social workers were traditionally accustomed to doing simple case studies, studying the budgets of families and looking for weaknesses to correct, rather than providing them with actual work. So Hopkins needed a good deal of imagination to design numerous new and useful projects in a state of emergency. It appears that he relied on the many “corporate liberals” who entered the CWA. They were people with corporate backgrounds but who were available for the government because of the Depression. As they entered the agency, they brought with them a planning spirit, in Taylor's sense (Alchon Reference Alchon1985), which meant the habit of auditing the organization, the desire to unify accounting practices and to establish security rules at work (Schwartz Reference Schwartz1984). As an example of one of these “corporate liberals,” consider Corrington Gill (1898–1946) (see fig. 3), an independent journalist soon hired at FERA by Hopkins for his statistical abilities (Myers Reference Myers1946). When the CWA was established, he was responsible for creating its Research and Statistics Division; he named Emerson Ross head of economical analysis and Paul Webbink head of the Statistical Service (Ross Reference Ross1934).
Corrington Gill around 1940, no author, FSA-OWI collection.

These corporate liberals planned plenty of projects. Gill writes: “Activities included the construction, improvement, and repair of old schools, hospitals, libraries and other public buildings; streets, roads and highways; water supply plants, sewers, airports, etc. Parks, forests, community golf courses, beaches, and swimming pools were established or improved with CWA labor, and pest control and sanitation projects were also undertaken” (Gill Reference Gill1939, 166). This was fine, but it appeared quickly that they were mainly oriented towards blue-collar workers, whereas white-collar workers needed as much help as their counterparts.
To specifically help white-collar workers, “[Hopkins] frantically made the rounds of all government agencies and solicited ideas for projects” (Schwartz Reference Schwartz1984, 134). And what came out of the agencies was a grand, loud, clear call for statistics. All they wanted was to know more and understand better the populations they were trying to help. Let's mention en passant that state, city, and local agencies joined their voices to ask for such statistical research as well, and that in fact they were the background of these surveys. As Stephan noted:
The background for these projects may be traced to the first two or three years of the depression when private emergency associations and municipal relief organizations carried the load of unemployment relief. In New York, Philadelphia, Chicago and many other cities, “made work” was provided as a form of relief preferable to a simple dole or direct relief. In connection with these work programs a number of statistical and research studies were undertaken. (Stephan Reference Stephan1935, 486)
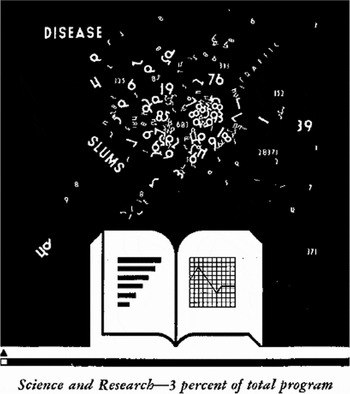
But the federal government developed them at a grand scale and, from 1933 on, “by far, the most significant studies were those carried out by the various agencies of the federal government, financed by Civil Works Grants and supervised by the federal civil works administration and the central statistical board” (Ross Reference Ross1934, 293). The need to know more about the “human erosion” of America was enormous (Lang and Taylor Reference Lang and Taylor1939), and unemployed white-collar workers were available to answer this need (see fig. 4).
Logo symbol of the relief science and research projects, of which statistical surveys were part. One can see how scrambled up figures already exist out there, and the WPA simply collects them and makes them clear and organized in books (USWPA 1938, 65).

The bureaucratic organization was that the various bureaus applied to see their projects funded. Then, an agency created only months before, the Central Statistical Board, consisting only of trained statisticians, was given the responsibility of checking their quality, preventing duplication, and scientifically advising the project heads (Central Statistical Board 1933).Footnote 8 If accepted by the Board, the relief agency would take on the project and pay the wages. A civil servant belonging to the applying bureau headed every single project under this organization.
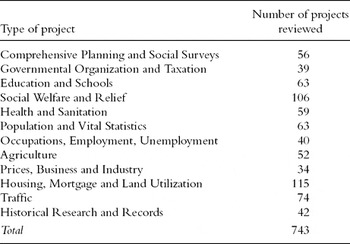
Frederick F. Stephan, who had just finished his Ph.D. in statistics at the University of Chicago, had been hired as the “coordinator of research” of the CWA, which meant that he had to make sure very quickly that the statistical projects were suitable. He published a summary of all the first 743 projects that had been accepted (see Table 1). Stephan calculated that “[in the winter 1933–1934] more than $10,000,000 [sic!] was expanded for special statistical studies conducted by the federal departments and agencies alone” (Stephan Reference Stephan1935, 486). Surveys were supposed to provide data quickly. Now, how did the lay persons take part in this project? And how were they captured by statistics?
Statistical Projects accepted by the CWA as of December 1933 (Stephan Reference Stephan1935, 485).

Characteristics of the Relief Surveyors
The articulation of relief with statistical projects expressed a series of new characteristics of the surveyors that were different from those of the previous models.Footnote 9 There were two main novelties appearing at this time: first, a new way to select them, and second, a new way to perform the work. I will present them in this order.
To help us describe this evolution, we will concentrate on the example of one special project, because it had paramount importance to establish the theory of random sampling that was at the very beginning of its governmental use at this time. This specific project, placed under the responsibility of the Bureau of Labor Statistics, and whose budget reached $70,000, was called the Trial Census of Unemployment (TCU). It consisted on the one hand in taking a census dedicated to counting the unemployed of three cities (Bridgeport, Connecticut; Lancaster, Pennsylvania; and Springfield, Ohio), and on the other hand in finding in each of these three cities all the available lists of individuals compatible with a random selection, drawing from these lists a series of random samples of people, and finally comparing the results obtained on the different samples to the ones obtained on the census. It was an experiment dedicated to seeing how random sampling could become a means to finally measure unemployment. Duncan and Shelton, two historians of federal statistics have argued that the TCU “was apparently the first significant attempt to study the methods by which the theory of sampling could be used under the practical conditions faced in Federal economics and social statistics” (Duncan and Shelton Reference Duncan and Shelton1976, 322).
A New Way of Selecting the Surveyors
As we have seen, the way the surveyor got involved in the statistical project was different in the two models. If it was voluntary and benevolent for the reporters, a hiring procedure was apparently mixed with some patronage for the enumerators. How was recruitment organized on relief projects? We will see first that candidates had to prove their need for work. But need alone was not sufficient: second, a series of examinations was quickly established to verify the abilities of the candidates.
First, as employees would be paid with relief money, it was necessary to make sure that only needy persons would be employed on CWA projects. It was therefore decided to rely on the rolls of FERA or of the employment organizations. On the TCU, for example, the city supervisors had to hire the workforce locally. They received lists of applicants provided by the state relief agencies. In Springfield, for example, a list of candidates was “assigned by the Springfield reemployment service” to the supervisor (RG51, e146a box 5, memo, January 16, 1934, from Persons to Lubin).
But it appeared quickly that this condition sometimes did not apply to white-collar workers because they had the characteristic of having an “aversion toward applying for aid” (Schwartz Reference Schwartz1984) and thus many did not get listed. Hence, “hiring procedures [which] would have to ensure applicants’ qualifications, meet the relief requirement of need, and yet somehow appeal to this ‘psychologically sensitive’ class” could replace the specific enlistment (ibid., 132).Footnote 10 In that spirit, “Hopkins ordered only a minimum of individual investigation and follow-up into the homes” and sometimes asked professional organizations to designate those of their members who were most in need (ibid., 139). Among others, the American Statistical Association was consulted. This is how, as far as white-collar workers were concerned, professional associations could cooperate with relief organizations in the role of designating their members who would have the right to get a job.
The aversion of white-collar workers toward applying for help was not the only specific characteristic that they presented to the agency. Another one, noticed very early on by Eleanor Roosevelt herself, was that many among them were young girls who systematically experienced difficulties obtaining positions simply because it was presupposed by the agency that each had a man somewhere (a husband, father, a brother, etc.) to support her. Arguing that this was not true, the First Lady convinced Hopkins to establish a “Women's Division” inside the CWA dedicated especially to helping women. Hopkins appointed Ellen S. Woodward – daughter of a former Mississippi Senator, a young widow, and a very active social worker – as head of this Division. In addition to plenty of “feminine” jobs such as sewing, she made sure that many statistical positions were reserved for female workers:
White collars, professional, and unskilled women all found jobs in statistical programs. Although Washington ordered that at least two-thirds of the employees on such projects be women, the order had little effect on supervisory positions, which generally went to men. Girls usually went to work as canvassers or in the office staff. (Ibid., 178)
And indeed, this order had some effects. In a project involving a census of the unemployed in Pennsylvania, 2,200 women were hired (ibid.). Women were also hired for the TCU. None of them were supervisors, but they were 39 per cent of the 87 enumerators of Bridgeport and Springfield on January 22 (RG51, e146a box 5, memorandum, January 22, 1934, Persons to Lubin).
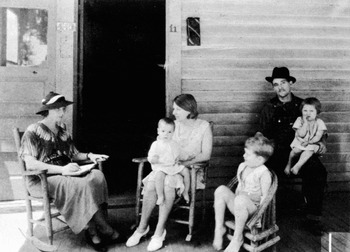
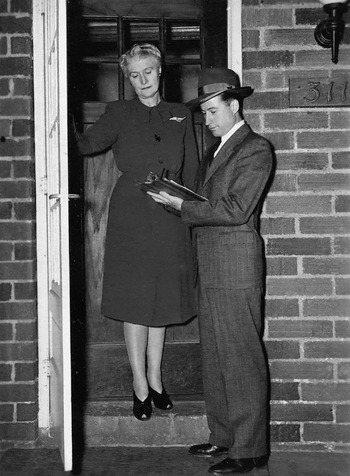
Finally, as a third example, in a photographic book published at the end of 1934 to celebrate the CWA, there is a picture of the survey in which the enumerator is a woman (Alsberg Reference Alsberg1934, 119). This picture is interesting in at least two ways (see fig. 5). The first is the clothing difference between the enumerator and the “destitute family.” The former is very classy, wears a watch on her wrist, and holds a notepad and pen, which make her look much richer than the latter, even though they all are on relief. From this visual clue, we can infer that the interviewing situation established a formal asymmetry which was important in saving white-collar workers’ pride. Second, the interview takes place on the porch of the family, which means inside or nearly inside their house, in the intimacy of the family; as traditionally intimacy is related to female gender, the fact that the interviewer is a woman seems to ease the entrance of an outsider into the family home. Not only were women in need of work, but femininity had decisive advantages in the collection of data.
A CWA worker interviews a destitute family (Alsberg Reference Alsberg1934, 119).

Finally, the hiring process tended to identify the need of individuals, and the difficulty resided in the fact that such need was hidden because of shame, or patriarchy. To express need, the agency used lists of registered unemployed, a regulation favoring women, and sort of a way for the bureaucracy to act with tact. But necessity was not the only criterion; the agencies also wanted to produce reliable figures. How was this requirement met?
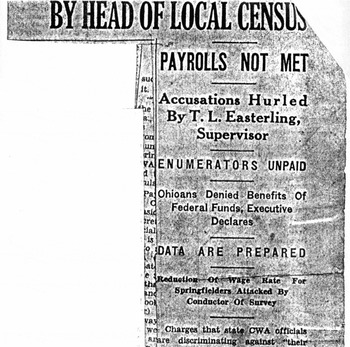
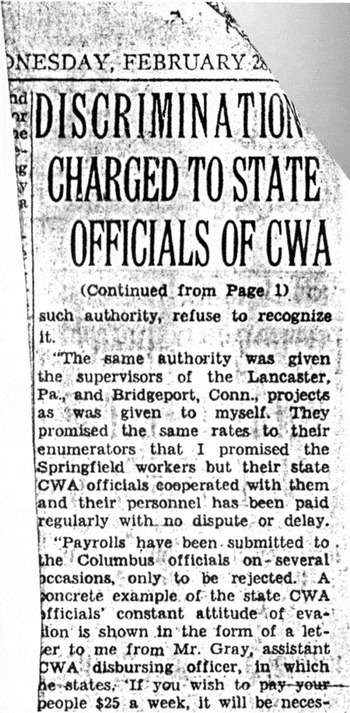
Ability tests were established, but not uniformly for the different levels of responsibility. The capacities of supervisors were tested according to their diplomas. For example, the director of the TCU, Charles E. Persons, was a “PhD in economics, who served as expert in Economics of Unemployment, 1930 Unemployment Census and as economist with New York State Joint Legislative Committee on Unemployment, 1931–1932” (RG51, e146a box 5, letter, April 26, 1936, Lubin to Ross). Thus he was not exactly what can be called a “lay person”; his record and experience proved he was an expert. Next, the supervisors of the three cities seem to have been chosen locally. For example, Thomas L. Easterling was “on the staff of Ohio University” when he was hired as head of the TCU in Springfield, Ohio (RG51, e146a box 5, letter, January 6, 1934, from Lubin to Braught). And finally, people chosen on the list of the relief organization had to pass an “examination to determine their fitness for the work.” It is certainly worth mentioning that 100 candidates came for the test on January 21 in Springfield, out of which only 21 passed on the first day of examination and 42 on the day after (RG51, e146a box 5, memo, January 16, 1934, from Persons to Lubin). In general, “since many had no previous experience, a two-day training course on techniques of interviewing and the use of schedules was offered and followed by an exam” (Schwartz Reference Schwartz1984, 178) (see fig. 6a and 6b).
Springfield Daily News, Feb. 28, 1934, page 1. The article reveals to the public the inside fights of the CWA (RG51, e146a box 5, letter, January 6, 1934, from Lubin to Braught).

Springfield Daily News, Feb. 28, 1934, page 2.

This exam, as normal as it seems now, created a scandal at the time: local administrators of the FERA pushed to have their men hired by patronage, and they refused to pay anybody in the survey until they could choose who could be hired. But the BLS opposed them vigorously, and finally won and established the formal test. This opposition between local patronage and federal examination repeated itself many times all across the U.S., very often to the advantage of the latter. Everywhere “it drove the politicians wild to find themselves without anything to say about who was going to get a job on public work” (ibid., 86). The sum of these small victories for the federal government helped to establish its legitimacy. Formal examination was one of its weapons against the local bureaucracies.
The figure that this hiring procedure draws mixes the two former models.Footnote 11 Like the reporters, these relief workers were white-collar workers able to perform an inquiry, write and read, gather information to take a survey on a problem (the Great Depression) that they themselves experienced. At the same time, like the enumerators, the organization clearly came from the center, and relief workers entered a hierarchical and asymmetrical relation. The real novelty as compared to both models is that one could not get the job without a formal test and minimum training anymore. Now, what were the surveyors expected to do while working? How was need articulated to ability?
A New Way of Questioning
We now have to examine how the job was prepared for the surveyors in terms of questionnaires, training meetings, and instructions, so that the organization optimized their ability to do their job trustworthily. As Stephan asked in preparation for the surveys, we have to examine the conditions under which “the enumerator [can] be trusted to do an honest job” (RG257, e44a, memo from Copeland, executive secretary to the CSB, December 4, 1934).
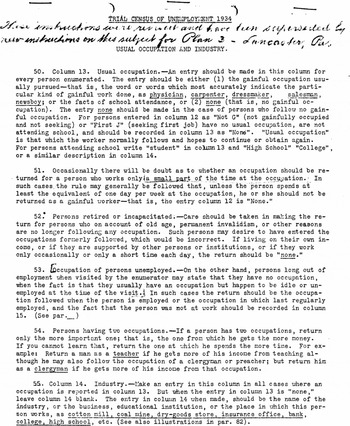
First, the example of the TCU shows that the Department of Labor Statistics, in cooperation with the staff of the Central Statistical Board, crafted a very long and detailed set of instructions. It was a fifteen-page text, the fruit of many drafts (see fig. 7, an intermediary draft), as dense as the page presented here, in which the whole survey was first explained and then each question commented upon. These instructions to the enumerators were so long that they were certainly read by the supervisor with all his team and discussed together, as is the case nowadays. These instructions certainly minimized the amount of initiative given to the surveyors, and nothing comparable could be found in any of the former models.
A sample page of instructions for the TCU in Lancaster, Pennsylvania.

The other way to make the workforce trustworthy was to express the individual questions on the questionnaires so that answers would be, not percentages as in the model of the reporters, but Boolean, which means that they could be only “yes” or “no.” Let's take the example of the questions aimed at determining whether or not the interviewee was unemployed in the Lancaster part of the TCU. These questions are interesting because they were far from being standardized at the time, and statisticians were looking for ways to clarify the very complicated notion of unemployment (Topalov Reference Topalov1994). In our example, two questions were necessary to determine whether or not a person was unemployed.
The first one concerned what would be equivalent today to activity. People of the time used the notion of “usual occupation”: A person having a “usual occupation” was the equivalent of an active person today (Topalov Reference Topalov1999). Hence question 12 read as follows: “How many persons in the household do work or want to work for money or equivalent?” and the fours possible answers were:
1) “Not working and not looking for a gainful occupation”;
2) “Looking for a first employment”;
3) “Retired but now looking for a gainful occupation”;
4) “Persons who usually follow a gainful occupation.”
Each of these options could be answered either by a yes or a no, and the task of the interviewer was to help the interviewee give the right answer. He was himself helped in this by the instructions, stating for example that “[the fourth category] does include the idle and unemployed who usually work and desire employment even though they may be temporarily unable to work.” It is important to point out that it is the notion of “usually” that makes the whole difference between the unemployed and the inactive. This is why it was explicitly defined: the person had to spend at least one day per week on this activity and, more generally, a “usual occupation” is that which “the worker normally follows and hopes to continue or obtain again” (RG257, e44a, memo from Copeland, executive secretary to the CSB, December 4, 1934).
This explains the second and third categories, which were designed to identify those who were changing their habits. This was the case for students, “Persons who never had a job but now want one,” or “Persons who recently left school,” and it was also the case for people who did not work before but “[w]ho have been forced (by loss of savings, by husband's loss of job, etc.) back into the search of employment” (RG257, e44a, memo from Copeland, executive secretary to the CSB, December 4, 1934). Options 2 and 3 had been created precisely to count these situations, unimportant numerically before the Depression, but that became huge during it.
Only those who answered 2, 3, or 4 were considered active and thus were concerned with the other question about actual employment or unemployment. The question read as follows: “Was the person at work on the last regular working day before the interview?” And, contrary to 1930's census where this question was left open, which caused immense complications (Kleek Reference Kleeck1931), eight answers were pre-established:
1) The person was at his usual “work.”
2) The person was on a “stop-gap” or was employed in another occupation than his usual one to “tide him over.”
3) The person was on a relief job.
4) “The worker has taken time off on his own accord or for personal reasons.”
5) “He was idle or lost his job because temporarily disabled by sickness or injury.”
6) His family “required” from him that he leave work.
7) “The worker himself is on strike or locked out.”
8) “Lack of work, that is the worker is able and willing to work but cannot find work.”
As can be seen, the three first options describe employment and the following five describe unemployment. In the latter cases, the whole problem was to understand the reason why the person was not at work, because not all reasons constituted unemployment. As stated in the instructions: “If the answer to the question: was he at work on the last regular working day? is ‘no,’ the enumerator will have to find out why not.” Unemployment was not (and is not) a problem of raw facts, but of the causes of the facts; only certain causes of idleness created a situation of unemployment (namely the eighth) and not the others. And the difficulty for the interviewer was to be able to identify, with the interviewee, one and only one cause to an observable situation. Questions worded so that they would provoke a Boolean answer helped interviewers capture quite simply what formerly appeared to be an extremely complex set of data (see fig. 8). The capabilities to be an interviewer of persons in need were first tested through an exam – and some did not pass. But it was also produced, enhanced at a grand scale by the agencies thanks to instructions and Boolean questions.
Picture of a surveyor in 1947 (Iowa State University Special Collection).

To conclude this part on the characteristics of surveyors, I would like to insist that articulating statistics with the population on relief in terms of need, complemented by two days of training, a test, and instructions and questions formulated in a Boolean way, initially gave rise to real scientific satisfaction. For example, Stephan, in a retrospective paper concerning the history of statistics of the time, wrote that “[one] very important general development affecting the use of sampling in the United States occurred in 1933. [It] was the organization of large-scale work projects for the unemployed under the national programs of the Federal Emergency Relief Administration (1933–35), Civil Works Administration (1934–35) [sic] and Work Projects Administration (1935–40)” (Stephan Reference Stephan1948, 23). And we can retrospectively estimate the following, very impressive, number of statistical projects realized with relief money between 1934 and 1937 (see Table 2).Footnote 12 Approximately 11,000 statistical projects were carried out in these years, corresponding at the very least to two and a half million positions! The least that we might say is that the practice of statistics was amazingly widespread during this period.
“Research and statistical survey” projects financed by the relief agencies.

The two new characteristics of surveying that were largely generalized during the statistical relief projects were a new hiring process and a new way of questioning. It seems to me that both innovations can be called “industrialization” of the survey, because they tended to establish rules, working relationships, longer instructions, and Boolean questions (Boltanski and Thévenot Reference Boltanski and Thévenot1991). They became closer to Taylor's precept than preceding practices. But in 1937 these projects were quite abruptly stopped. How can one explain this?
The Rejection of Relief
Relief statistics were considered an achievement not only in regard to the data produced, but also from the relief point of view, yet for a reason that is not trivial and that deserves to be explicated now. We will see afterwards that the discrediting of this justification led to the complete rejection of statistics produced by the needy and gave rise to the more professional figure of the surveyor.
Nowadays, we tend to understand New Deal relief policies in a vaguely Keynesian way epitomized by the image of the pump. Relief would have been a pump for money: it was first necessary to raise people's purchasing power, so that production would increase and answer this demand, and thus the whole economic cycle would restart. But, at least initially, this was not Hopkins’ view. He even explicitly wrote that “the increase of purchasing power was a secondary objective” (Hopkins Reference Hopkins1936, 116). For him, the goal of relief was to save the “morale” of people who were unemployed, to save their ability to make “choices” and save their feeling of “usefulness” to their communities. There was something spiritual in his conception of relief. He wrote, “It is a matter of opinion whether more damage is done to the human spirit by a lack of vitamin or complete surrender of choice” (ibid., 105).
To save people's dignity, the best way according to him was to provide them with actual work and work useful to the community: “The regeneration of the individual worker no longer needs to be the only concern of a national work program for the unemployed. We have come to a second concept which is that his work is necessary to enrich national life” (ibid., 173). The fact that relief was thought of as a means to help people take an active part in their communities was even translated in terms of investment, and not consumption, by Gill: “We expanded our activity into a gigantic public investment program in 1935, a program designed to utilize our manpower and make this country a better place in which to live” (Gill Reference Gill1939, 178).
The white-collar projects, associated with the famous scientific and artistic projects, made no difference in this respect. The relief agencies considered that their own role was only to ease the organization of projects that were supposed to be useful for the community. This might appear difficult to admit, since the usefulness of a statistical survey is more difficult to prove than that of a road or a bridge, but still, Hopkins wrote: “I have come to the belief that the greatest contributions, not only to American life and culture, but to employment, are these less tangible ones made by our professional and service workers” (Hopkins Reference Hopkins1936 174).
Hence, Hopkins and his relief agencies defended these projects, because they provided a way to have the very persons facing the hardest aspects of the Great Depression in the U.S. themselves produce the knowledge necessary to come out of this situation. As he noted, “we are examining our social system with the very workers which the system threw out” (ibid., 173). He knew how much this organization owed to his own agency, but the latter was nothing more than a “vehicle” to let people fight against the depression. “That the WPA has been the vehicle for this group to pursue their work . . . for the public benefit, establishing in some ways a new base for American life,” Hopkins asserted, “is something we can be proud about” (ibid., 174) This reasoning proves that he had something close to the first model of surveyors in mind, the model where a public facing a problem organizes to answer and solve it. Be it a cynical or strategic use, or an ideal in which he really believed, it is in any case an argument he thought could mobilize support for these projects. The pride he writes about is a clear sign that he thought relief statistics were beneficial to this endeavor.
But very quickly, this positive vision of the statistical projects was rejected by the professional statisticians in the rest of the government, for two main reasons. First, around 1935, a word appeared in the public sphere and imposed itself so insidiously that even those who it was meant to criticize couldn't help using it. This word, whose etymology can apparently not be found (Algeo Reference Algeo1984), but which might be traced to cowboys doing well for themselves at a ranch, was “boondoggle,” along with its derivatives, boondoggler and boondoggling. Its appearance was in itself a public critique of the relief organization.
Hopkins explains why this word, which now means “a waste of time and money; a project to spend public money” (Spears Reference Spears1996), applied initially to the enumerators of the CWA: “For lack of analysis as to the social significance of his occupation, people are using the WPA investigator as the ultimate boondoggler, his foot in the door, his pencil on his pad” (Hopkins Reference Hopkins1936, 173). And Gill gave an explanation for why the activity of enumerating became quickly despised: “Bitter criticism has sometimes been directed at the non construction projects as ‘boondoggling’ because the workers on such undertakings do not leave monuments in stone and mortar” (Gill Reference Gill1939, 193). The public couldn't see any real consequences from the statistical work initiated by the government thanks to this workforce and thus criticized it as useless.
The public criticism had a very powerful effect on the professional statisticians in the government. They feared being identified with this apparently useless group of personnel. For example, Stuart Rice, the head of the Bureau of the Census, and at the time chair of the American Statistical Association, answered a query of Senator Royal S. Copeland that if a special census had to be taken in 1937, it could in no way be a WPA project, because he saw radical incompatibilities between the legitimate goal of public works “and those of sound statistical procedure. This incompatibility is most marked in the case of projects of ‘field canvass’ type which bring enumerators drawn from relief rolls into direct contact with all classes of citizens” (RG257, e44a). He added that the previous October (1935) a resolution had been adopted by the joint committee of the CSB and the WPA that it was “automatically rejecting all further applications for projects of this type.” This resolution, Rice explained, came from the fact that the CSB feared “the public resentment fostered by statistical activities conducted with emergency funds” (RG51, e144a).
It appeared that using relief funds to carry out statistical research had the reverse effect from what one expected: instead of proving that the white-collar workers on relief could be useful, it let the public think that statistics might be useless, time consuming, and intrusive. Need hid ability, in the eyes of the public. The professional statisticians who at the time were taking root in the federal government got really frightened of this side effect and preferred renouncing this cheap workforce rather than taking the risk of appearing useless themselves.
The negative public image of relief enumerators was not the only reason that statisticians tended to reject them. Another reason can be attributed to a draft of a memorandum that Dedrick, the head of research in the Bureau of the Census, wrote to Rice but did “not sen[d but], discussed with Rice” as he wrote directly in the margin of a letter to the chairman of the CSB, He was thinking about the opportunity of taking a census of the unemployed before the decennial 1940 census and told him of the difficulties that the relation with the WPA could provoke:
Administrative freedom from the Relief Administration, federal, state, and local, is a sine qua non for the securing of data free from suspicion of administrative bias. . . . I feel that it would be better by far to continue from now until 1940 without adequate employment and population data than to subject this inquiry to the Administrative directors and domination of those whose job depend upon proving that there are large numbers of unemployed persons in their communities and to the use of enumerators whose continued support by the Federal Government will be partly contingent upon their findings in their communities on this census. . . . If complete control is given to the Relief Organization, it is advisable that none of the regular agencies of the government participate directly in this inquiry. (RG29, e210 corresp of Dedrick, May 18 1936, letter, from Dedrick to Rice, Chairman of the CSB)
The problem, as Dedrick saw it, was that WPA funding depended upon the number of people unemployed and on relief living in the country. Therefore, if this organization was put in charge of counting them, it would immediately be suspected of exaggerating the number in order to secure greater funding. In other words, the fact that the enumerators had a special and group interest in the result obtained statistically might not be an advantage for counting but, on the contrary, a limitation to its objectivity.Footnote 13 The professional objectivity and expertise that statisticians were building inside the agency was put in danger by the kind of benefit that the workforce taken from relief rolls had to offer.
Along this line, we might notice that we found nowhere the counter-argument stating that the use of people being unemployed to count the unemployed is beneficial because they know personally what it means to be in such a situation and hence can better recognize it in the interviewees. This argument could have been advanced in defense of the relief enumerators. But it had the disadvantage of supposing that the enumerators were proud of, or at least indifferent to, their former situation, whereas, on the contrary, we have seen that white-collar workers were ashamed of it. They wanted to hide their situation as much as they could. Hence, the kind of objectivity coming from personal and intimate knowledge of a situation could not be opposed, at all, to the expert and disinterested one, the one pushed forward by Dedrick (Megill Reference Megill1992).
Finally, the statisticians in the agency wanted to appear as useful, as professional, as objective, and as disinterested as they could, for which reason they avoided, as much as possible, using the WPA workforce for their studies from 1935 on. They did not always manage to bypass them, and sometimes they still used this workforce, but at least they tried hard not to hire them anymore.
Conclusion
We have identified two models of surveyors in the nineteenth century. One model, called the reporter, appeared in the agricultural field where people facing a problem organize themselves, make inquiries, and synthesize their observations in statistical language. The other model, which I call the enumerator, is more proper to the census, for example, where the center – in our case any federal agency – establishes rules for interviews and organizes a network of people who either extract data from the whole territory under its jurisdiction or take charge of hiring local people to perform this task.
These two models were not cast in iron and evolved in tandem with experiments in statistics. It happened that the New Deal was such a moment, not only because it witnessed the professionalization of statistics, which has already been often described in the literature, but also because of the much less noticed fact that the relief agencies launched a large number of statistical surveys employing a huge number of people on relief.
Initially, these surveys have been justified ambiguously both as relating to the reporter and the enumerator models. On the one hand, people on relief produced the data that would help transform America and take the country out of the Depression, and on the other, people were hired and expected to follow strict rules to produce data that the federal government could use to fight against the Depression. But professional statisticians who were in a process of institutionalization found it dangerous to appear too close to people on relief so that they rejected any alliance with the relief agencies.
The immediate result for the surveyor models is that the reporters were rejected and the enumerators industrialized in the sense that hiring tests were established, longer instructions were provided, and the use of Boolean questions was generalized. But it should not be forgotten that the reporters have continued to re-appear from time to time and transform the way statistics are produced and used. Stapleford shows very well, for example, how after World War II unions themselves began to organize the collection of data in order to produce their own cost of living index (Stapleford Reference Stapleford2010a).
The history of surveyors thus illustrates very strikingly the passage from a liberal way of governance to a more centralized one usually described as the welfare state, and this seems to be consistent with Rutherford's description of the evolution of the institutionalist movement in U.S. economics (Rutherford forthcoming). It is, finally, another example of the thesis according to which every model of government is solidified by a corresponding model of statistics (Didier Reference Didier2009).
Acknowledgments
Warm thanks to Jeremy Vetter for his help throughout the whole process from the time this paper was first presented at a workshop held in 2007 at the Max Planck Institute for the History of Science on Lay Participation in the History of Scientific Observation. I used some of the material to write my book (Didier Reference Didier2009), which was published in French. Some of the work done for the book has been used in preparing this paper. Priya Vari Sen translated parts of it.