Implications
Inorganic selenium (Se) supplements, that is selenate and selenite, have a reduced intestinal availability in ruminants, whereas organic Se, supplemented in the form of selenized yeast, has been demonstrated to be more efficiently stored in tissues and biological fluids like milk and blood than sodium selenite. In this study we evaluated lipid microencapsulated sodium selenite as an alternative source of Se in comparison with both sodium selenite and selenized yeast by assessing Se status in dairy cows. The results indicate that microencapsulation has the potential to improve the passage of non-reduced Se to the intestine and to increase Se concentration in milk.
Introduction
Selenium (Se) is an essential trace element crucial for the homeostasis of the oxidative status of animals. It plays an important role as a cofactor of glutathione peroxidase (GSH-px) and of other enzymes of the antioxidant system (Rotruck et al., Reference Rotruck, Pope, Ganther, Swanson, Hafeman and Hoekstra1973; Underwood and Suttle, Reference Underwood and Suttle1999); Se contributes also to regulate the synthesis of thyroid hormones (Berry et al., Reference Berry, Banu and Larsen1991), and improves the immune system function with particular reference to the cell-mediated immunity (Grasso et al., Reference Grasso, Scholz, Erskine and Eberhart1990); in cows, it also reduces the prevalence and severity of mastitis (Smith et al., Reference Smith, Harrison, Hancock, Todhunter and Conrad1984). Severe Se deficiencies affect fertility and reproduction, growth, and sanitary status (Weiss et al., Reference Weiss, Todhunter, Hogan and Smith1990; Underwood and Suttle, Reference Underwood and Suttle1999).
In Europe, Se is authorized at a maximum of 0.5 mg/kg DM (Council of the European Communities, 1970), whereas in the US, the Federal and Drug Administration authorized Se supplementation in feeds at a maximum of 0.3 mg/kg DM (Food and Drug Administration, 1997).
Dietary sources of Se can be organic, such as Se-methionine or cysteine, or inorganic, such as sodium selenite or sodium selenate. Inorganic Se is one of the most widespread forms of Se supplementation in feeds, but the ability of ruminants to use inorganic Se, as well as other nutrients, is strongly affected by the highly reducing environment of the rumen. In fact, the rumen reduces selenate to selenite, which is, in turn, converted into low molecular weight insoluble forms, most likely non-absorbable (Wright and Bell, Reference Wright and Bell1966; Weiss, Reference Weiss2005). Inorganic Se absorption coefficient in dairy cows is estimated to be 50% (Weiss, Reference Weiss2005), whereas organic Se, deriving from forages or grains in which it is incorporated in Se-methionine and Se-cysteine as a substitute of sulfur, is estimated to be 65%.
For this reason, the use of organic supplements, in which Se is incorporated in yeasts during fermentation, has recently become popular.
Lipid microencapsulation is an effective tool to prevent complete absorption of nutrients and additives in the duodenum and jejunum of monogastric animals (Piva et al., Reference Piva, Pizzamiglio, Morlacchini, Tedeschi and Piva2007), as well as to protect nutrients from ruminal degradation (Gallo et al., Reference Gallo, Fusconi, Fiorentini, Grilli, Fantinati and Masoero2010).
Given the importance of increasing absorbable Se flow at intestinal level, the aim of this study was to compare the efficiency of transfer of Se to plasma and milk from inorganic sodium selenite, either free or microencapsulated, and from selenized yeast in dairy cows.
Material and methods
In situ nylon bag incubation of microencapsulated sodium selenite
Feed additive
Sodium selenite (SmartSel®, Vetagro Spa, Reggio Emilia, Italy) was microencapsulated through a spray-chilling with hydrogenated fat embedding matrix method. The particle size of the final product was distributed as follows: 4.2%>2000 µm, 1500<27.4%<2000 µm, 1000<39.9%<1500 µm, 500<26.4%<1000 µm, and 2.1%<500 µm.
Animals and diets
Two Holstein cows were fitted with rumen fistula and fed a total mixed ration (TMR) containing 40% grass hay, 20% corn silage, and 40% concentrates according to National Research Council (NRC) requirements (2001). Animals were fed twice per day.
In situ nylon bag incubation
The incubation was performed according to De Boer et al. (Reference De Boer, Murphy and Kennelly1987). Briefly, nylon bags (10×15 cm; pore size 45–60 µm) were filled with 3 g of lipid microencapsulated sodium selenite (providing 10 g/kg of Se according to company specifications), sealed, and incubated ventrally in the rumen for 0, 4, 8, and 24 h. Each sample incubation was repeated twice.
Nylon bags were incubated in the rumen in a polyester mesh bag (25×40 cm; 3 mm pore size) and were removed from the rumen at the same time to allow simultaneous washing. Once removed, samples were mechanically washed with running water at room temperature. Bags at time 0 were not incubated but just mechanically washed in order to estimate the initial amount of Se in the product. Washed samples were then freeze-dried for 60 h and the weight of residues was determined on the lyophilized sample.
Se analysis and calculations
The determination of Se was performed through inductively coupled plasma-mass spectrometry ICP-MS (Agilent 7500ce, CA, USA) according to Moschini et al. (Reference Moschini, Battaglia, Beone, Piva and Masoero2010).
In vivo study
Animals and diets
The experiment was conducted between 24 October 2010 and 29 December 2010, at the Centro di Ricerca per la Zootecnia e l’Ambiente (CERZOO; San Bonico, Piacenza, Italy), which is a Good Laboratory Practice-certified facility, and operates according to the procedure of animal protection and welfare (directive No 86/609/EEC).
Thirty Holstein lactating cows were selected from the herd and randomly divided in five groups with similar average days in milking (161.6±113.8) and number of lactations (3.0±1.7). At the end of 10 days of pre-experimental adaptation, animals were randomly assigned to one of the dietary treatments which consisted of a basal TMR (0.18 mg/kg DM Se) differing only for Se supplementation source and concentration: the control group (CTR) diet was supplemented with 0.12 mg/kg sodium selenite in order to have 0.3 mg/kg DM of total Se (CTR), whereas treated groups diets were supplemented with microencapsulated sodium selenite (0.3M and 0.5M; SmartSel®, Vetagro SpA, RE, Italy) or selenized yeast (0.3Y and 0.5Y; ALKOSEL® R397, Lallemand Animal Nutrition, Blagnac, France) in order to have a final concentration of 0.3 and 0.5 mg/kg DM of total Se. Animals were fed for 56 days a TMR containing 54% of corn silage, 11.5% and 5% of corn meal and flaked corn, respectively, 13% of a mixture of soybean cotton and gluten meal, and vitamin and mineral premix; 12.3% of dehydrated alfalfa and 4.2% of rye grass hay. The TMR was formulated according to NRC requirements (National Research Council (NRC), 2001). Ingredients were mixed in a horizontal mixer without the supplemental Se and administered to cows. Then, the different Se sources (i.e. sodium selenite, microencapsulated Se from sodium selenite, or Se enriched yeasts) were premixed with 1 kg of corn meal as a carrier and subsequently added directly to the TMR. Weighed experimental diets were individually offered twice daily and refusals were removed before the fresh TMR was offered. DM intake was calculated by subtracting refusals to the amount of TMR offered.
Cows were milked twice daily at 0500 and 1500 h and the herringbone milking parlor was equipped to record individual cow milk yield (Afimilk, S.A.E. AFIKIM, Kibbutz Afikim, Israel).
Feed sampling and analyses
TMR and feedstuffs samples were collected weekly throughout the study (from day 10 to day 56) and kept frozen (−20°C). At the end of the study, samples from each week were pooled in one sample and analyzed for the nutritional characteristics according the following methods: DM was determined gravimetrically drying the sample at 103°C to a constant weight (International Standards Organization (ISO), 6496:1999), CP, aNDF, and ADF were determined according to International Standards Organization (2006, 2009) method, and International Standards Organization (2008), respectively. Starch was determined by polarimetric method according to International Standards Organization (1997).
Feedstuffs included in the TMR were also analyzed for Se content according to Calamari et al. (Reference Calamari, Petrera and Bertin2010). The basal Se content was taken as a reference to calculate the supplemental Se to be added to the experimental diets.
Blood, milk, and feces sampling and analyses
Individual blood samples were collected at the beginning of the study (day 0), and weekly thereafter by jugular venipuncture using 10 cc heparinized (lithium heparin) disposable syringes (Becton Dickinson, Franklin Lakes, NJ, USA). Blood was centrifuged for 10 min at 3000 r.p.m.; plasma was transferred with Pasteur pipette in a plastic test tube and frozen before analysis. Plasma Se and plasma GSH-px were analyzed according to Calamari et al. (Reference Calamari, Petrera and Bertin2010).
Individual milk samples were collected at the beginning of the study (day 0) and weekly thereafter. The two milk samples collected daily were pooled proportionally to the yield of each lactation and split into two aliquots. One was immediately analyzed for protein, fat, and lactose by MilkoScan (FT6000 Foss Electric, Hillerod, Denmark), whereas the other was frozen for Se analysis that was subsequently performed according to Calamari et al. (Reference Calamari, Petrera and Bertin2010).
Fecal samples were collected at the beginning of the study (day 0), at day 14, day 28, day 42, and at the end of the study (day 56), frozen, and analyzed for Se content.
Statistical analysis
Data measured over time were subjected to ANOVA using the repeated measures in the mixed procedure of SAS (SAS Institute Inc., Cary, NC, USA; release 9.1, 2002–2003) in a completely randomized design. The statistical model included the fixed effect of treatment, time of measurement and (treatment×time) interaction. The random variable was the cow within treatment. Each variable analyzed was subjected to three covariance structures: autoregressive order AR(1), compound symmetry, and spatial power. Using the Akaike information criterion and the Schwarz Bayesian criterion, the compound symmetry was the covariance structure that fitted the model best for all considered variables.
Orthogonal contrasts were used to compare the supplementation effect (CTR v. 0.3M and 0.5M; CTR v. 0.3Y and 0.5Y) and a linear dose effect of Se supplementation was evaluated on microencapsulated Se (0.3M and 0.5M) and selenized yeast (0.3Y and 0.5Y). Differences were considered significant at P<0.05.
Results and discussion
In situ nylon bag incubation of microencapsulated sodium selenite
The in situ nylon bag experiment was performed to assess the amount of Se in the lipid matrix throughout 24 h of incubation in the rumen. Se from sodium selenite in the microencapsulated product at time 0 was 8.36 g/kg and gradually decreased over time.
In particular, Se concentration in the nylon bags gradually decreased to 72%, 64%, and 40% of the initial value (time 0) after 4, 8, and 24 h of incubation, respectively. The limitation of nylon bag technique (i.e. the lack of a non-encapsulated control, due to selenite small particle size and high water solubility), and the inability of inductively coupled mass spectometry to detect the form of Se, makes it impossible to make conclusions about rumen-protection of selenite. Nevertheless, assuming that all of the selenite entrapped in the matrix remained unmodified throughout the incubation and considering an average permanence-transit time in the rumen of 8 h, we would have an extent of rumen protection ⩾64%.
In vivo study
Feed analyses and Se content
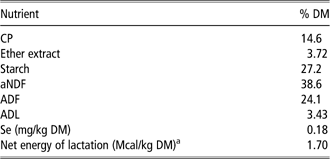
Nutritional values and the mean Se concentration of the basal diet are given in Table 1. Net energy of lactation of the TMR was calculated according to NRC (2001) considering the inclusion rates of ingredients in the diet.
Diet composition and nutrient analysis
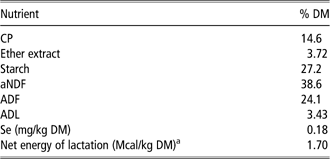
a Calculated according to NRC (2001).
Feed intake, milk production and Se concentration in blood, milk, and feces
Animals were in a good health status throughout the experiment and the average DM intake (24.2±2.4 kg/head per day) was similar among experimental groups. Milk yield (average of 34 kg/head per day) and milk parameters were unaffected by the source or the inclusion level of Se (data not shown).
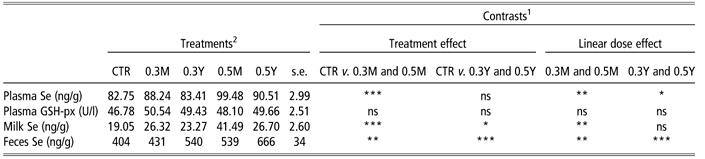
Plasma Se was generally not affected by the source of Se when fed at the lowest dose (0.3 mg/kg) even if there was a numerical increase in 0.3M group compared with CTR and 0.3Y (+6.6% and +5.8%, respectively; Table 2). Serum or plasma Se concentration are highly correlated to Se intake and for this reason they are considered a quick and effective tool to estimate Se blood status; serum or plasma Se should respond more quickly to changes in dietary intake than whole blood Se, which is, on the other side, more indicative of the historical nutritional status of the cow (Waldner et al., Reference Waldner, Campbell, Jim, Guichon and Booker1998). Se concentrations indicative of a good Se status should be above 0.18 µg/ml in whole blood or 0.08 µg/ml in plasma, and supplemental Se at 0.3 mg/kg diet is usually enough to obtain those levels in lactating cows (Weiss et al., Reference Weiss, Todhunter, Hogan and Smith1990; Smith et al., Reference Smith, Hogan and Weiss1997; NRC, 2001). Cows entering this study had Se plasma concentration of 0.078±0.0064 µg/g, and plasma Se increased over time, regardless of the treatment (day effect, P<0.05; Table 2; Figure 1b). When Se intakes were the highest, as in 0.5 mg/kg fed groups, plasma Se responded better to microencapsulated supplementation than to selenized yeast. In fact, 0.5M group had 9.9% higher plasma Se than 0.5Y (P<0.05; Table 2); the increment in plasma levels at steady state since the beginning of the study was almost double in 0.5M animals than in 0.5Y ones (29.5% and 17.8%, respectively).
Behavior of total Se in milk (a), plasma (b), and feces (c) in dairy cows that received diets containing either sodium selenite providing Se at 0.3 mg/kg DM (CTR) or microencapsulated sodium selenite providing Se at 0.3 mg/kg and 0.5 mg/kg DM (0.3M and 0.5M, respectively) and selenized yeast providing Se at 0.3 mg/kg and 0.5 mg/kg DM (0.3Y and 0.5Y, respectively). Values are least squares means, and vertical bars represent s.e. (n=6).

Effect of Se source supplementation in plasma, milk and fecal output of Se and plasma GSH-px concentration in dairy cows
CTR=control group; GSH-px=glutathione peroxidase; ns=non-significant.
1 Contrasts significance of effects of treatment (Se source) and level of inclusion (0.3 and 0.5 mg/kg).
2 Treatments: CTR, sodium selenite providing Se at 0.3 mg/kg DM; 0.3M and 0.5M, microencapsulated sodium selenite providing Se at 0.3 mg/kg and 0.5 mg/kg DM, respectively; 0.3Y and 0.5Y, selenized yeast providing Se at 0.3 mg/kg and 0.5 mg/kg DM, respectively.
*P<0.05, **P<0.01, ***P<0.001.
Milk Se concentration was affected by both Se source and dose: in particular, cows fed microencapsulated Se at 0.3 mg/kg had 38% higher milk Se than control animals, whereas yeast-supplemented cows did not differ from control or 0.3M groups (Table 2); when Se was fed at 0.5 mg/kg, 0.5M cows had 55% higher Se concentration than 0.5Y ones (P<0.01; Table 2; Figure 1a). If the ratio between milk and plasma Se concentration is indicative of the transfer of Se from blood to milk, as suggested by Calamari et al. (Reference Calamari, Petrera and Bertin2010), microencapsulated selenite at 0.5 mg/kg was more efficient than the selenized yeast as the ratio was almost 38% higher (P<0.01; Table 3). Within the 0.3 mg/kg dose there were no differences among groups (Table 3) although a slightly higher numerical trend was observed for 0.3M group.
Effect of Se source supplementation on Se milk excretion parameters
Different superscripts in the same row significantly differ.
1 Treatments: CTR, sodium selenite providing Se at 0.3 mg/kg DM; 0.3M and 0.5M, microencapsulated sodium selenite providing Se at 0.3 mg/kg and 0.5 mg/kg DM, respectively; 0.3Y and 0.5Y, selenized yeast providing Se at 0.3 mg/kg and 0.5 mg/kg DM, respectively.
**P<0.01, ***P<0.001.
When reporting Se excretion in milk to the ingested amount (mass of Se in milk over mass of ingested Se), the ratio averaged 8.6%, 10.9%, and 10.3% for CTR, 0.3M and 0.3Y group, respectively (P<0.001; Table 3) and 10.5% and 7.1% for 0.5M, and 0.5Y, respectively (P<0.001; Table 3). In this study, CTR group cows had an higher milk Se/ingested Se ratio compared with the 3.2% reported by Calamari et al. (Reference Calamari, Petrera and Bertin2010). On the other hand, average Se secretion in milk of cows supplemented with selenized yeast is expected to be 10–18% depending on lactation stage, milk yield, protein yield, and Se intake (Heard et al., Reference Heard, Stockdale, Walker, Leddin, Dunshea, McIntosh, Shields, McKenna, Young and Doyle2007; Juniper et al., Reference Juniper, Phipps, Ramos-Morales and Bertin2008; Calamari et al., Reference Calamari, Petrera and Bertin2010; Walker et al., Reference Walker, Dunshea, Heard, Stockdale and Doyle2010), whereas, in this study, 0.5Y cows had a surprisingly low milk Se concentration. Cows entering the study had a marginally adequate Se intake, with 60% of total Se (0.18 mg/kg out of 0.3 mg/kg) provided with the TMR. Therefore, the added amount, either from sodium selenite or Se yeast might have had a relatively minor impact on the total transfer. When Se was included at 0.5 mg/kg, instead, the Se supply from the TMR was relatively minor (36% of the total) and most of Se was provided with the additives, resulting in more appreciable differences for both milk and plasma concentrations.
Ortman and Pehrson (Reference Ortman and Pehrson1999) observed a peak of 31 ng/g of Se in milk of cows supplemented with 0.3 mg/kg of Se from yeast and this peak was rapidly reached after one week since the beginning of the supplementation. In our experiment, we observed a peak at 23–27 ng/g after 1 week of supplementation with Se-yeast, with minor fluctuations over time (Figure 1a), without differences between low dose and high dose of Se-yeast. Fecal Se was 34% and 25% higher in 0.3Y compared with CTR and 0.3M, respectively, and 24% higher in 0.5Y than in 0.5M (P<0.01, Table 2; Figure 1c). These data would suggest a poor Se retention in animals receiving the highest concentration of the yeast which is probably due to the source of Se itself.
GSH-px activity was not affected by the treatments (Table 2), though a numerical increase due to both microencapsulated Se and Se-yeasts was found (5–8% depending on the treatment). These results are aligned with those reviewed by Weiss (Reference Weiss2005) and Ivancic and Weiss (Reference Ivancic and Weiss2000), who reported a lack of increase of plasma GSH-px activity over a 42 days supplementation study with cows that had an adequate Se status at the beginning of the experiment. It seems in fact that the increase in GSH-px activity often described in literature might be more likely related to the amount of Se fed rather than to the source. In our study all of the animals rapidly reached a good Se status, as predicted by plasma concentration at 7 days, regardless of the treatment, and GSH-px activity remained fairly stable for the first 2 weeks of the experiment. The difference in GSH-px activity between inorganic and organic sources seems in fact to be the largest when cows are fed the lowest doses and are in a sub-clinical Se deficiency status (Knowles et al., Reference Knowles, Grace, Wurms and Lee1999; Weiss, Reference Weiss2005), whereas above the minimally adequate Se intake there is little correlation between plasma Se and GSH-px activity (Ullrey, Reference Ullrey1987).
Conclusion
To our knowledge, this is the first study where microencapsulated sodium selenite was fed to cows in comparison with either free selenite or Se-yeast. Overall, the data provided with this study lead to the conclusion that lipid microencapsulation has the potential to protect nutrients from rumen degradability and theoretically increase the amount of rumen by-pass. In this study, the effectiveness of lipid microencapsulation is further substantiated by the results obtained in vivo. In fact, in cows fed with 0.3 mg/kg of Se as microencapsulated sodium selenite, Se was transferred to milk more efficiently than in cows fed the non-encapsulated form. Within the same Se dose, the microencapsulated form was comparable to Se-yeasts at 0.3 mg/kg, but when Se was included in the diet at 0.5 mg/kg, microencapsulated Se performed better than the Se-yeast.
Acknowledgments
The authors acknowledge the financial support of Vetagro for the study.