The work of William Labov (e.g., Reference Labov1994) continues to revolutionize our understanding of the diffusion of a language in time and space. As is well known, Labov shifted the focus in dialectology from a concern with rural features to those of urban centers for all their apparent flux. Although minorities have been well studied in the United States and United Kingdom, generally speaking, they do not feature prominently in overall surveys of these territories. In the United States, African American Vernacular English was once believed to be relatively uniform, despite its spread over a vast terrain since Emancipation. Wolfram and Torbert (Reference Wolfram and Torbert2004:44) remarked that ethnicity usually trumps region in African American English and described this as “one of the great stories of modern dialectology.” However, other research can be found to counter this claim, and the work of Erik Thomas (see, e.g., Thomas & Wassink, Reference Thomas, Wassink, Llammas and Watt2010) and Wolfram himself (e.g., Wolfram & Schilling-Estes, Reference Wolfram and Schilling-Estes2006) weakened this thesis of homogeneity. Likewise, the comparative study of regional varieties of Latino English of the United States is likely to reveal much about the communities themselves, their relation to each other and the mainstream, and the contested spaces they inhabit (see Fought, Reference Fought1999, for Los Angeles).
The present paper focuses on variation in South African English, concentrating on two of its five major ethnic groups (“Indians” and “Coloureds”), for each of whom there is both a sense of national connectedness and considerable regional diversification. The scare quotes, which I will avoid using as much as possible, are meant to remind us that classifications of people characteristic of the now-defunct apartheid era should not be used uncritically. It is fully acknowledged that terms such as these are complex and fluid and sometimes hide more than they reveal. Nevertheless, the categorizations and groupings have continued to exist: as Bucholz and Hall (Reference Bucholz and Hall2008) and Edwards (Reference Edwards2011) indicated, we may be said to be living in the age of identity. I call the two groups studied “interior groups,” on analogy of the use of the term in sociolinguistic studies for the lower-middle and upper-working classes. The exterior groups are “Whites,” historically the introducers of a mainly Southern U.K. offshoot of English from the early 19th-century on, and “Blacks,” the demographic majority and now in more powerful and statusful positions since the advent of democracy in 1994.Footnote 1 It has traditionally been believed that regional variation is not very significant in South Africa among Whites. Whereas certain regions appear to have spawned early local variants, based largely on initial dialect input from the United Kingdom, the overall mobility of speakers between more coastal areas and the gold and diamond mining interior has made it more difficult to identify speakers from different areas. Lanham and Macdonald (Reference Lanham and Macdonald1979:75) spoke of the diffusion of the major variables of what was originally Natal English (a colony, later turned province, now known as KwaZulu-Natal, or KZN) “geographically and through all social ranks of society.” However, Ian Bekker (Reference Bekker2009) has argued for a greater degree of historical autonomy for Johannesburg, the largest and most industrialized city. He proposes the backing and raising/rounding of bath as a phenomenon more plausibly associated with this city's origins, rather than the earlier settlements in the Cape and Natal colonies.
Black English, which continues to grow in importance in terms of its use in Parliament, local radio, and television, has not yet been studied for regional variation. Anecdotally, people claim to be able to identify some regional characteristics (based to some extent on the influence of local languages, especially across the Sotho-Nguni divide). However, one phonetic study (De Wet, Louw, & Niesler, Reference De Wet, Louw and Niesler2007) did not find any salient differentiation across the Sotho and Nguni groups that could stand up to statistical scrutiny. What has been emphasized about Black English throughout the country is its core five-vowel system (with neutralization of length contrasts and absence of schwa), the use of syllable timing above stress timing, for example. These characteristics do not occur in the speech of young middle-class speakers, whose social networks now include large numbers of mother-tongue speakers of English from an early age, and who may be said not to speak Black English (as traditionally defined) at all – see Mesthrie (Reference Mesthrie2010).
A starting point toward a firm regional dialectology of South African English (henceforth SAE) is to note that there are two large social groups for which cross-provincial dialect mixing has historically not been a great force. For Coloured and Indian speakers, regional differences loom large. This is evident to members of these communities, who have plenty to say about how their counterparts sound in other places, especially the three largest cities, Johannesburg, Cape Town, and Durban. Indians and Coloureds who have travelled to other centers notice the stark differences in accent and dialect and are able to spot people from Cape Town and Durban easily, and Johannesburg to a slightly lesser extent. This paper additionally argues that Coloured and Indian speech is more alike than generally realized, and together they form the basic English vernacular (in one sense of the term, viz. a nonstandard L1 norm) of many cities and large towns.Footnote 2 The two main centers of influence will be shown to be Cape Town and Durban, the former for its large Coloured population showing substrate influences mainly from the languages of erstwhile slaves (Malay and related languages), and the latter for its large Indian population showing substrate influences mainly the languages of erstwhile indentured workers (e.g., Tamil, Bhojpuri). The main argument rests on a detailed analysis of the variable (t), and by extension its voiced counterpart (d). A shorter section is devoted to the analysis of (th) in word list style, as a supporting trend within the overall set /t d θ ð/.
THE ETHNIC GROUPS AND CITIES
Because the focus of the paper is on Coloured and Indian usage, it is necessary to dwell on these two categories in the following section. The other three ethnicities that form control groups in this study will first be briefly delineated. “Black” in the South African sense refers prototypically to people who speak a Bantu language and who are of indigenous African descent. This is the majority group making up 79% of the populace according to current estimates.Footnote 3 Postapartheid fluidities make this categorization and definition a little less monolithic today. “White” is often discussed as a racial category, but needs to be broken down culturally and linguistically into two prototypes: one aligned with English and the colonial settlements of the 19th-century mainly, and one with an Afrikaner heritage intertwined and identified historically with Dutch and other continental European colonists of the 17th century.
CLASSIFICATION AND ETHNIC FLUIDITIES
The notion “Coloured” is particularly complex in South African society. It is a cover term for people having African, European, and Asian ancestries, who form a community in ways that might even be said to be the most South African. That is, they are devoid of full allegiance to these old ancestries and have forged their own modernity in ways that are not unusual in the history of the world. There are thus other ways of characterizing this group of multiple ancestries than the crass definition one often encounters of “people of mixed race.” An important aspect of the group is its inclusion of the most indigenous peoples of Southern Africa, the Khoesan. Indeed individual persons of Khoesan ancestry might show no signs of genetic mixing (another problematic construct), but still be considered “Coloured.” If “Coloured” is to have any meaning for a linguistic study, it has to be as a social category, in the sense of a subjective vitality. In semantic terms, one could argue that the term means “not belonging to the other three groups of South African society: Black, White, and Indian.” Saussurian semantics would insist that the same arbitrariness (and hence emptiness) of definition applies to the other three categories: a Black person, for example, would be one who is not White, Indian, or Coloured, and so on. As Zimitri Erasmus (Reference Erasmus and Erasmus2001:15) put it: “blackness and whiteness are [not] themselves given, coherent and homogeneous identities.” To some extent colonial and apartheid policies did succeed in dividing the populace and creating two main groups, viz. Whites and Blacks, the former having technological and economic power and the latter having demographic power as the majority of the indigenous people, the ones having significant claims to the land and its traditions, together with the descendants of the Khoesan. Coloureds and Indians—having neither demographic nor socioeconomic power nationally—were caught between opposing forces. Reddy (Reference Reddy and Erasmus2001) argued that Coloured enabled and bolstered the South African system of racial categorization: any “problem” cases, including liaisons across groups could be consigned to this category. In this sense, critics are correct in warning that the use of Coloured is self-fulfilling. But, as Adhikari (Reference Adhikari and Adhikari2009:x) observed, states and ruling groups do not easily create identities among their subjects and “while they may reinforce, constrain or manipulate such identities with varying degrees of success, bearers in the first instance create and negotiate their own social identities.” Thus the four official terms are highly problematic as political constructs, because they conceal a constant state of flux: overlapping and criss-crossing social histories, interests, associations, friendships and marriage patterns, which apartheid tried to override by rigidifying social space.
The category “Indian” may seem somewhat less problematic, insofar as it denotes South Africans who claim a heritage from 19th-century India. But this category too is not stable in its own right, because there are occasional liaisons and marriages with people from other groups. A subjective element can be brought about by religion, with some people (only a few) stressing religion as the prime marker of identity above ancestral origin, hence claiming to be, say, “Muslims and not Indians.” Another consideration that clearly shows the problematic nature of racial labeling in diaspora, relates to the relation between people of Indonesian, Malaysian, and Madagascan origins, who are referred to as Malay, and whose classification under apartheid was that of a subcategory of Coloured. Because they were predominantly of Islamic faith, they formed an intermediate grouping between Coloureds (mainly of Christian faith) and Indians (many of whom follow Islam).Footnote 4 Malay and other languages of the Indonesian area formed important substrates in the history of Afrikaans and indirect influences on the English varieties of the Western and Eastern Cape. These languages were unimportant in KZN, where Indian languages played a parallel role in the later migration of indentured workers.
Historical antecedents are thus too complex to give a firm basis for ethnic classification. It is sociologically safer to accept contemporary (synchronic) senses of belonging. Ordinary South Africans who formed part of this study showed little or no discomfort with Indian or Coloured, and appeared to have achieved a localized consensus on the meanings of these terms based on their daily lived experience. Hence, assigning subjects of this study to either the Indian or Coloured category, largely based on (a) self-identification of subjects and (b) parental history, gave few problems. Often place of residence provided additional corroboration if people had been born, brought up, and remained in an area prescribed for either Indians or Coloureds under apartheid. Three specific cases will show how potential fluidities of ethnic classification were resolved. Speaker A.B. (aged 38) of Kimberley had one parent from the Indian community, and another from the Coloured community. She was categorized as Indian, as that was her self-identification, and she had been brought up as a Hindu of Tamil background and lived in the Indian part of town (as so designated under apartheid). In Cape Town where there are historical links between Cape Malay and Indian Muslims, self-identification, and allegiance to a particular identity again formed the basis of my categorization, again secondarily supported by patterns of apartheid housing. Speaker C.D., (aged 20) for example, had a paternal grandfather from India, but with the rest of her family identifies closely with Islam for religion and with Cape Malay ethnicity (within a broader Coloured community). Speaker C.P. (aged 52) from Port Elizabeth was born and brought up as Coloured, married an Indian man, and although traditional categories seemed particularly unimportant in this household, she still considers her husband Indian (with Coloured influences) and herself Coloured (with Indian influences).
The objections to these terms, especially Coloured, that one frequently encounters from activists in the press and political and academic gatherings do not apply at the level of daily interactions, when laughing and chatting with friends or when absorbed in work, rather than say consciously debating politics (see Adhikari, Reference Adhikari and Adhikari2009, for a related view from a historian). Erasmus's caveat (Reference Erasmus and Erasmus2001:14) that scholars should be critical of both the erasure and reification of Coloured identities is relevant here. As she stressed, a way out of this paradox is to focus on multiple belongings, fluidity of attitudes, and aspects of hybridity and change expected in all modern cultural formations.
Linguistically, Coloured people are associated mainly with English and Afrikaans today (see McCormick, Reference McCormick and Mesthrie2002); though some bilingualism with a Bantu language such as Zulu, Xhosa, or Tswana may occur. For many strands within this group, an ancestral Khoesan language forms part of its heritage and may still be spoken in small pockets, for example, Nama (a.k.a. Khoekhoegowab) in the northern parts of the Western Cape, close to the Namibian border. Despite some degree of overlap, the English varieties of Coloured communities are generally different from those of their White counterparts and felt to be highly distinctive (Finn, Reference Finn, Schneider, Burridge, Kortmann, Mesthrie and Upton2004; Wood, Reference Wood1987). The Indian communities of South Africa largely have English as a home language; in a small number of cases that role is played by Afrikaans or an Indian language such as Gujarati or Tamil. On the whole, language shift has produced a distinctive Indian variety of English, whose main base is the province of KZN (Mesthrie, Reference Mesthrie1992).
THE FIVE CITIES
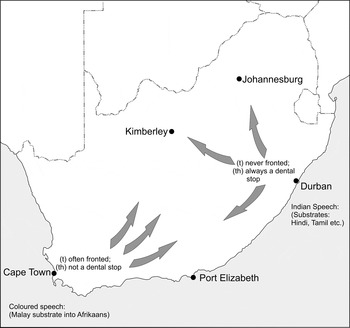
Map 1 shows the cities chosen for fieldwork: Johannesburg, Cape Town, Durban, Port Elizabeth, and Kimberley. These will be abbreviated to, respectively, JHB, CPT, DBN, PE, and KBY in maps and tables. Johannesburg is the largest city, based historically on gold mining and consequent industrialization from 1886. Cape Town is the oldest city, originally built as a halfway seaport for European trade with Asia, and remains a city reliant to a large extent on trade and tourism. Durban is a port city on the east coast of South Africa, with a mixed economy involving some industrialization. Port Elizabeth is also a port city, the largest in the Eastern Cape, and historically home to the first English settler population (since 1820). The fifth city chosen was Kimberley, originally an English-dominant city based on the diamond discoveries of 1867 onward. All five cities are multilingual and multicultural, and this cannot be ignored even in a study that focuses on English dialectology. However, English is not just widespread but dominant in these five cities at the level of education, politics, and administration. Afrikaans is widespread in four of the cities (except Durban), and in each city, a Bantu language predominates: Zulu in Durban, Xhosa in Cape Town and Port Elizabeth, Tswana in Kimberley, and Sotho and Zulu in Johannesburg. A dialectology of SAE will have to be mindful of possible patterns of influence from these sources.
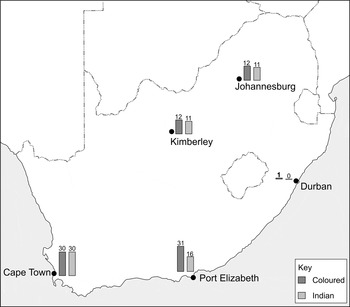
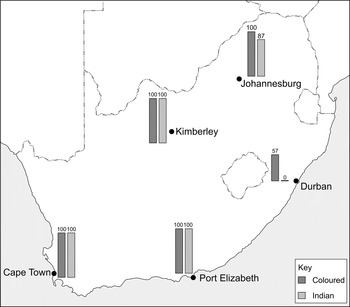
Percentage distribution of dental variants of (t) in five cities among Coloured and Indian speakers.

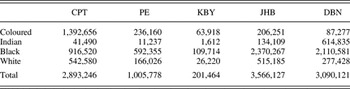
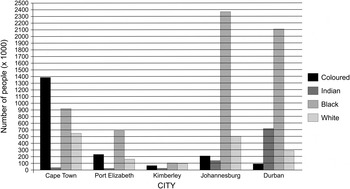
Although a few case studies of English based on specific localities in South Africa exist—such as, McCormick (Reference McCormick and Mesthrie2002) on English in District Six, Cape Town; De Klerk (Reference De Klerk2006) on Eastern Cape Xhosa English; and Mesthrie (Reference Mesthrie1992) on KZN Indian English—inter-regional variation among Coloureds and Indians has not been previously studied, either for culture or language. This paper contributes to the sociolinguistics as well as the social history and cultural geography of the communities and South Africa as a whole. An important starting point is to characterize the relative size of the Coloured and Indian communities. Table 1 gives the population figures for the five cities based on the last census of 2001. The ratio of Coloureds to Indians per city is as follows: CPT 33:1, PE 22:1, KBY 40:1, JHB 3:2, DBN 1:7. Coloureds far outnumber Indians in Cape Town, Port Elizabeth, and Kimberley. In these cities (of the former Cape Colony), Indians have acculturated to some extent to the larger Coloured communities. There was, for example, no residential or school separation in these cities prior to apartheid policies of the 1960s.Footnote 5 In Durban, these ratios are dramatically reversed. In Johannesburg, the ratio of Indians and Coloureds is much closer to equality than in any other city. As in Durban, there has been a history of separate schooling for much of the 20th century for the groups in Johannesburg, though there have been overlaps too. Port Elizabeth is interesting insofar as an Indian primary and high school were built in the 1960s, bringing teachers and families from KZN who appear to have exerted a degree of influence over the small Indian community there.
Population figures in the five South African cities (based on Digital Census Atlas (South Africa) (2001). 2001 Census)

THE DATABASE AND METHODOLOGY
This study is based on a project on English social dialectology in five South African cities. A minimum of 10 persons for each ethnicity per city was undertaken, making a total of 200 people nationally for the regional survey. Allied to this are additional interviews emphasizing not regional characteristics, but class fluidity and mobility as young people gain access to quality nonracial education in schools, especially in former White private and public schools. This brings the total number of speakers up to 250. This paper analyzes relevant data from 110 of these speakers, that is, 8 Indians and 8 Coloureds from each city, and 30 control speakers from the Black and White groups.
A judgment sampling approach was used during fieldwork, in which I made local contacts with a schoolteacher or social worker, who directed me to homes where I could interview people of the background I wished. Given South Africa's apartheid geography, all interviewees for this part of the project lived in areas that were once created and reserved for Coloureds or Indians. The Coloured areas I worked on were El Dorado Park (JHB), Athlone (CPT), Wentworth (DBN), Galvandale and Parkside (PE), and Florianville (KBY). The Indian areas were Lenasia (JHB); Rylands (CPT); Chatsworth, Merebank, and Isipingo (DBN); Malabar (PE); and Mint Village and Moghul Park (KBY). In most cases, I interviewed people in their own homes, undertaking a fairly standard Labovian interview (see Labov, Reference Labov, Baugh and Sherzer1984), in which I emphasized matters of local social history, early childhood games, schooling, postapartheid changes, and crime in the neighborhood—a regrettably common theme that formed the equivalent of the danger of death narrative. At the end, speakers read out a short word list, a version of Wells' (Reference Wells1982) lexical sets, with some additions appropriate to the South African context. Fortuitously, these lists contained at least 10 tokens of the variable (t) and at least two of (th). I did not use a reading passage, as experience had shown that many South Africans struggle with reading, especially if it is not a language of the home.
Why choose (t) as a major variable? From extensive experience in Durban and Cape Town, it was clear to me that the two cities differ not only in terms of the intonation and rhythmical patterns of their Coloured and Indian speakers, but also of segmental variables too. For the latter, it is the dental versus alveolar variants of (t) and (d) that are quite striking. Durban seldom produces dentals; Cape Town often does. In fact, in broader Cape Town Coloured and Indian speech, the entire set /t d s z l r n/ is variably dental or alveolar. A word such as interested may in certain vernacular styles have all its consonants dental: [ɪ
 ə
 ə
 ə
 ]. It was felt that this striking difference would be the most effective initial inroad into characterizing regional variation in these subvarieties of SAE. Ladefoged and Maddieson (Reference Ladefoged and Maddieson1996:21) noted that dental stops are usually laminal (with contact between tongue blade and both upper teeth and front part of alveolar ridge), and alveolar stops are usually apical (with tongue tip contact on the center of the alveolar ridge). Other combinations are possible, if rare, cross-linguistically. They observe that what are often described as dental consonants may well be better described as laminal denti-alveolars. This last characterization is appropriate for this study: what I refer to in short as dental or fronted variants of (t) are most likely to be laminal denti-alveolars, but this has still to be proven by experimental palatography. In terms of analysis, 60 tokens of (t) were studied per interview, and around another 10 from the word list (this varied somewhat per speaker as the word list was slightly adapted as the project progressed).Footnote 6 Twenty tokens from the beginning of the interview were taken to represent a more formal section, as people gave their personal details, address, and such. Another 20 tokens were taken from an informal section drawing on discussions about midway through, with interviewees usually talking about their memories of school. A final 20 tokens from a narrative section drew on a crime or other free-flowing story. In this way, 5,660 tokens of (t) were gathered for the two main groups studied, with a grand total of 7,487 including the control groups. Position within a word was not controlled for in choosing tokens (but was later factored into the statistical analysis). Analysis was done purely by ear to differentiate whether (t) was realized as an alveolar (the standard variant) or fronted as a dental stop (a vernacular variant in many cities).Footnote 7 Though the basic distinction studied in this paper is between alveolar and dental stop, it will sometimes be more convenient to refer to the dental variants as “fronted” and the rest (alveolar and postalveolar) as “nonfronted.” To check against errors of transcription, three interviews chosen at random were reanalyzed as a form of double-checking. Of the 180 tokens checked, there were two errors, which were corrected. Subsequent random spot checks revealed no further anomalies. Nevertheless, in the interests of objectivity, a small-scale reliability test was carried out, by having an independent researcher on the project score 200 tokens from 3 different speakers (representing 2 ethnicities, 2 genders, and 2 cities).Footnote 8 Of the 200 tokens, there was a consensus for all but 5, giving a reliability rate of 97.5%.
In only a few instances was it difficult to decide whether a dental or alveolar stop had been produced: such genuinely intermediate, and therefore indeterminate, forms were excluded, as were unclear forms arising from soft or overlapping speech. Also excluded were the following:
• (t) in triconsonantal clusters, as it would be difficult to objectively ascertain the place of articulation in words such as wants.
• (t) before a /θ/ as this usually led to progressive assimilation as in that thing, in which many speakers produce a geminate dental [
 ] in fast speech, [dæɪᵑ] ‘that thing’.
• Occasional tapped, flapped, or trilled intervocalic /t/, which is more a feature of fast speech in the varieties concerned (most intervocalic tokens were an alveolar stop).
There were other variants: retroflexed, fortis, unaspirated, and affricated /t/, These are of interest to a regional dialectology, but would require a further close study.Footnote 9 However, because the main parameter of analysis was whether there was fronting to a dental position or not, most of these in practice were scored as “nonfronted.” One other variant that complicated the analysis was a new rival “variant from above,” an audibly released ejective or affricate in final position, which is usually fronted. This is one of several new forms in SAE, characteristic of “expressive” styles of mainly young middle-class speakers. This new variant does pose a slight complication for this study, as it presumably carries some extra nuance to its young users. In the end, it was simply treated as any fronted (t). However, its influence will become evident in the VARBRUL analysis of position of (t) in a word (Table 4), and for future analyses, it may well have to be studied separately, assuming that it does stabilize. The data was analyzed via Goldvarb X (Robinson, Lawrence, & Tagliamonte, Reference Robinson, Lawrence and Tagliamonte2001) to tease out the influence of social variables (city, ethnicity, and gender) from linguistic variables (position of /t/ in a word, and the presence of a following /r/) and style.Footnote 10
The analysis of (th) was simpler. Only word-list style tokens were analyzed, and a simple percentage analysis was carried out to demonstrate robust correlations with the use of (t).
RESULTS FOR (t) – REGIONAL DIFFERENTIATION AND ETHNIC SIMILARITIES
The following social factors formed the independent variables of the study: city of origin; gender (male, female); linguistic environment; and style (narrative, casual, formal, word list). In terms of the linguistic environment, differentiating the position of (t) within the word is an obvious step; inspection of the data in most cities suggested a further linguistic constraint, viz. whether it is part of a /tr/ cluster or not. In all cities but Durban, (t) is very frequently dental in underlying /tr/ clusters, with the /r/ in fact becoming a syllabic voiceless trill.Footnote 11 For speakers in Cape Town, it is part of a general rule in which all initial clusters made up of (C)C(r) are broken up in this way: spray, pray, crate, dry, cry, true, and so on. For some speakers, this rule applies to both liquids, not just (r): plate, clay, for example. I did not code for influence of a preceding or following vowel, as an initial inspection of the data showed that this did not affect the articulation of /t/. Alveolar [t] and dental [t] may each be preceded or followed by back and front vowels, as evidenced by words like talk, to, butter, but, teacher, sitter, it occurring in the data base with a dental or alveolar articulation, often in the speech of the same speaker.
Cross tabulating the data in VARBRUL showed some interactions that had to be teased out. The main interaction was that all tokens of final (t) were by definition a subgroup of the environment “not before /r/.” To overcome this overlap a single factor group was recreated as follows: (a) initially and before /r/ versus initially and not before /r/, (b) medially and before /r/ versus medially and not before /r/, and (c) word-finally.
As far as style is concerned, there were insufficient tokens of word-list style for independent statistical analysis; to avoid empty cells, the factors “word-list style” and “formal style” were collapsed.
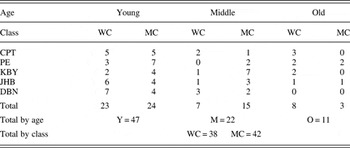
Regarding sampling: speakers were initially selected for gender and ethnicity per city to enable an even distribution for viable statistical analysis. Thus in each city, 4 male and 4 female speakers from each of the 2 ethnic groups was studied, making a total of 80 speakers. Table 2 shows how the sample fares for age and social class. For age, the parameters set were Y(oung) = between 16 and 30 years, M(iddle aged) = 30 to 50, and O(ld) = 50+. The overall distribution was Y:M:O = 4:2:1, in keeping with the project's ultimate interest in changes of speech habits among young people in postapartheid society. As far as social class was concerned, the survey aimed at working- and middle-class speakers, which was decided by area and type of residence and whether people owned the accommodation or were tenants. Other indicators were checked to see if the broad division was upheld. Occupation and education level of adults in the household gave corroboration of the classification of subjects. There were no practical problems in coming to a decision on the social class of individual speakers. Table 2 shows that breaking down the samples results in some empty cells and some cells with just one speaker. Hence, age and social class were not isolated for statistical analysis.
Structure of the sample by age, class, and city

Map 1 presents a bird's eye view of the percentages of dental /t/ per ethnicity per city; thereafter, the results of the Goldvarb runs for Coloureds and Indians together are given in Table 3.
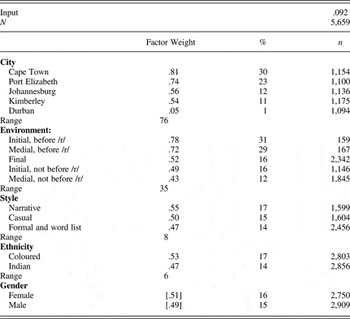
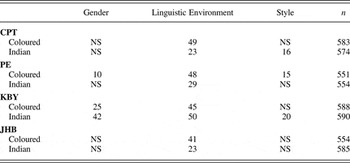
Goldvarb analysis of the contribution of internal and external factors selected as significant to the probability of [t] fronting among Coloureds and Indians in five cities

Table 3 shows that all factor groups tested are significant, except gender, with regional differences being the most salient.Footnote 12 Coloureds and Indians alike show the greatest fronting of /t/ in Cape Town, followed by Port Elizabeth; they show less fronting in Johannesburg and Kimberley, respectively, and the least (almost nil) in Durban. Overall, the two communities show a small (but significant) measure of ethnic differentiation. Ethnicity is in fact the weakest of the five significant factor groups accounting for the variance in (t). Because the percentages for Indians and Coloureds are virtually identical in four of the cities (but not Port Elizabeth), a rerun with just four cities was undertaken. This time ethnicity is eliminated as a significant factor group, showing that Port Elizabeth is the odd city out. The factor weights for ethnicity in the four cities become: Coloured (.51), 14%, n = 2,253 and Indian (.49), 13%, n = 2,306.Footnote 13
For Port Elizabeth, there is an “external” explanation involving dialect contact with Durban among Indians, via the influence of the Indian primary and high school. This influence is likely to wane with ethnic concentrations in schools now being less robust, and with staff no longer necessarily selected on ethnic lines. My expectation is that Port Elizabeth will, ceteris paribus, show the same percentages for Indians and Coloureds in the next few decades.Footnote 14Map 1 shows that despite the ethnic difference, Port Elizabeth is the city with the second highest percentage of dental (t), for Coloureds as well as for Indians. The social ramifications of these dialect correlations are explored in the final section.
For each city and ethnicity, eight independent Goldvarb analyses were conducted to ascertain how similar the linguistic constraints were per city (except Durban, the city in which fronting is very rare). Significant linguistic constraints per ethnicity per city are given in Table 4, the most effective summary being via the range of highest and lowest factor weights per factor group. Coloured groups in all cities show considerable conditioning of (t) by linguistic environment in all cities, but style is not significant, except in PE (where the expected hierarchy Narrrative > Casual > Formal and Word List holds). Gender is less consistent across cities in this group, being significant in PE and KBY, where women use more of the dental variant than men do, but not in CPT and JHB. The overall picture is therefore that of a relatively stable variant among Coloureds in the four major cities.
Relative strength of factor groups to the probability of [t] fronting by Indians and Coloureds in four cities (excluding Durban) by range values (from eight independent analyses)

Note: NS = not significant.
Indians, by contrast, show less consistency in the four cities in all three factor groups. They show linguistic conditioning in the four cities but with a much lower range than Coloured speakers (except for KBY, where they are almost on an equality). Gender is not a significant variable except in KBY, where men's scores outweigh women's. Style is significant in CPT and KBY (Narrative > Casual > Formal and Word List), but not in the other two cities. The statistics in Table 4 suggest that Indians have accommodated to Coloured norms in four of the cities, but not completely. In the fifth city, Durban, the Coloured group shows almost no fronting, in keeping with the norms of White L1 English as well as of Indians.Footnote 15
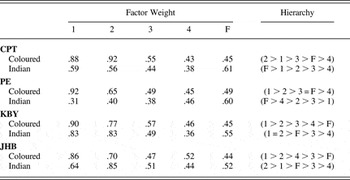
Table 5 provides a closer analysis by constraint hierarchies within the main factor group in all four cities: linguistic environment.
Constraint hierarchy for linguistic environment per ethnicity per city

Note: 1: initially before /r/; 2: medially before /r/; 3: initially, not before /r/; 4: medially, not before /r/; F: word final; = denotes equal weighting of two factors.
To make comparisons easier to read, the labels 1, 2, 3, and 4 are used in Table 5 to refer respectively to initial and medial positions of the variable before /r/ and to the initial and medial positions without a following /r/. Word-final position could have been labeled 5, but because this is a complex environment, an F (for “final”) was used to show the overall patterning clearly.
To make sense of Table 5, it is first necessary to ignore F—the use of word-final (t)—which is subject to the incoming prestige variant mentioned previously. In this case, the pattern is broadly that environments before /r/ favor dental variants of (t) over other environments. This holds for seven of the eight subgroups, the only exception being Indians in PE, who we have argued are exceptional in showing possible influences from DBN, a nondentalizing area for (t). Going deeper into the hierarchies, we see that word-initial (t) before /r/ is a favoring environment, followed by medial (t) before /r/, then other occurrences of initial (t), and lastly other occurrences of medial (t), that is, the prototypical hierarchy is 1 > 2 > 3 > 4. Apart from Indians in PE, there are also minor differences to this prototypical pattern among Coloureds in CPT and JHB.
If we now factor in the word-final environment, then a major difference shows between Coloured and Indian speakers. For Coloureds, word-final (t) is the least favoring environment in two cities (KBY and JHB), and in the other two (CPT and PE), it is the least but one. Indians in the sample show the opposite. Final position is the most favoring factor in three cities, but not in KBY. It would appear that young Indian speakers of middle-class background have been quicker to adopt the incoming prestige variant of the fronted, ejective, or sometimes affricated /t/ in word-final position in expressive styles. Thus, Tables 4 and 5 show some fine-grained differentiation between Indians and Coloureds within the cities. However, if we factor out PE as showing mixed norms for Indians and if we factor out the influence of the incoming prestige variant of final (t), then the distribution of the variants of (t) per city is closely matched by both ethnic groups.
COMPARING (t) IN OTHER SOUTH AFRICAN ENGLISH VARIETIES AND A FIRST PASS AT ORIGINS
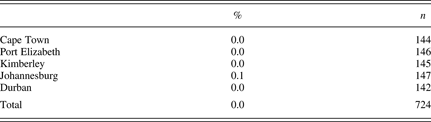
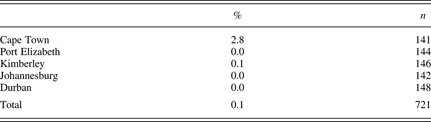
So far we have established the fairly close relationship between Coloured and Indian English regionally over the variable (t). It is now time to consider the other groups of White and Black South Africans. First, I show that there is almost no use of dental /t/ in one control group of White English speakers, with the following characteristics: they are middle-class urban dwellers in one of the five cities, born and raised there; have English as dominant language; and while many are familiar with Afrikaans from school, it is very much their second language. This group speaks what is historically the main variety of SAE. Ten speakers, made up of one man and one woman from each city, were analyzed in the same way as the data of the previous section. As Table 6 shows, the results are almost categorically in favor of alveolars, rather than more fronted equivalents.
Presence of fronted [t] in a White control group per city
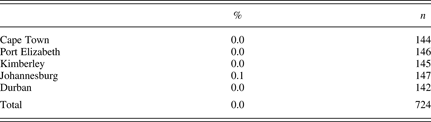
Although fronting of /t/ does not really show up in the White L1 control group, some fronting of alveolars is occurring in prestige varieties of the Johannesburg area. Bekker (Reference Bekker2007) showed this to be particularly true for /s/), whereas O'Grady and Bekker (Reference O'Grady and Bekker2011) showed by acoustic analysis that this is also true for /z/ but not for /t/ or /d/. The authors did not analyze word-final /t/, because the method used was reliant on the effects on following vowels. However, as mentioned previously, this seems the precise environment in which this change from above is taking place among middle-class youth, who occasionally front /t/ in expressive styles with some affrication or ejection. In Table 6, the two Johannesburg tokens of fronted /t/ were in final position, with aspiration.Footnote 16
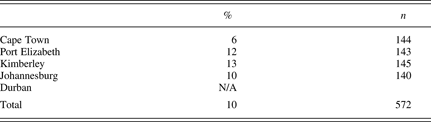
A second control group from within the White communities is that of L2 English speakers with Afrikaans as first language, or fully bilingual English-Afrikaans speakers, who are conscious of an Afrikaans heritage. This time the total comes to eight speakers, because Afrikaans is not a language generally used in Durban. The figures in Table 7 show that dental variants are a reality in this group, although possibly not as strong as for Indians and Coloureds. Clearly Afrikaans substrate has some relation to the presence of dental [], which I will explore further.
Presence of fronted variant of (t) in a White Afrikaans L1 control group per city
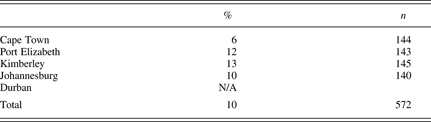
Note: N/A = not available.
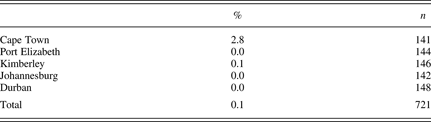
A final comparison is with speakers of Black SAE. Table 8 shows a pattern of non-use in three cities, with a small measure of usage in Cape Town and Kimberley. The pattern suggested in this preliminary comparison is that Black SAE is not generally a /t/ fronting dialect. As no previous description of the variety (notably Van Rooy, Reference Van Rooy, Schneider, Burridge, Kortmann, Mesthrie and Upton2004) mentions such a process, we must explain the occurrence of such sporadic fronting in Cape Town and Kimberley via dialect contact with Coloured speakers. This is a more plausible conduit of influence than via White Afrikaans speakers, given the fault lines of apartheid. A possible confirmation comes from Cape Town and Kimberley being the two cities where the Coloured to Black ratios of speakers is closer to an equality (14:9 and 4:7) than in the other cities, where Black people predominate (JHB 1:11, PE 3:7, DBN 1:24) (see Figure 1).
Relative size of main population groups per city in 2001.

Presence of fronted variant of (t) in a Black control group per city
Coloureds and Indians alike show the greatest fronting of /t/ in Cape Town, followed by Port Elizabeth, they show less fronting in Johannesburg and Kimberley, respectively, and the least (almost nil) in Durban. This regional distribution closely follows the history of Afrikaans, which existed in Cape Town for the longest period (since 1652 in its antecedent Dutch form), followed by Port Elizabeth. Kimberley and Johannesburg had attracted large numbers of Afrikaans speakers to the mines since the 1880s, even though English was a dominant language. Durban had very few Afrikaans speakers historically and remains an English- and Zulu-speaking city. The correlation with Afrikaans demographics means that the L2 English of (White) Afrikaners becomes of especial interest.
A first pass at the regional and social distribution of dental variants of (t) would recognize the importance of Afrikaans. Dental [t] occurs in the English of Coloureds, Indians, and Afrikaners of four cities in which Afrikaans is used; it does not occur in the one city, Durban, where the language has few speakers. It is most used in the oldest city, Cape Town, where Dutch and Afrikaans dominated for a century and a half before the arrival of English. But the case is not quite as open and shut as this. First, we need to note that dental [] occurs much more among Coloured than White Afrikaans speakers of English. Second, it is unclear whether dental variants were common in the original Cape Dutch and Afrikaans of Whites. For Dutch, most sources suggest alveolar realizations of /t/, although some phonetic sources (e.g., Jongman, Blumstein, & Lahiri, Reference Jongman, Blumstein and Lahiri1985) give /t d n/ as dentals. Studies of Afrikaans give even less support for dentals, though again the actual situation appears complex. LeRoux and De Villiers Pienaar (Reference Le Roux and De Villiers Pienaar1927:96) described /t/ as an unambiguous voiceless alveolar plosive, but paradoxically said in the next paragraph (1927:97) that in comparison to Dutch, English, and German, Afrikaans [t] has a softer character [’n dowwe karakter], resulting from the blade as well as the tongue tip contact with the alveolar ridge [tandwortels]. Writing about the same time, Hopwood (Reference Hopwood1925), a trained British phonetician, failed to note this difference from English in his detailed comparative phonetic account of English and Afrikaans. And present-day textbooks continue to describe Afrikaans /t/ as alveolar, without dental variants. However, preliminary investigation of word-list style of Afrikaans words such as tong ‘tongue’ and tiener ‘teenager’ suggest that although /t/ is largely alveolar, dental variants are also salient. In particular, /tr/ clusters have dental variants (of both consonants) in, for example, trek ‘journey’, draad ‘wire’.
On the basis of the quantitative evidence, it is likely that dental [] arose in the Coloured population first, under substrate influence. Possibly relevant substrates would be Khoesan languages of the indigenous population of the Cape and Malayo-Polynesian languages of slaves. Bantu languages of slaves from Mozambique and Angola were numerically less prominent, and Bantu languages do not generally have dental /t/. Indian languages such as Bengali spoken by slaves of the 16th and 17th centuries have a basic distinction between dental and retroflex stops, but as present-day Indian English shows, an alveolar /t/ of a target language like English or Dutch is usually identified with the retroflex phoneme of substrate languages. Khoesan languages do give some evidence of dental rather than alveolar /t/: Khoe languages like Korana and Nama (Beach, Reference Beach1938:217), and the San language !Xóõ (Traill, Reference Traill1985:151).Footnote 17 But, on the whole, the Khoesan substrate is less influential in the Afrikaans of Coloured people of the Cape, because the gradual adoption of Afrikaans went hand in hand with the jettisoning of a large number of marked consonants of Khoesan languages, notably the clicks.
The most likely substrate source is not Dutch or Khoesan, but the Malayo-Polynesian languages of the East Indies. Malay, a major language of the slaves, has dental rather than alveolar /t/ as a norm (Ahmad, Reference Ahmad1991).Footnote 18 Moreover, Malay does not have /tr/ or /dr/ clusters. Stell, Luffin, and Ratiep (Reference Stell, Luffin and Ratiep2007) referred to the notable tendency among Cape Malays (descendants of the slaves) to syllabify Afrikaans consonant clusters. As already noted, Cape Coloured English (of which the Malay community forms a subpart) is notable for a high degree of syllabification of initial clusters of (voiceless) stop + liquid and of dental articulations of /t/ and /d/ plus a following /r/. The influence of Malay slaves was strongest in the Cape (progressively from Cape Town to Port Elizabeth and later in Kimberley), less so in Johannesburg and least in Durban. This accords rather well with the quantities of dental [] in these cities, as per Map 1. Because substrate influence should not be invoked in an ad hoc fashion, it is necessary to point to the influence of Malay religion and culture in the country long after the languages of the slaves ceased to be used. There is a persistence of other linguistic features, first in Afrikaans and subsequently in the English of Coloured communities, especially. Among these are reduplication (rampant in Malay and Afrikaans, but not Dutch; and spreading in SAE generally) and indirect forms of address instead of pronouns Does uncle want to go now? (for “Do you want to go now, uncle?”). For many families, these features have survived two language shifts—from Malay and related languages to Afrikaans and eventually to English—without an appreciable period of bilingualism in Malay and English.
A SUPPORTIVE TREND: CLOSE PARALLELS BETWEEN (th) AND (t)
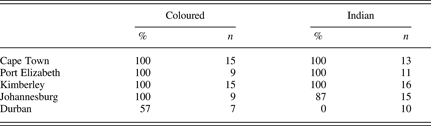
A closely related variable is (th)—that is whether /θ/ occurs as a (voiceless) interdental fricative or dental stop. Among Indians in the province of KwaZulu-Natal, this is saliently a dental stop (not denti-alveolar). The regional distribution of this variant of (th) becomes relevant because a dental realization of (th) would clash with a dental realization of (t), producing (hypothetical) homophones such as tick and thick (both [ɪk]). For reasons of time, only word-list tokens were studied, providing—as Table 9 shows—robust results. In particular, the tokens mouth or bath provided examples of final (th). Table 9 gives the percentages of the standard variant of (th) in English, so as to show the correlations with (t) in Map 1 more clearly.Footnote 19
Word-final (th) as an (inter)dental fricative by ethnicity and region in word-list style
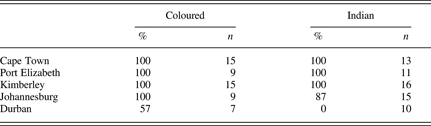
A full study of the variable in all positions within a word in all styles is a desideratum for future research and will tease out ethnic differentiation in initial position. Map 2 shows that the regional distribution of initial fricative realizations of (th) correlates strongly with dental (t). The simple rule is that areas with relatively high proportions of dental (t) have a fricative realization of (th) and areas with little or no dental (t) have dental stop realizations of (th). Of the three control groups, with the structure described earlier, (th) is not a variable in the White L1 English and Afrikaner L2 English communities (with 100% occurrence of [θ]). Black L2 speakers in the control group show variation among [θ], [], and [t], but the number of tokens is too small to cite with any reliability.
Percentage realizations of word-final (th) as a dental fricative in word-list style in five cities.

From a regional perspective, Indians in Durban stand out for their invariant realizations of a dental stop and appear to influence Coloured speakers in the same city. The preponderance of fricative realizations of (th)- and (dh)- are noteworthy, given that we are dealing with varieties that arose via second language acquisition. In the New Englishes across the world, such fricative realizations are rare (Mesthrie & Bhatt, Reference Mesthrie and Bhatt2008:126). This time, substrate influences seem less likely. First, English [θ] and [ð] regularly correspond to alveolar stops [t] and [d] in Afrikaans and Dutch. Second, neither Khoesan languages nor Malay has any /θ/ and /ð/ fricatives. As Map 3 shows, a more plausible explanation overall acknowledges two main waves of regional substrate influences for English of Coloureds and Indians: one for (t) and one for (th). From the Western Cape, Malay, via Afrikaans, gave rise to dental variants of plosive (t), hence blocking dental stop variants of (th). From KwaZulu-Natal province, the Indian languages gave the impetus for dental stop realizations of (th), hence blocking dental stop variants of (t).
Two waves of differential substrate influences over the use of (t) and (th).

THE SOCIOLINGUISTICS OF COLOURED AND INDIAN ENGLISH DIALECTOLOGY
Broadly speaking, the two variables suggest that there is regional differentiation between the cities: for neither variable are all cities united. The two variables also show that there is great similarity between Coloured and Indian usage, except in Durban, where there is agreement over (t), but some differentiation over (th). This suggests a pattern of overall regional cohesion, with some ethnic differentiation in Durban. That Coloured and Indian norms are fairly similar in Cape Town, Port Elizabeth, and Kimberley is a result of demographics. The smaller Indian communities have accommodated to the larger Coloured ones. In Durban, it appears that Indian speech and Coloured speech are different, but that the smaller Coloured community has accommodated to some extent to Indian norms, as evident over (th).Footnote 20 For Johannesburg, the results for (t) and (th) in both groups show similarities with Coloured national norms, suggesting the influence of Coloureds on Indian speech.
The criss-crossing of dialect and ethnicity is an interesting one that can produce anomalies that fly in the face of the simplistic racial categorization of South Africa in former times. Identities are based not just on ethnicity, but also on a sense of place that gives due regard to dialect demography. (Class and gender have further possible modificatory roles to play. In this study, gender effects were found to be minimal, and class could not be reported on in a statistically reliable way). The theme of the instability of social categories and their overlapping and sometimes contradictory nature is a salient one in modern cultural thought and has some relevance to this study.
Dinesh of Kimberley spoke of the close relations between Indians and the larger Coloured communities there. He was also aware of a sense of difference in relation to history, religion, and culture (though again there is considerable overlap). But in Durban, his accent is commented on, and unless people knew him personally, they would wonder whether he was of Coloured background. This was ruefully recounted, when he spoke of a time when he wished to go to Durban in search of a job. An aunt had given him the name and number of an acquaintance with whom he might possibly stay in Chatsworth, a working-class part of Durban. On phoning her to make such an arrangement, he was greeted with incredulity. The rather homebound acquaintance of his aunt refused to believe that he was Indian (for her, sounding Indian meant sounding like a Durban Indian) and took him to be a con man intending to come over and rob her. On the phone with a stranger, regional linguistic difference trumped potential ethnic solidarity. But real-life interaction can prove a counterbalance. This was captured in another rueful account of a rural Indian man not far from Durban, in describing the visit of someone from Port Elizabeth: “I thought he was Coloured, he sounded Coloured and he looked Coloured, but—you know what—he knows India better than me, he's been to India and he knows his connections an’ all from there.” In this anecdote, demographic and dialect certitude characteristic of the Durban area meets the sociolinguistic convergence characteristic of the two groups in other provinces.
This convergence may not be complete. To illustrate this, I cite the responses of some young Indians in Port Elizabeth and Cape Town who do not think they sound different from their Coloured friends (except in choices of words pertaining to religion and culture). But the Coloured friends I questioned insist that Indians can be differentiated from them on the grounds of their speech. To explain this anomaly I suggest that the smaller of the groups exhibits a mid-range of the full slice of variation inherent in the dialect of the larger community. Indians are perceived as different from Coloureds by the latter in some cities because they do not exhibit the full range of intonational contours, speech rhythms, and localized syntax. Style may also be a confounding factor in such overt judgments, as different speakers may be thinking of different styles in making their judgments.
Another slightly different strand concerning dialect, ethnicity, and perception comes from quite a few Coloured informants from Durban who indicated that their counterparts from other cities say that they sound Indian. As one speaker, Lee Anne, put it, “My friend was making a call and she was asked like, ‘You sound Indian, but why's your name Johnson?’” In contrast, Lee Anne and her friend are quite certain that they do not sound Indian, and that Indians speak quite differently—referring to some of the broader features of working-class Durban Indian grammar and accent. Furthermore, Indians of Durban would not mistake a local Coloured person for an Indian based on speech alone. In fact, English dialect is one of the main props for differentiating the two groups. Lee Anne—again—articulated this well, emphasizing that it is a strength of Coloured people that they resemble all the others—Blacks, Whites, and Indians—but would nevertheless recognize someone as being Coloured. In pursuing this, I asked how she could possibly differentiate between a Coloured and an Indian person on the street, when the ethnic clues pertaining to religion, culture, name, dress might be absent. In response, she laughed, saying “Once you speak . . . , I think it's once you speak . . . a Coloured person speaks, in Durban anyway, speaks English and they speak in a certain way.” Such in-city perceptions are too complex for outsiders, who respond to certain general variables that signify difference from their own speech.
The complexities over dialect in multiethnic spaces do not stop here. There is some informal evidence from my interviews that Coloured speakers in Durban are unwittingly accommodating to Indian speech: this applies especially to working-class men. In speaking to me, Leon used the general Durban Coloured dialect, but toward the end of the interview, with the recorder switched off, a young neighbor of Coloured ethnicity came in on an errand, and they chatted in a way that seemed closer to Indian speech. The neighbor asked, You haven't got old speaker cord?, using four features of Durban Indian speech: lack of do-support, noninversion in yes-no questions, variable absence of indefinite article, and couching the query in the negative for pragmatic deference.Footnote 21 Leon in turn appeared to accommodate to his neighbor's style. I was struck by the irony of a Coloured speaker speaking to me in a “Coloured way” during the interview (even though he knew of my Durban Indian background) but speaking to a fellow Coloured in a slightly “Indian way.” I infer from this paradox that (a) the working-class Indian variety is spreading among working-class Coloured males, but that (b) it is covert or informal—for reasons of formality more traditional Coloured speech of the area is considered appropriate.
These complexities should not be taken to mean that everything is in dialect flux. A careful variationist analysis shows the patterns behind the apparent diffuseness. At a regional level, especially the level of the vernacular delimited by social interactions, there are cohesive patterns. South Africa shows, perhaps more robustly than other Anglophone territories, a thriving regional dialectology largely independent of the mainstream. At the larger national level, as people talk to strangers on the phone or move from one area to another, they face sociolinguistic surprises that challenge their dialect upbringing in specific regions.