As sociolinguistic research accumulates, we acquire multiple perspectives on certain linguistic variables whose usage has been examined in a variety of communities and by a variety of methods. The variable (r), defined as the variable acoustic presence of a constricted [r] in a syllable coda, is among the most widely studied sociolinguistic patterns, having been the subject of one of Labov's (1972) early investigations.Footnote 1 It has been examined in a variety of English dialects in the United States, the United Kingdom, and New Zealand, at least, as well as in other Germanic languages, such as Dutch (see overview in Plug & Ogden, Reference Plug and Ogden2003). Given the extensive research on (r) in the fields of phonetics, phonology, and sociolinguistics, and the notoriety of (r) as a feature of the Boston accent, it is surprising that what laypeople refer to as Bostonian “R-dropping” has not been scrutinized more carefully in the sociolinguistic literature. Against the backdrop of findings that the constraints influencing (r) are not universal, we present an account of the current state of variation and change in Eastern New England (ENE), and in particular New Hampshire (NH), as the result of the processes of transmission and diffusion (Labov, Reference Labov2007) and divergence (Niedzielski & Giles, Reference Niedzielski, Giles, Goebl, Nelde, Stary and Wölck1996), arguing that no process on its own can account for the observed patterns of (r) in ENE.
The variable (r): Some definitions
We use (r) to indicate the alternation between consonantal constriction and vocalization of what has been variously called “etymological,” “historical,” or “orthographic” <r> in a syllable coda. This environment is referred to as “post-vocalic r,” and it is exemplified in (1), where the variable (r) is capitalized.
(1) Coda r
a. caR
b. caRd
Linking r may be considered a special case of (r) in nonrhotic dialects; it refers to the (r) environment when the word following a word-final (r) begins with a vowel, as in (2).
(2) Linking r
peanut butteR ice cream
The (r) in such words is often constricted ([r]) but may also be vocalized (Ø or [Ə] or [a:]). Following (Labov, Reference Labov1972:50), we refer to the constricted coda variant as (r-1), the consonantal value of (r) in most American English dialects. We refer to the nonconstricted variant as (r-0), again following Labov (ibid.): “unconstricted schwa, lengthened vowel, or no representation.” This variant is the stereotypical “r-less” Boston variant. The alternation between these two forms, (r-0) and (r-1), is the primary focus of this paper.
Depending on the assumed underlying form of words with orthographic coda <r>, linking r may be indistinguishable from coda r. Although we use “(r)” to refer to this variation in both preconsonantal and prevocalic contexts, our analysis separates the contexts of following consonant and following vowel.
This paper examines the effects of a range of constraints in one style (a casual reading passage) to pave the way for further study involving a wider range of styles, including spontaneously produced speech. We will provide evidence that (r) in ENE speech is changing, and that this change is occurring differently in different ethnic and geographic communities. Our study benefits from previous work on other varieties.
The variable (r) and, in nonrhotic dialects, [r]-sandhi phenomena such as intrusive (r) (as in vanillaR ice cream), have been studied using variationist methodology in many dialects of English, including American English, British English (Foulkes, Reference Foulkes1997; Foulkes & Docherty, Reference Foulkes and Docherty2001; Mompean & Mompean, Reference Mompean and Mompean2007), and New Zealand English (Hay & Sudbury, Reference Hay and Sudbury2005; Hay & Warren, Reference Hay and Warren2002).
Nonvariationist work on (r)
Aside from geographically broad surveys such as The Linguistic Atlas of New England (LANE) and The Atlas of North American English (ANAE), previous studies of Boston English present the variety as exhibiting categorical (r-0). Laferriere (Reference Laferriere1979), in her study of the orC vowel (the alternation between [ο] and [ɒ] for the stressed syllable of words like normal), assumed categorical /r/-vocalization as the context of the vowel she was studying. McCarthy (Reference McCarthy, Sutton, Johnson and Shields1991, Reference McCarthy1993) and Halle and Idsardi (Reference Halle, Idsardi and Roca1997) presented phonological analyses that account for categorical r-deletion, r-intrusion, and linking r in different contexts.
McCarthy's (1993) analysis is perhaps the most familiar. He proposes that, to create maximally harmonious syllables, coda r does not surface preconsonantally but does surface following certain vowels in prevocalic position, even if the r is not present orthographically. Our empirical data support the part of his model that requires two different accounts for preconsonantal versus prevocalic environments, but our data do not support the categorical implications of his analysis.
Anttila and Cho (Reference Anttila and Cho1998) presented an Optimality Theory model that allows for variation in the production of postvocalic /r/ but do not identify factors that condition this variation. Bernard, Andrus, and Anttila (Reference Bernard, Andrus and Anttila2007) presented another Optimality Theory model for Boston (r) and support it with production data for a small number of speakers. Their conclusions regarding the differing factor effects are supported by our study.
A BRIEF HISTORY OF ENGLISH (r)
We briefly review the history and distribution of nonrhotic and rhotic varieties because understanding the pre-existing condition of (r) is crucial to understanding the current situation.
British English dialects were rhotic from Anglo-Saxon times up until approximately the 17th century (Crystal, Reference Crystal2005:467). The period in which (r) began to change in British dialects is not certain; Hill (Reference Hill1940), for example, noted variability in (r) as far back as 1300 (cited in Bonfiglio, Reference Bonfiglio2002). By the 19th century, the change in postvocalic r received attention from prescriptive grammarians such as the British John Walker, author of the influential Pronouncing Dictionary of English (Reference Walker1774), who noted that /r/ had begun to sound “soft” in words like farm (Crystal, Reference Crystal2005:467). Despite criticism from prescriptive grammarians in the 18th and 19th centuries, this innovation spread robustly beyond the south and southeastern British dialects where it began, with the result that English Received Pronunciation and much of the English spoken in England today is nonrhotic.
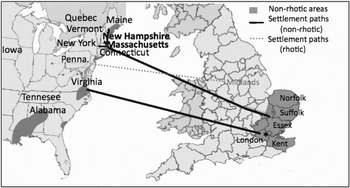
Much of the geographic variation of (r) in the United States may be traced to differences in rhoticity in the founding settlers' dialects. In the early 18th century, England was variably rhotic, with the counties around London, in the south and southeast of England, being nonrhotic, and the areas to the north and west (including Scotland and Wales) being rhotic. The Massachusetts Bay area and Tidewater Virginia were settled primarily by nonrhotic and variably rhotic speakers and are thus notable exceptions to the general settlement of the American colonies by people from what were predominantly rhotic parts of the United Kingdom (see Figure 1).Footnote 2
Sources of nonrhoticity in the settlement of the original 13 colonies. The locations of the North American studies discussed are also shown.

Middle colonies such as Pennsylvania were settled by Scots-Irish, Quakers (from the North, North Midlands, Wales, and Scotland) and Germans, all speakers of rhotic dialects. These settlers then pushed westward, carrying their rhoticity with them (Baugh & Cable, Reference Baugh and Cable1993:381; Wolfram & Schilling-Estes, Reference Wolfram and Schilling-Estes2005:110–1). Many settlers to the 13 colonies were thus probably rhotic; Fennell (Reference Fennell2001:213) wrote that even “New York City, which is renowned for its /r/-lessness … was actually a rhotic area in the beginning, and only became non-rhotic under the influence of eastern New England in the nineteenth century.”
The locations of the North American studies discussed are also shown in Figure 1.Footnote 3
New England (r)
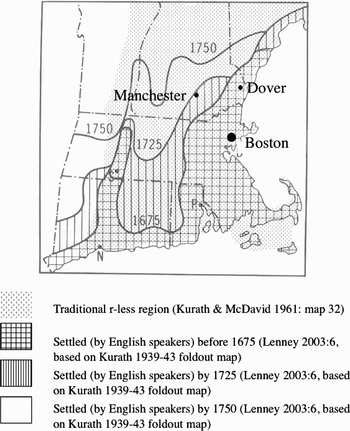
The nonrhoticity of ENE and Tidewater Virginia was thus circumscribed. These areas were settled predominantly by colonists from southeast England, one of the very few nonrhotic parts of the United Kingdom in the 17th century (Chambers & Trudgill, Reference Chambers and Trudgill1998:95; Wolfram & Schilling-Estes, Reference Wolfram and Schilling-Estes2005:106). These settlers first spread south to Connecticut and Rhode Island, and north to Maine; much of New Hampshire was settled later due to “greater resistance by the Native Americans” (Baugh & Cable, Reference Baugh and Cable2001:347) (see Figure 2). The majority of New Hampshire's early English-speaking settlers either came directly from the same southeastern part of England or moved from the Boston area (Kurath, Bloch, Hanley, Hanson, & Lowman, 1939–41; Rooney, Zelinsky, Lauder, Vitek, & Pennington, Reference Rooney, Zelinsky, Lauder, Vitek and Pennington1982:11; Zelinsky, Reference Zelinsky1992:118–9). Thus all of the area that we report on, Boston and southern New Hampshire, originally shared the same dialect features, including nonrhoticity.
Dates of settlement of ENE and location of our sample, based on Lenney (Reference Lenney2003) and Kurath et al. (Reference Kurath, Bloch, Hanley, Hanson and Lowman1939–1941).

The nonrhoticity of these areas was the subject of comment from early on. Webster wrote in Dissertations on the English Language (1789) that although the “softer” sound of the English r compared with that of other languages (e.g., Irish) was desirable, “omitting the sound altogether” was not: “it seems to be habit contracted by carelessness” (quoted in Bonfiglio, Reference Bonfiglio2002:38). Despite comments like those by Webster, it is hard to estimate the extent of nonrhoticity in this time. Krapp (1925, cited in Bonfiglio, Reference Bonfiglio2002:39) proposed that Webster, in his zeal to unite spelling and pronunciation, underestimated the amount of nonrhoticity of his day. Bonfiglio also pointed out that Webster was from Hartford, Connecticut, an area that Krapp characterized as rhotic (ibid., 231). Bonfiglio (Reference Bonfiglio2002:42) suggested that Webster's own rhoticity as well as his belief in the correspondence between orthography and pronunciation contributed to his endorsement of constricted r. Footnote 4
Krapp (1925) and Kurath et al.'s (Reference Kurath, Bloch, Hanley, Hanson and Lowman1939–1941) Linguistic Atlas of New England (LANE) portrayed nonrhoticity as the primary dialect feature that separates ENE from Western New England (WNE), roughly along the Connecticut River. Labov, Ash, and Boberg's (2005) ANAE map 16.1 showed that, today, (r) constitutes a major difference between ENE and WNE speech, with WNE producing (r-1) variants nearly categorically. But as far back as LANE, ENE has shown variation in (r). The first work to discuss Boston's “return to rhoticity,” as Wells (Reference Wells1982:520) put it, was van Riper (Reference van Riper1958). Parslow (Reference Parslow, Williamson and Burke1971:127) reported the same finding: “Of all present phonological developments in the Boston dialect, the most apparent is the re-introduction of r-timbre in vocalic nuclei.” He also noted that “few” of his Boston informants were “completely r-less” (ibid.). Informed by Parslow's work, Wells (Reference Wells1982:521) declared that “far from continuing as a centre for the dissemination of non-rhotic pronunciation, [Boston] is itself becoming rhotic.”
We assume that work on Boston (r) such as that of van Riper (Reference van Riper1958) and Parslow (Reference Parslow1967) examined the speech of White Bostonians only.Footnote 5 Indeed, we know of no studies of African American English in the Boston area, despite the fact that people of African descent have been living there since the 1600s (Peterson, Reference Peterson2007), and by the early 1800s, there was already enough of a community to support five Black churches in the Boston area (Hayden, Reference Hayden1983).
The ANAE (Labov et al., Reference Labov, Ash and Boberg2005:48) stated that (r) is a stable variable in Boston, in contrast to what we will show, that Boston (r) is a change in progress. The ANAE results are likely due to the fact that their conclusions are based on 10 to 20 tokens of (r) per speaker, collected incidentally to their primary work on vowels. Our larger sample provides a more complete and nuanced view and shows that (r) is rapidly undergoing change in Boston, and that in NH, (r) has nearly completed the change from (r-0) to (r-1).
The context of this study
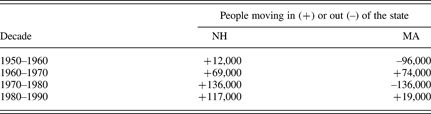
We contextualize the change by considering the relationship between residents of NH and Boston. Nagy (Reference Nagy2001) detailed examples of negative attitudes expressed by New Hampshirites toward Boston, including but not limited to derogatory remarks about Bostonians' habits of “dropping their r's.” Nagy (Reference Nagy2001) and Wood (Reference Wood2010) illustrate several variable phonological patterns in which NH has diverged from Boston over the last 40 years. These changes coincide with major changes in NH's population. Table 1 illustrates how a massive influx of new residents changed NH's population in the second half of the 20th century. These figures suggest that the newcomers came primarily from the Boston area: in the 1970s, the same number of speakers left Massachusetts (MA) as came to NH. Evidence for this interpretation is provided by Luloff and Ilvento (1981, cited in Wood, Reference Wood2010) who show that in 1976–1977 alone, well over half of all driver's licenses exchanged in NH by new residents were from MA.
Population changes in MA and NH
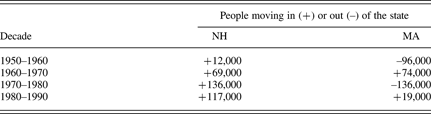
Source: Adapted from Ferrie (Reference Ferrie2006), reported in Wood (Reference Wood2010).
In the following decade, newcomers would have come from a greater variety of locales, including a number of rhotic communities, as the number of incomers to NH greatly exceeds the number leaving MA. Wood (Reference Wood2010) more thoroughly describes the details of what he calls the “in-migration” to NH during this time. The proportional increase in NH's population in this time is especially remarkable given that the population of the entire state remained less than one million until the 1990s. The addition of 136,000 people in the 1970s increased the small state's population by more than 10%. Most of these newcomers settled in the southern part of the state, where our study is situated (the North remains sparsely populated). The population trends described here motivate the division of the speakers in our study into “older” and “younger” groups at a point that separates those who were born in NH prior to the influx from MA from those who were born later.
Critical to understanding the differences we discuss in the changing dialect of NH is the combination of increased contact between two historically r-less groups, the local New Hampshirites and the relocated Bostonians—seen as “invading” NH—in addition to newcomers from elsewhere with fully rhotic dialects. While, as noted, people in NH tend to denigrate r-dropping, (r-0) is seen as a point of pride in the Boston community, at least in some sectors. Pride in this feature is evident from advertising that makes use of r-dropping, such as the “Makahs Maahk” whisky ads on Boston-area billboards and delivery trucks, and online guides to the local dialects such as The Wicked Good Guide to Boston English,Footnote 6 which begins with an extensive discussion of r-dropping.
METHODS
We turn now to describing the methods of our study of (r), based on 55 speakers in Boston and NH who collectively produced over 11,000 tokens of (r).
Participants
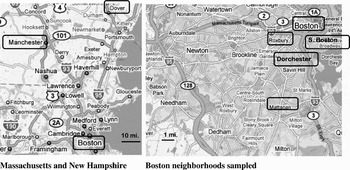
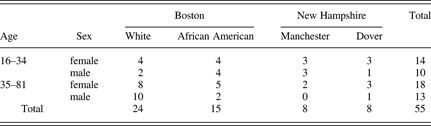
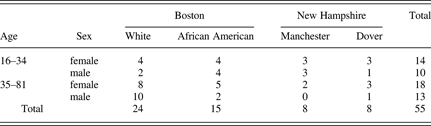
All speakers were born in Boston, MA, and two NH towns, Dover and Manchester, and were lifetime residents of the towns in which they lived at the time of the interviews. The NH towns are each located about an hour's drive from Boston (see Figure 3). We used the I-95 belt (locally referred to as “128”) to define our Boston boundary (cf. Parslow, Reference Parslow1967:10). Most of the White speakers lived in the working class neighborhoods of South Boston (“Southie”) and Dorchester. Most of the African American speakers were residents of Dorchester or the predominantly African American communities of Roxbury and Mattapan. Manchester, NH, speakers were recorded in the traditionally French-Canadian working class area of Manchester called Pinardville, and many were residents of Pinardville. All NH speakers were White. The distribution of speakers according to age,Footnote 7 sex, place, and ethnicity is shown in Table 2, and their locations in Figure 3.
Location of communities examined.

Distribution of speakers by town, ethnicity, age, and sex
Data collection
To make our data comparable to other studies, we have followed methodology traditionally used by sociolinguistic studies for recruiting participants and for analyzing and interpreting the data (cf. Labov, Reference Labov1972). Strangers were approached in public places in the three towns and asked to help with our study. As our sample developed, we targeted neighborhoods and sites in which we were most likely to locate the types of speakers needed to fill out the sample design, in terms of age, sex, socioeconomic status, and ethnicity. One variably rhotic local interviewer administered the reading passage to each speaker, sometimes accompanied by a fully rhotic, nonlocal interviewer.
As a first stage in analyzing the complex variation patterns for this variable, and to facilitate comparisons between speakers, we present an analysis of reading passage data. This method provides similar data across speakers by controlling for context, style, and content, while producing more naturalistic speech than that which occurs when participants are asked to read word lists or disconnected sentences. A number of studies, beginning with Labov (Reference Labov1972:113), have shown that intergroup differences are larger in more spontaneous speech than in reading passages. Thus, if we are able to establish social heterogeneity via reading passage data, it is safe to assume that there is at least as much variability in more conversational speech. Our analysis relies on the relative strength of various factors, as well as comparison of relative rates of production of (r-1). We know of no published reports indicating that the relative ranking of constraints in a dialect differs across different speech styles or degrees of formality.Footnote 8
Recordings were conducted in 2006–2007.Footnote 9 We casually approached strangers in a variety of public spaces including parks, streets, public libraries, small businesses, and schools and asked them to help with a school research project. Upon confirming that the speaker was a native of the area and gaining permission to record, we asked speakers to read a three-page story about the “Blizzard of '78,” a major event in New England history. Following the recording, speakers filled out a brief demographic questionnaire; all demographic information we provide is self-reported. Because of this hit-or-miss method of data collection, we were not able to develop a perfectly balanced sample and, in particular, were not able to locate many older willing participants native to NH. Although this gap in our sample underlines the fact that many older people living in NH were not born there (and thus not qualified for our study), it unfortunately left us with less evidence of the older variety of NH speech.
The reading passage contains 203 words with postvocalic (r) and is composed of two texts found online and slightly edited (Spina, Reference Spina2005; Urbanek, Reference Urbanek2003). It consists of a light-hearted, conversational reminiscence of a major blizzard, followed by a series of humorous tips for surviving the winter in New England (see Appendix A). Reading this passage aloud takes approximately five minutes, though recording time was often longer, as speakers often interjected their own comments and opinions; we interpret this as indicating speakers' engagement with the material. Following the reading passage, many speakers shared their own memories of the Blizzard of '78; we do not include analysis of this spontaneous speech here.
Coding the data
For the dependent variable, a binary choice between presence (r-1) or absence (r-0) of constricted [r] was made. Both authors coded the data. Intercoder reliability checks were conducted on a subsample of 400 tokens and ~90% agreement was attained (Cohen's kappa = .80 for a different subsample of 200 tokens). All tokens that were ambiguous to one coder were coded by the other. An additional test of intercoder reliability on an independent sample of 60 utterances from several American and British dialects produced an intercoder reliability rating of 83% (Yaeger-Dror, Kendall, Foulkes, Watt, Eddie, Harrison, & Kavenagh, Reference Yaeger-Dror, Kendall, Foulkes, Watt, Eddie, Harrison and Kavenagh2008).Footnote 10
A subset of the data was analyzed acoustically and formant measures were used as continuous dependent variables in a series of regression analyses (Nagy, Reference Nagy2008), but this method shed no further light on the variation discussed here. The binary approach presented here allows for comparability with the other studies, in addition to capturing laypeople's impression of (r-0) as r-dropping. To further enable comparability with other studies of (r), independent variables were selected that have been examined in studies of (r) elsewhere. Lexical frequency was added to the set of variables because of its known effects on phonological processes (cf. Bybee & Hopper, Reference Bybee and Hopper2001).
Linguistic factor groups
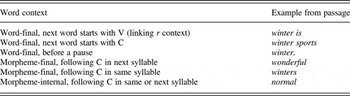
Included in the analysis are morphological, phonological, and lexical variables that have been fruitfully examined in other studies of American (r). Before describing the factor groups we used, it is worth recalling the three relevant positions for /r/, shown in Table 3: (1) word-final, (2) morpheme-final but not word-final, and (3) morpheme-internal. With these distinctions in mind, the morphological factor coded for is the position of /r/ with respect to morpheme boundaries and the consonant/vowel status of the following segment. These factors, which we call “word context,” are shown in Table 4. “Pause” was coded as the following context in cases of a perceived silence.
Possible positions of (r)

Word context

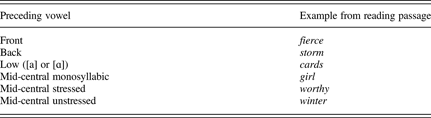
We also coded for the surface quality of the vowel preceding the (orthographic) r (Table 5). For tokens with central vowels, we initially made a three-way distinction: stressed monosyllabic schwa (girl), stressed schwa in a polysyllabic word (worthy), and unstressed schwa (winter). We ultimately collapsed the two stressed schwa categories (FUR and WORthy).
Preceding vowel
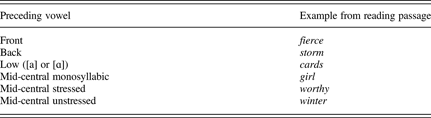
After examining these factors separately, we constructed a combined factor group for preceding vowel and following context in order to compare our results to other studies—in particular Feagin (Reference Feagin, Edmondson, Feagin and Mülhäusler1990), who organized her data in this way. Thus, we discuss the phonological context as one variable that incorporates the quality of the preceding vowel, stress, and following environment. Our data consist primarily of tokens in which (r) is in the nonlinking, or preconsonantal environment, although we also include approximately 1,100 tokens in the linking context, a context not considered in Feagin's study because of its assumed categorical effect of producing (r-1) in that variety.
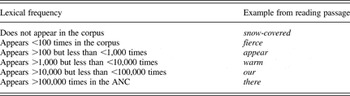
We coded for three lexical variables relating to the word containing (r): lexical frequency, word length, and whether the word was functional (closed class) or lexical (open class). These three factors interact: function words tend to be more frequent, and more frequent words tend to be shorter (Bell, Brenier, Gregory, Girand, & Jurafsky, Reference Bell, Brenier, Gregory, Girand and Jurafsky2009; Shi, Gick, Kanwischer, & Wilson, Reference Shi, Gick, Kanwischer and Wilson2005). Of these three interacting factors, lexical frequency provides the best fit to our data, so we include this factor and exclude the other two in all analyses. To produce a discrete variable, necessary for analysis with Goldvarb, words were grouped into six categories depending on their frequency of occurrence in the spoken text portion of the American National Corpus (Reppen, Ide, & Suderman, Reference Reppen, Ide and Suderman2005), as shown in Table 6.
Lexical frequency categories

Source: Based on ANC data (Reppen et al., Reference Reppen, Ide and Suderman2005).
Social factor groups
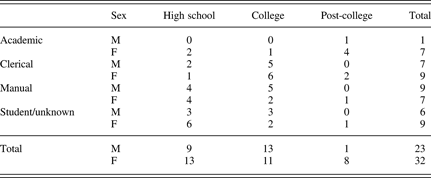
Our speakers represent a broad spectrum of ENE, coming from several neighborhoods in Boston, MA (population approximately 600,000), Dover, NH (population approximately 28,000) and Manchester, NH (population approximately 110,000) (U.S. Census Bureau, 2006). The speakers vary according to their hometown/neighborhood, ethnicity, age, sex (Table 7), level of education (Table 7), and linguistic marketplace (estimated by reported occupation; see Table 7). We coded the data for all of these as categorical variables. Because education and linguistic marketplace interact somewhat, we compared several analyses with different factors and determined that linguistic marketplace most clearly corresponds to linguistic differences. We therefore focus on linguistic marketplace to the exclusion of other socioeconomic status variables (though we include the effect of education in the overall analysis). Table 7 shows limited colinearity between education and linguistic marketplace—one is not strongly predictive of the other.
Distribution of speakers by sex, highest level of education completed, and linguistic marketplace index
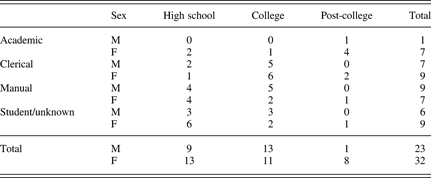
Linguistic marketplace (Bourdieu, Reference Bourdieu1964, Reference Bourdieu1977; Sankoff & Laberge, Reference Sankoff, Laberge and Sankoff1978) is an estimate of how much standard speech matters in the participant's job. The highest level of this variable includes academics, such as teachers and librarians, who are generally seen as models of “proper” speech (cf. Sankoff, Cedergren, Kemp, Thibault, & Vincent, Reference Sankoff, Cedergren, Kemp, Thibault, Vincent, Fasold and Schiffrin1989). The middle value of this variable includes those for whom standard speech at work is important but not omnipresent: bureaucratic workers in office and service occupations. Third, blue collar or physical laborers are not held to particular standards of speech to perform their jobs. Finally, we included a category for students, who are still progressing toward their niche in the linguistic market; also included in this category were “others,” those whom we could not categorize based on available information. Speakers' distribution by this index is shown in Table 7. With the exception of the “academics,” these groupings are well-balanced between the sexes.
Analysis
Rates of (r-1) were calculated across all 203 word types so that any lexical effects could be identified (i.e., word types pronounced categorically as (r-1) or (r-0)). Rates of (r-1) were also calculated for each individual. As no categorically behaving words or speakers were found, all data was then submitted to multivariate analysis using Goldvarb X for Macintosh. The step-up/step-down procedure was used to determine factor weights, the significance of factor groups, and their rank in terms of how much of the variation each group accounts for. Comparison of log-likelihoods was used to select from a large number of analyses those that best model the data and present a cohesive picture of the current state of (r) in ENE.
RESULTS
We found (r) to be truly variable for all of the factors we consider: No speaker was either categorically r-ful or categorically r-less, and thus no social group was categorically r-ful or r-less. These findings are in contrast both to Labov et al.'s (2005:226) report for ENE and Villard's (2009) findings for the Upper Valley area of NH (on the Vermont border) where some (younger) speakers are categorically r-ful. Our most r-ful speaker produced 92% of his tokens as (r-1) and our most r-less speaker produced 5% (r-1). Similarly, none of the 203 words exhibited categorical (r-1) or (r-0). Thus, no environment was categorically r-ful or r-less, not even linking environments, which are assumed to be categorically r-ful in nonrhotic dialects (cf. McCarthy, Reference McCarthy1993).
We first discuss the effects of the linguistic factors for the data set as a whole, and then for various subgroups of speakers (by age, ethnicity, community), making two main points: (1) different sectors of the community vocalize (r) at different rates, and (2) while all sectors of the community respond similarly to almost all of the linguistic factors, younger NH speakers exhibit fewer constraint effects, and younger speakers in all communities have higher rates of (r-1) than do the older speakers in their community. We also report differences between White and African American Bostonians. Below, these distinctions are further evaluated in light of the synthesis of factor effects found in other studies of (r).
All the New England speakers combined
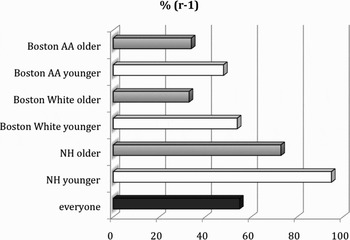
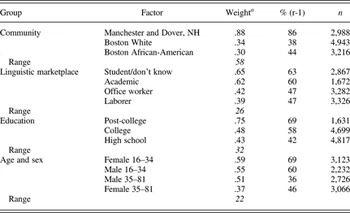
Overall, (r-1) occurs 53% of the time in these reading passage data. Younger speakers produce more (r-1) than older speakers, and New Hampshirites do so more than Bostonians (see rates in Figure 4). Frequencies and factor weights in all tables and figures indicate the status of (r-1). Table 8 shows the linguistic and social factors that significantly correlate with this variable. The factor groups are ordered so that the one with the greatest magnitude of effect is at the top; linguistic and social factors were analyzed separately. In this way, we can see the importance of town, ethnicity, and age over the other social factors, and the strength of the phonological context versus other internal factors.Footnote 11 Within each factor group, factors are arranged in descending order of favoring (r-1); all factor groups tested were significant. These factors will be discussed in more detail in relation to the specific communities considered.
Percentage of (r-1) by age, town, and ethnicity.

Goldvarb analysis of all speakers: Significant social factors

Application value: (r-1); N: 11,147; Input: .56.
aThere are several minor interactions, evidenced by the mismatch in ranking between factor weights and percentage of (r-1). We attribute the two among the social factors to the cross-community differences. These interactions motivate our separate analyses of the different communities and age groups below. The interactions among the linguistic factors seem due to small numbers of tokens for preceding /u/ and preceding pause.
Social factor groups
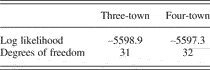
In the step-up/step-down analysis of social factors (Table 8A), the first factor selected—the factor with the largest effect, by far—is a combination of location and ethnicity: NH is more rhotic than either White or African American Boston, and there is little difference between the two Boston groups. We originally divided the 55 speakers into four categories—Boston Whites, Boston African Americans, Dover Whites, and Manchester Whites—but then collapsed the NH data into a single group because the Manchester and Dover groups had virtually identical factor weights (.90 and .88, respectively).Footnote 12 Organizing the data in this way is further supported by comparing the log-likelihoods of the three- and four-town analyses.Footnote 13 In spite of similar rates of (r-1), Boston Whites (.33) and Boston African Americans (.28) are kept separate in all analyses because of different patterns of constraints.
The next two factor groups selected are linguistic marketplace and education. Because these factor groups operate differently in the different communities, only brief discussion of their effects is given here. Speakers with academic professions are more rhotic than those with office jobs who are, in turn, more rhotic than blue collar workers. The fourth category, student/unknown, has the highest use of (r-1), presumably because of the young age of the students. A higher level of education corresponds to more (r-1).
The fourth social factor selected by the step-up/step-down analysis is a combination of age and sex, dividing speakers into four groups: “younger” males and females (ages 16–34), and “older” males and females (ages 35–81). Younger speakers favor (r-1) significantly more than older speakers. Assuming the validity of the apparent time construct (Bailey, Wikle, Tillery & Sand, Reference Bailey, Wikle, Tillery and Sand1991), these results suggest a change in progress and run counter to observations in the smaller ANAE sample (Labov et al., Reference Labov, Ash and Boberg2005:48), which found no age effect. Note that the effects of education and linguistic marketplace further suggest that the change to increased (r-1) is a change from above.
Linguistic factor groups
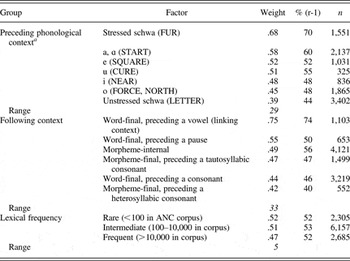
In the step-up/step-down analysis of linguistic factors (Table 8B), the first factor selected is the preceding vowel. Stressed central vowels (FUR, WORK) are the most favoring context for (r-1), and unstressed central vowels (LETTER) are the least. The full vowels have slightly different factor weights from each other; their ordering does not correspond to any phonological feature: START > SQUARE > CURE > NEAR > FORCE.Footnote 14
The second factor selected combines following context and word context. The environments that most favor (r-1) are word-final, prevocalic (winTER is), and word-final, prepausal (winTER). Both morpheme-final but word-internal (winTERs), and morpheme-internal (blizzARd) favor (r-0), as was reported for New York City (NYC) in Labov (Reference Labov1972:66). Leaving aside the much higher rate for the word-final environments that precede a vowel-initial word (the linking context), there is little difference across the contexts.Footnote 15 Finally, lexical frequency plays a small role, with rarer words favoring (r-1) and more common words disfavoring (r-1).
Summary
The patterning of social factors described in the previous section established that (r) is undergoing change in ENE and that it is a change from above: (r-1) occurs more among younger speakers, and, based on the linguistic marketplace results, (r-1) has prestige. However, Table 8 shows that small interactions exist, and these are due to different patterns in different communities. We therefore examine each community separately. The analysis of each community reveals that the same pattern of constraints is being reproduced between older and younger generations of Bostonians, whereas a different pattern of constraints operates in NH. In the following section, we interpret our results in terms of Labov's (Reference Labov2007) transmission/diffusion model.
SIMILARITIES AND DIFFERENCES WITHIN NEW ENGLAND
We next discuss the separate Goldvarb runs for each of the three communities: White Boston, African American Boston, and NH. The results of the six separate step-up/step-down analyses (three communities × two age groups) are in Appendix B. Comparison of older to younger speakers shows that within each community, the rate of (r-1) is increasing. But these analyses also reveal that the change is progressing differently in each community. Labov's (Reference Labov2007) model distinguishes two types of linguistic change, transmission and diffusion, defined thus: “The transmission of linguistic change within a speech community is characterized by incrementation within a faithfully reproduced pattern characteristic of the family tree model, while diffusion across communities shows weakening of the original pattern and a loss of structural features” (Labov, Reference Labov2007:344). We can use three lines of evidence (Poplack & Tagliamonte, Reference Poplack and Tagliamonte2001:92) to determine what kind of change is going on in Boston and in NH by asking:
1. How many of the same factor groups are significant between the two varieties?
2. Within each factor group that is significant in both varieties, how similarly are the factors ranked?
3. How are the factor groups arranged, in terms of their magnitude of effect, as determined by comparing their ranges?
We will first interpret these lines of evidence as others have done, impressionistically; at the end of this section, we will propose a way of operationalizing this approach to quantify how much one variety differs from another. It is important to note that we base our findings only on constraints that are known not to have a universally consistent effect (see discussion comparing other studies of (r)). We exclude, for example, the effect of stressed versus unstressed schwa as it behaves the same (stressed schwa favors (r-1)) in all reports on (r), and, therefore, similarities in its behavior cannot be taken as evidence of contact-induced change.
Using these three lines of evidence, we show that the change in Boston is an instance of transmission: younger Bostonians are faithfully reproducing the pattern of constraints used by older speakers, and they are strengthening the Boston pattern—despite the fact that (r-1) overall is increasing in Boston. In NH, on the other hand, we will show that younger speakers are using a simpler set of constraints than are older speakers; furthermore, the population changes in NH make the situation in NH more complex. We will therefore interpret the change in NH as diffusion, accompanied by divergence (Niedzielski & Giles, Reference Niedzielski, Giles, Goebl, Nelde, Stary and Wölck1996).
Boston
To examine the age effect in Boston, we divide the speakers into two groups: older (>35 years) and younger (<35 years). The reason we choose this particular division will become clear when we look at the NH speakers. Notice first that the overall rates of (r-1) differ between the two groups: 33% (r-1) for the older speakers versus 54% (r-1) for younger (see Appendix B). When we turn to comparison of the linguistic constraints between the two age groups of Bostonians, we see that the same factor groups are selected as significant for both the older and younger groups. Furthermore, these factor groups are ranked in the same order for both older and younger speakers: word context > preceding vowel > lexical frequency. Additionally, two of the three social factor groups are the same for both groups: linguistic marketplace > sex. These similarities between the older and younger Bostonians suggest transmission of the (r) pattern within Boston. These facts exemplify incrementation: the younger speakers are faithfully reproducing and strengthening the patterns of the older generation.
Among the Boston African Americans, there is a smaller increase in (r-1) in apparent time: 34% for older versus 48% for younger: this incrementation, along with a fair degree of consistency in patterns between the two age groups gives support for transmission in this community, just as in the Boston White community. The smaller increase in (r-1) indicates that the African American variety is the most conservative of the three we examine.
Next, we compare African Americans and Whites in Boston. Lexical frequency is significant in both younger groups in Boston but has little or no effect in the older groups. The other two linguistic factor groups are ranked differently between Whites and African Americans, but consistently across the two age groups in each community. Within these two factor groups, the factors again are similarly ordered. We note that for the young African Americans, however, unlike any of the other groups, preceding vowel is the strongest factor group.
New Hampshire
The division of speakers into older and younger speakers at age 35 distinguishes those who acquired language before the period of great migration from MA to NH approximately 40 years ago from those who were born after it (see Table 1). As in Boston, age is a significant factor in the NH analysis, with younger speakers consistently showing more (r-1): 75% (r-1) for the older speakers and 95% (r-1) for younger speakers. For the linguistic constraints, we see that the same factor groups are selected as significant between the Boston speakers (old and young) and the NH speakers (old and young). The significance of the factor groups, therefore, does not distinguish NH from Boston. But when we turn to the magnitude of effect of these factor groups, we see that younger NH (lexical frequency > word context > preceding vowel) is completely different from older Boston (word context > preceding vowel > lexical frequency). Note that we see a more similar pattern between the Boston Whites and the older NH speakers.
In each community, a striking change has taken place in the effect of the preceding vowel on (r). In the older communities, a preceding stressed schwa (FUR) is the most favoring context for (r-1). This is not true for any of the younger groups, where the preceding vowels (START) and (CURE) both outrank stressed schwa in favoring (r-1) (but stressed schwa still far outranks unstressed schwa).
Such differences between the older speakers and the younger ones in NH indicate simplification of the system, a trademark of diffusion. Simultaneous with the simplification of relevant factors, we see a much higher rate of (r-1) in NH than Boston, up to an input value of .97 for the younger speakers (and .77 for the older). As the pattern diffuses, its structural features simplify, and the younger NH speakers—who are 95% r-ful—may soon show no constraining effects on (r) at all (see Figure 4).
Considering the speakers by region and age simultaneously, we see that (r) presents yet another case in which young NH speakers are moving quickly to differentiate themselves from MA speakers (as with the vowel mergers explored in Nagy, Reference Nagy2001, and Wood, Reference Wood2010). The young NH speakers outdo all the others in rate of (r-1) usage.
We also see differences between older Boston speakers and NH, especially younger NH speakers, in the effects of social factors. Although some effect differences may just be due to differing distributions of speakers in the different “cells” for the social factors in each community, one effect is worth further discussion. Recall that speakers with jobs associated with higher linguistic market positions and those with more education have more (r-1), suggesting that (r-1) is a prestige variant, in the overall analysis (Table 8B). This is the pattern generally observed for stable alternations with a prestige form, or for changes from above. Given that a context of change rather than stability has already been established, the increasing use of (r-1) must therefore be a change from above.
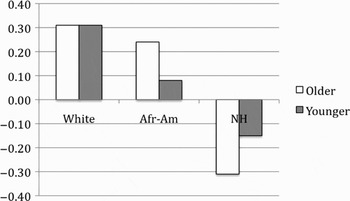
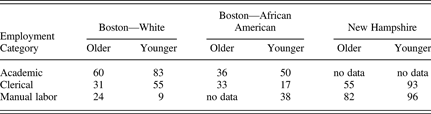
But there are also important differences between NH and Boston in the effect of linguistic marketplace, as Figure 5 illustrates. Figure 5 indicates the range, or size of effect, of the linguistic marketplace factor group (percent (r-1) is given in Table 9). For Boston, each value shown is the difference between academics and manual workers in that community (except among older African Americans, where clerical must substitute for manual, due to the lack of manual laborers in our sample of that group). Given the lack of academic speakers in the NH sample, we show the difference between clerical and manual there. (We might guess that the size of the effect is thus underrepresented in the NH sample.)
Factor weight ranges for linguistic marketplace (N = 11,147). (For Boston, each value shown is the difference in factor weight between academics and manual workers in that community; for NH, the difference is between clerical and manual.)

Goldvarb analysis of all speakers: Significant linguistic factors

Application value: (r-1); N: 11,147; Input: .53.
aWe illustrate the quality of the vowel using Wells's lexical sets, adding FUR to indicate stressed schwa (or schwa in a monosyllabic word) in contrast to LETTER for unstressed schwa.
Effect of linguistic marketplace on % (r-1) (N = 11,147)
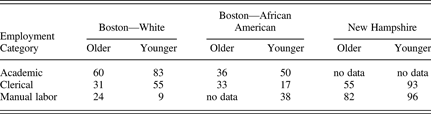
This graph reveals that in Boston, among both younger and older speakers, and within the White and African American communities, there is a consistent linguistic marketplace pattern. The positive values for all the Boston groups indicate a direct correlation between linguistic marketplace and (r-1) usage, whereas the negative values in NH indicate an inverse correlation.
Thus we can say that (r-1) is prestigious in MA, in both ethnic groups, even though it is not widely used. In contrast, there is no evidence that (r-1) is prestigious in NH, perhaps because it is so widely used. The inverse linguistic marketplace effect in NH is consistent with our proposal that NH speakers, especially younger ones, are making efforts to distinguish themselves from Bostonians: (r-0), a stereotype of Boston speech, is being left behind quickly by all groups in NH—not just those for whom “proper” speech matters. Before so many Bostonians moved to NH (cf. Table 1), and before (r-1) became so widespread in NH, (r-1) may well have held prestige. The former prestige of (r-1) in NH is hinted at by the difference in effect size between the two age groups in NH. Thus, this social factor illustrates one more way in which NH's (r) is diverging from Boston's.
TRANSMISSION IN BOSTON AND DIFFUSION IN NH
If we assume that the change to more (r-1) is spreading from Boston to these two smaller NH towns—following the predictions of Trudgill's (Reference Trudgill1974) gravity model—how is change spreading from Boston to NH? Precisely what kind of variable rule is spreading? Before we can account for the way in which the change toward greater rhoticity is happening, we must first determine whether the variable presence of r is due to a deletion process or an insertion process. In other words, we must answer our second question: What kind of variable rule is spreading? It may be that the phonological process that is spreading from Boston to NH is a deletion rule (informally: [r] → Ø), and this rule is applying less and less, resulting in more (r-1). Or it may be that an insertion rule (Ø → [r]) is spreading from Boston to NH, with the rule being applied more and more, again resulting in more (r-1).Footnote 16
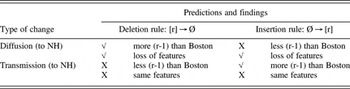
Given the two processes of transmission and diffusion and two possible rules, we must consider four possible options. Table 10 shows the predictions associated with each rule and each type of change. Patterns preceded by a check mark are found in our data, while X indicates that the pattern is not found). As we have seen (in Figure 4 and Table 8), NH has higher rates of (r-1) than Boston does, and younger NH speakers have especially higher rates. This increase in (r-1) could be accounted for by either the diffusion of a deletion rule (resulting in a decrease in application rate and thus more (r-1)), or the transmission of an insertion rule (with concomitant increase in application rate and thus more (r-1)). In the remainder of this section, we compare the effects of the linguistic and social factor groups in the data from the two states, showing that a smaller (simpler) set of constraints accounts for the data in NH as compared to data for Boston. This finding supports the diffusion analysis. New Hampshire's system for (r) is not only different from Boston's, but simpler. Thus we conclude that diffusion of a deletion rule from Boston to NH is the scenario best supported by our data.
Predicted effects in NH of four possible diffusion/transmission accounts

However, an important wrinkle must be considered. We have diffusion of a deletion rule into a community that had already been (at least variably) nonrhotic. We now step into territory that was not explored in Labov (Reference Labov2007): a situation in which speakers move into a region that already has a similar rule. In this situation, the weakening predicted by diffusion is the following: the r → Ø rule applies at a lower rate with each successive generation. As the rule gets weaker in its diffused state in NH, its effect is to make the community more rhotic.
Furthermore, this is a context where friction between the newcomers and those already present reveals itself in a variety of nonlinguistic and linguistic ways. At this point, an element of accommodation theory is usefully added to the diffusion/transmission model to create a paradigm that attends to “social consequences [including] attitudinal [and] behavioral” and “individual life span and group-language shifts” (Giles, Coupland, & Coupland, 1991:4, cited in Niedzielski & Giles, Reference Niedzielski, Giles, Goebl, Nelde, Stary and Wölck1996). Of particular relevance here is the concept of divergence: Niedzielski & Giles (Reference Niedzielski, Giles, Goebl, Nelde, Stary and Wölck1996:336) provided examples of speakers who diverge from a group that they dislike or disapprove of, much as is happening in NH.
We thus interpret this situation as divergence from Boston speech by New Hampshirites rather than accommodation by the New Hampshirites to the many rhotic incomers from other places. This interpretation accounts for the changing pattern of constraints on variable (r) (in addition to being supported by the MA-to-NH relocation facts). If New Hampshirites were simply accommodating to r-ful newcomers, we would expect increasingly more (r-1) in all contexts and consistent constraint effects. Although we find more (r-1) in all contexts, we find differing constraint effects when we compare older and younger speakers. In an accommodation analysis, nothing from a fully rhotic dialect should influence the linguistic or social constraints that affect the variation because, by definition, there would be no variation in that dialect. So the accommodation model leads us to expect the NH speakers to maintain exactly the same constraint effects before and after the large influx of newcomers. We show that the accommodation model alone cannot account for the NH data: NH speakers, and especially those born after the large influx of incomers in the 1970s, have different patterns of constraints operating on (r) than Boston speakers do.
Quantifying transmission and diffusion
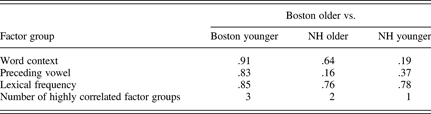
We have argued that the change in Boston is transmission and that the change in NH is diffusion. But these conclusions were based on subjective decisions on “how similar” the constraint rankings, given in Appendix B, appear to be. How can we say definitively that the constraint hierarchies are different enough between two generations that the data fit a diffusion analysis rather than a transmission analysis? Building on ideas introduced in Meyerhoff (Reference Meyerhoff2009) and Buchstaller and D'Arcy (Reference Buchstaller and D'Arcy2009), we suggest a way of quantifying the three lines of evidence that we use to draw our conclusions on the type of change in Boston and NH. In essence, we would like to have a way of quantifying how much change there has been between two generations of speakers, and then compare that difference across communities. The goal of the calculations we show is to work toward defining a numerical threshold such that a measure of similarity between constraint hierarchies above that threshold indicates transmission, and a measure below that threshold indicates diffusion. We need a calculation to tell us how much the younger Bostonian pattern and the younger New Hampshirite pattern differs from the older Bostonian pattern. We also include calculations of the similarity of the older New Hampshirite pattern to the older Bostonian, showing them to be in an intermediate position.
Recall that the first line of evidence used to determine similarity between two varieties (age groups, for our data here) is whether the two varieties have the same significant factors. In our data, this is straightforward: the same linguistic factors are significant in all four communities (older Boston, younger Boston, older NH, younger NH). However, if they were not, we could calculate the number of significant factors that are the same, and divide by the number of factors considered. This gives a ratio between 0 and 1 for each speaker group. In this case, the value is 1 across all the varieties.
Our second line of evidence looks at the order of the significant factors and asks how similar the orders are between the two age groups. Here, we calculated Pearson's r, a correlation coefficient, between the factor weights of the older Bostonians and each of the other groups. The larger this number, the more similar the variety is to the older Bostonians' variety. Table 11 shows this calculation and illustrates much less similarity for both NH groups than within Boston. We can simplify each vector by reporting the number of highly correlated factor groups for each community, with “highly correlated” defined as Pearson's r >.5 (Cohen, Reference Cohen1988:83).
Correlation of the order of factors in each group (Pearson's r)
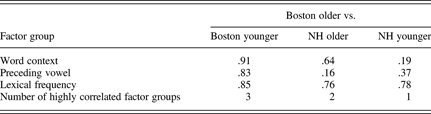
Our third line of evidence looks at the order of the factor groups by their magnitude of effect. Here we look at the correlation of the ordering of the factor groups between the two age groups when they are listed from highest to lowest magnitude of effect (determined by the range of factor weights within each factor group), again using Pearson's r. This calculation gives a value between –1 and 1, with a larger, positive number indicating more similarity between the varieties.
Although the correlation between older and younger speakers in Boston is complete (r = 1), it is entirely reversed in NH (r = –1). If we compare the older Boston to the older NH speakers, we see an intermediary stage in the diffusion process: The older New Hampshirites have begun to lose the constraint ranking of the older Bostonians, but have not gone as far as the younger NH speakers (r = .5).
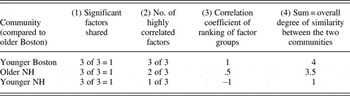
Table 12 summarizes this attempt to quantify the amount of change in order to support a reproducible means of distinguishing transmission from diffusion. This table shows our operationalization of each line of evidence with respect to each community in comparison to the older Bostonians.
Quantification of the amount of change between older Bostonians and three other groups (linguistic constraints)

Column (1) of Table 12 shows that the number of identical (significant) factors shared between the older Bostonians and each of the other three groups is the same. In column (2), we see that the number of highly correlated (r > .5) factors decreases from younger Bostonians, who have the highest number of highly correlated factors when compared to the older Bostonians, down to the younger New Hampshirites, who have only one highly correlated factor in common with the older Bostonians. In column (3), we also see a decreasing degree of correlation with the older Bostonians. The correlation of the constraint hierarchy between the older and younger Bostonians is a perfect positive one (1.0). Both groups have the order word context > preceding vowel > lexical frequency. There is a strong (r = .5) correlation between the constraint order of the older Bostonians and that of the older New Hampshirites. When we compare the older Bostonians to the younger New Hampshirites, we see a completely different order (lexical frequency > preceding vowel > word context), resulting in an inverse correlation (r = –1.0). For further details, see Appendix B.Footnote 17
Finally, we sum these three measures for an aggregate measure of the amount of difference between the older Boston group and each of the other three groups. Remember that the goal of these calculations is to determine a threshold such that quantities of change above this threshold may be interpreted as diffusion, and those below as transmission. The data presented here would lead us toward determining that this threshold must have a value somewhere between 1 and 4 in order to say that transmission has occurred in Boston but diffusion in New Hampshire. Further refinements are clearly necessary to take into account the number of factors and factor groups considered. Such refinements will rely on analyses of other data sets.
Summary: transmission, diffusion, and divergence
To summarize, the age comparisons show a change progressing rapidly. This change in progress can be neatly described as transmission (as defined in Labov, Reference Labov2007) within Boston, where both White and African American Bostonians show a similar set of constraint effects and an incrementation in the rate of (r-1) across age groups. Comparing Boston to NH, on the other hand, we see evidence for diffusion. Not only are the New Hampshirites dropping r less frequently than the Bostonians, but they are also distancing themselves in terms of the system that describes the conditioning factors for (r). The interpretation of the pattern of usage in NH being a result of diffusion is in keeping with the discussion of (r) as a change from above, which would be incongruent with a transmission account (Labov, Reference Labov2007:346).
Diffusion makes sense given the migration patterns that we have discussed: Bostonians and others have been coming to settle in NH since 1641, but the number of relocators increased greatly in the 1970s. It is not surprising that the seeds of a rhotic dialect, planted in the traditionally nonrhotic (or at least variably nonrhotic) region of ENE, are spreading through the community. However, we account for the increasing rhoticity of NH not through accommodation to the rhotic newcomers (of non-Massachusetts origin), but through divergence from the less rhotic neighbors in Massachusetts.
A COMPARISON OF STUDIES OF (r) IN NORTH AMERICAN ENGLISH
In order to describe changes as being due to contact with another variety, one must show that the changes are not of a universal nature. Here, we must understand which similarities between different groups of speakers' patterns for (r) are universal and which are dialect-specific. Only similarities that are not universal can be called upon as evidence of the influence of one dialect on another. Our next step is to disentangle what is true of (r) just in ENE versus what is more generally (and possibly universally) true about (r). For this purpose, we turn to a comparison of variationist studies of (r) across the United States that are methodologically comparable to our own.
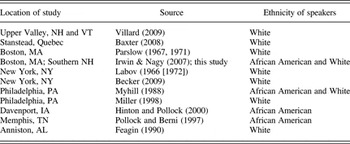
Certain factors have repeatedly emerged as relevant to all (r) variation studies, whereas other factors play a role in only some communities. The principal aim of this section is to report on the relative universality of these different factors. Quantitative sociolinguistic studies that evaluate both internal (linguistic) and external (social and/or stylistic) factors that index (r) usage in the United States are listed in Table 13. Throughout this section, we refer to different studies by their geographic location and, where necessary for disambiguation, by year of publication. We do not discuss differences in the overall rate of (r-1), as this value can vary tremendously depending on what types of data are included in the analysis—and particularly depending on the style or formality of speech examined. Variation in methodology and style of speech elicited by each study make absolute comparisons of (r-1) rate across studies invalid. However, examination of the relative size of effect of independent variables is instructive, and we begin there. It should be noted that all communities except Philadelphia were examined at a time when they were undergoing a change toward increasing rhoticity. (White Philadelphia was and always has been rhotic.)
Quantitative studies of (r) in the United States (listed North to South)

Linguistic factors
Looking first at the internal factors, we see many similarities in the different systems examined. All of these studies (except NYC 1966 and Upper Valley, which report only social factors) include preceding vowel, contrasting full versus schwa vowels and, usually, front versus back vowels. Most frequently, stressed schwa is the most favoring context for (r-1). This is the case for NYC 2009, Memphis, Philadelphia, Stanstead,Footnote 18 Anniston, and Boston 1967, as well as for older speakers in Boston 2007, but not for Davenport (where no significant effect of vowel quality is reported) or younger ENE speakers.Footnote 19 Similarity in the full vowel versus schwa effect may be taken as evidence of one dialect's influence on another as it is not a universal factor (as the change among our own younger speakers illustrates).
In contrast, stressed schwa favors (r-1) more than unstressed schwa in all studies, so this pattern should not be taken as evidence of one dialect's influence on another. The clear effect of stressed syllables favoring (r-1) may be readily explained by the greater articulatory effort and duration in stressed syllables. This is, in fact, the only universal effect we find, and thus we exclude the relevant factors from our calculation of the degree of similarity across varieties in the preceding section.
A less consistent pattern is the relative favoring effect of schwa versus full (front and back) vowels. Full vowels favor (r-1) more than unstressed schwa vowels in Anniston. Full vowels rank between stressed and unstressed central vowels in Memphis, Stanstead, and Philadelphia, but no complete generalization is possible for Boston and NH 2007. Back vowels favor (r-1) more than front vowels in Stanstead and NYC, though front vowels favor (r-1) more than back vowels in Anniston and Memphis. NYC 1966 is not directly comparable for this factor since Labov (Reference Labov1972) judged schwa to be in a different class in NYC English; he “specifically excluded from the variable […] cases where /r/ follows a mid-central vowel, as in her and bird. These two subclasses have different histories and behavior in New York City as in most r-less dialects” (Labov, Reference Labov1972:73). Because of the lack of universality in order of effect of the different vowel types, this factor may fruitfully be used to test for influence of one dialect on another.
The position of the (r) with respect to syllable, word, and morpheme boundaries, first examined in Labov's “fourth floor” department store study, was also examined in Boston, NH, NYC, Stanstead and Philadelphia 1988. Word-final position favored (r-1) more than word-internal in NYC 1966 and Stanstead, but no generalization is possible for Boston, NH, NYC 2006, or Philadelphia 1988. Thus, this is another factor that may be used to diagnose contact effects, because it operates differently in different communities.
The effect of the following segment has been proposed as a factor with categorical effects, particularly in the linking context. Feagin (Reference Feagin, Edmondson, Feagin and Mülhäusler1990), for example, did not include this factor in Anniston because she perceived linking r to be categorical; linking r is also considered categorical in Received Pronunciation. Perhaps because of this assumption, the linking environment has not been included in many studies of (r). Our study, however, shows that linking r is not categorical. In spite of numerous proposals of phonological processes or constraints that cause an intervocalic [r] to syllabify in the onset of the following syllable and thus be “protected” from deletion, deletion is not categorically prohibited in such contexts. Nevertheless, a following vowel does strongly favor (r-1). Following consonants disfavor (r-1) in NYC, Boston 2007, NH, and Stanstead.Footnote 20 Following pause does not have a consistent effect. In contrast to all other reports on this variable, the Philadelphia 1988 study found that a following pause favors deletion, and the NH sample shows no effect among younger speakers. Philadelphia is the only community in which (r) is not a change in progress, and in NH, this change is nearly complete. A relatively high rate of (r-1) prepausally may indicate that the change is nearing completion.
The two Philadelphia studies found a dissimilatory effect: (r) surfaced as (r-1) less frequently when there was another /r/ in the same word. This effect was sought in our study but not found; (r) dissimilation effects have not been not reported in other studies of American English. Mompean and Mompean (Reference Mompean and Mompean2007:1399), however, found a significant effect in a similar variable in a British English corpus: linking r appears less often in the coda of syllables with an onset /r/ than in other syllables. Dissimilation is one more factor that could be used to test for dialect contact effects.
To summarize, only one component of the preceding vowel constraint appears to apply the same way in all dialects: the favoring of (r-1) after stressed schwa more than after unstressed schwa. This is in stark contrast to the relative ordering of the effect of other (full) vowels in preceding position, which are ranked in different orders in each community we studied. The following segment constraint is universal in that following vowels (the linking r context) favor (r-1) more than following consonants or pause, except in the two almost fully rhotic communities of Philadelphia and younger NH. All the other factors have varying effects and thus can be used as measures of similarity between one dialect and another.
Social factors
Turning now to external factors, we see that age, social class, and style virtually always have an effect on (r), though the effects are not consistent across studies. In New England, NYC, Boston, NH, and Anniston, younger speakers produce more (r-1) than older speakers do. In NYC 1966, age is relevant in that (r-1) is a prestige variant for speakers under 40 years of age (Labov, Reference Labov1972:116). In Philadelphia 1988, the oldest speakers had the most (r-1), and in Philadelphia 1998, the middle age group had the most (r-1). In Davenport and Memphis, age is not a significant factor.
In Anniston, Stanstead, and both NYC studies, females favor (r-1) over males, but the effects are not large. In New England, the effect of speaker sex differs depending on age, location, and ethnicity. Females are more rhotic in NH and among African American Bostonians, and males are more rhotic among White Bostonians, but the sex differences are not significant in the younger African American and NH groups. Parslow (Reference Parslow1967) included equal numbers of males and females in his study but did not pursue sex as a social variable.Footnote 21
Class is calculated by various measures of occupation, income, and education, and is reported to correlate positively with (r-1) in Boston 2007, the Upper Valley, Stanstead, and both NYC studies, but inversely in NH and Anniston. (We have reported linguistic marketplace factors in the analyses given, but the same pattern is found when social class, determined by salary, is included instead.)
Comparing the systems of White and African American speakers living in the same cities does not reveal any consistent effect of ethnicity. Whites favor (r-1) more than African Americans in NYC 1966. African Americans use (slightly) more (r-1) than Whites in Philadelphia 1998. There is no significant difference in Philadelphia 1988 and very little in Boston.
Finally, there is surprisingly little data available about the effect of style, given the clear effect of this factor in Labov's (1972:chapter 3 and p. 114) original NYC study of (r). Style has a consistent effect in both NYC studies, where different speech styles were contrasted: more (r-1) in more formal styles. In addition to finding style-based variation in the traditional Labovian way (by comparing (r) in spontaneous speech versus spoken word lists), Becker's (2009) NYC study found topic-based variation within the sociolinguistic interview such that informants used more (r-0) when talking about the local neighborhood than they did when speaking about other topics (Becker, Reference Becker2009:649–653). In contrast, an effect of style is sought but not found in Davenport and Memphis. Data on this factor are not reported for the other studies. We hope that future examination of data from more spontaneous elicitation styles will be able to proceed more efficiently because the effects of the various interacting factors have been sorted out through the present study of a controlled reading passage.
In the studies summarized, we see nothing even approaching a universal truth about the effects of social factors. This might be because the different communities have been at different stages of the change when they were investigated or because of differences in perceived prestige. Or, it may be due to a variety of methodological differences, both in terms of formation of the sample and the linguistic tasks recorded. Villard's (2009) Upper Valley study replicated the methodology of the study reported here, using the same reading passage and techniques, in a geographically and close community, and at a similar time. There are no inconsistencies in factor effects between her study and our own, highlighting the benefit of consistent methodology. In our own research, which maintains methodological integrity while studying three geographic locations and two ethnic groups, we find a range of factor effects. Thus, we cannot attribute the lack of consistent effects entirely to methodological issues, but must assume that few factors have universal effects on (r).
The factors that have not been shown to have the same effect in all communities in which they have been examined are powerful tools, in that they may be used to study the influence of one dialect on another. In contrast, a factor with a universal effect, even if seen in two communities, cannot be claimed to have been transferred from one to the other.
SUMMARY AND DISCUSSION
This paper has provided a comprehensive overview of (r) in American English, relating diachronic, areal, attitudinal, social, and perceptual facts. We began by describing the general pattern of (r) in ENE: A change is in progress toward greater use of (r-1), and the linguistic constraints that most contribute to the distribution are word context, preceding vowel, and lexical frequency, in that order. We saw, however, that there are large differences in the behavior of (r-1) between the different communities and especially between older and younger speakers.
These differences, coupled with our review of the settlement patterns and attitudes of one group toward another, suggest a useful ground to test Labov's transmission/diffusion model. We find that, as expected given the settlement and attitude patterns, (r) has been reasonably faithfully transmitted from one generation to the next in Boston, but its pattern differs considerably in NH between the older and younger speakers. We proposed a method of quantifying the “three lines of evidence” in order to provide a reproducible method of supporting such claims. This method indeed supports our expectation: There is little difference between older and younger Bostonians (see Table 12), more when we compare older Bostonians and older New Hampshirites, and the largest difference when we compare older Bostonians to younger New Hampshirites, the site where diffusion has played out. All of these interpretations importantly rely on being able to distinguish factors that can have different effects (and therefore can be transferred) from those that exhibit a universal effect, as the latter must not be called in as evidence for dialect contact. Bringing together these strands of our investigation, we see evidence for transmission within Boston and diffusion to New Hampshire, interpreted via the lens of accommodation theory.
APPENDIX A: READING PASSAGE
Each instance of (r) that we analyzed is in the word following the corresponding number. Two numbers separated by a comma indicate that two tokens appear in the following word. The quoted passage is adapted from Urbanek (Reference Urbanek2003) and the list from Spina (Reference Spina2005).
How to survive a New England winter
People who 1are new to New England often worry about how to get through New England's 2fierce 3winters. Although 4our 5winters might 6appear to be unpleasant, New 7Englanders have many ways of keeping 8warm. When asked the question, “How do you make it through the 9winter up 10there?” many natives 11assure 12newcomers not to 13fear that they will be cold or 14bored. In fact, snow is 15part of the 16allure of New England, and many of us enjoy skiing and 17participating in many 18other 19winter 20sports and {21outdoor games/rituals}. Most tourists only come to the 22northeast in the 23summer 23.2or the fall—often 23.3for weddings, since couples like to get married near the beach 23.4or in the fall foliage (and this 23.5commerce helps 23.6our economy very much). But New England does not shut down in the 24wintertime! But every few 25years, a 26blizzard takes 27over. The 28worst 29storm in recent history is the “30Blizzard of '78,” a 31snowstorm which brought in three to 32four feet of snow. The following 33words 34are from a Web posting by Mary U. of 35North 36Dartmouth, Massachusetts:
It 37started out like any 38other 39snowstorm that I 40remember. The dainty flakes 41were descending slowly from the 42dark gray sky as if to show the 43world that the 44storm could not be rushed. I was 45fourteen 46years old. It was actually 46.2calmer than it usually was 46.3before a 46.4storm. The 47first snowflakes 48swirled lightly around the 49dark street. It didn't 50scare me at all, of 51course—I just 52wondered, Will this 53storm be 54worthy of a school cancellation? As it 55turned out, it 56sure wasn't anything 57near to being 58your typical 59snowstorm! This was the 60Blizzard of '78. In only a few 61hours, the flakes grew increasingly 62,63larger. My 64father told me and my friend to go to the 65market to 66purchase the usual 67required stuff to 68prepare 69for the 70storm: milk, bread, and peanut 71butter (because my 72dear little 73brother 74adored it so much). Mom didn't want to take the 75car 76herself because she had a good 77parking space and the 78,79carburetor was having problems. Anyway, she told us to take 80care but 81assured us that we would be ok. It was fun at 82first and I had no 83fear, especially since we knew 84our way 85there. But the snow got 86,87harder and 88,89harder, and seeing 90our path through the snow-91covered sidewalk was 91.2rather difficult as 92our vision became 93impaired and the wind made 94tears well up in 95our eyes. The wind was 96fierce, and as the 97glare got 98worse, 99our vision was even 100more 101obscured, and all I could see was 102pure whiteness. I 103remember thinking, “This 104sure is a 105,106hardcore 107blizzard!” 108Over the 109course of the next few days 110after the 111storm, 112there was no 113power in the area unless you 114were 115fortunate enough to own a116generator, so my 117elderly 118grandfather stayed with us. The 119warmth and light of the 120fireplace 121sure made 122our home feel cozy. Of 123course, outside, the view was 124gorgeous, a magical 125garden of snow. With no electricity, I felt like Mary Ingalls, the 126pioneer 127girl. Because we had no electricity, if we wanted to take a bath, we had to heat the 127.2water in the 127.3fireplace, and my 128brother, 129sisters, and I 129.2were 130forced to rely on old-fashioned kinds of 131entertainment—we had a merry time playing 132cards and read the comics in the 133newspaper. I 134sure can't 135compare this experience to any 136other. I 137learned a lot from the 138sheer simplicity of life during that week. In a way, the 139storm really brought my family 140together.
But what 141words of advice do 142New Englanders give to 143newcomers to the 144northeast? 145Consider the following tips from Peter Rizzo. 146Peter is a longtime resident of the 147Watertown area.
Peter's tips for surviving a New England winter
1. To 148prepare 149for the cold and keep 150warm, 151wear 152nearly everything in two: two 153pairs of pants, two 154pairs of socks, two 155scarves, two hats—everything in a 156pair.
2. If 157you're a 158commuter who uses the MBTA, stay calm but leave an 159hour, maybe 160more, 161,162earlier than 163normal.
3. {164Wear really} bright-165colored clothes. They'll help you feel summery and 166forget the 167dark 168winter.
4. Throw a 169party. Get some 170beer, 171wear 172summer clothes, and whip out the 173barbecue, just like it was 174summer.
5. If you 175are of drinking age, go to a 176nearby 177neighborhood 178bar. My 179,180bartender makes drinks extra strong 181over the cold months. Even if you don't drink, 182bars can be 183cheerful, merry places 184for 185warm 186conversation and fun.
6. Take a hot bath, then put on a 186.2warm robe and sit some 187chairs around the 188fireplace and relax with hot cocoa.
7. Play 189summertime 190sports like baseball and 191soccer. It sounds like {192sheer craziness/recklessness}, but it really is possible, and the 193exercise will keep you 194warm.
8. 195Compared to 196other places, New England isn't that bad! During 197Arctic and 198Antarctic 199winters, you and the 200polar 201bears live in 202pure 203darkness for six months in a row!
APPENDIX B: MULTIVARIATE ANALYSES FOR 3 COMMUNITIES
Note: Application value is (r-1). For ease of comparison, all factors are listed in their decreasing order of magnitude for the older Whites in the Boston analysis. Input value, percentage of (r-1), and total (n) for each analysis is given at the top of each group's section of the table. Square brackets around factor weights (FWs) indicate that that factor group was not selected as significant by Goldvarb's step-up/step-down procedure, for that community. (Because of our method of comparing the amount of change between older and younger groups, we present analyses with the same factors included for each group of speakers. These provide the most parsimonious model for our comparator, the older Boston White group, but not necessarily for the other communities.)