


For many older adults, driving is a symbol of independence, freedom, and power and has been linked to a sense of personal identity, control over one’s life, and belonging to a larger community (Gardezi et al., Reference Gardezi, Wilson, Man-Son-Hing, Marshall, Molnar and Dobbs2006). As a result of these strong emotional ties to driving, many older drivers strive to stay on the road as long as possible (Rudman, Friedland, Chipman, & Sciortino, Reference Rudman, Friedland, Chipman and Sciortino2006). However, declines in physical and cognitive health associated with aging and age-related diseases put older drivers at risk for unsafe driving practices and outcomes (e.g., Anstey, Wood, Lord, & Walker, Reference Anstey, Wood, Lord and Walker2005; Dobbs, Reference Dobbs2002).
Many older adults are open to changing their driving under certain circumstances (Kostyniuk & Shope, Reference Kostyniuk and Shope1998; Tuokko, McGee, & Rhodes, Reference Tuokko, McGee and Rhodes2006) and do voluntarily modify their own driving behaviours to remain comfortable on the road (Baldock, Mathias, McLean, & Berndt, Reference Baldock, Mathias, McLean and Berndt2006; Betz & Lowenstein, Reference Betz and Lowenstein2010; Donorfio, D’Ambrosio, Coughlin, & Mohyde, Reference Donorfio, D’Ambrosio, Coughlin and Mohyde2008; Hakamies-Blomqvist & Wahlstrom, Reference Hakamies-Blomqvist and Wahlstrom1998; Myers, Paradis, & Blanchard, Reference Myers, Paradis and Blanchard2008). The concept of driver self-regulation, and the ability to evaluate one’s own functional abilities and adjust behaviour accordingly (Baldock et al., Reference Baldock, Mathias, McLean and Berndt2006), is one that is substantially demonstrated in the literature (Baldock et al., Reference Baldock, Mathias, McLean and Berndt2006; Betz & Lowenstein, Reference Betz and Lowenstein2010; Donorfio et al., Reference Donorfio, D’Ambrosio, Coughlin and Mohyde2008; Hakamies-Blomqvist & Wahlstrom, Reference Hakamies-Blomqvist and Wahlstrom1998; Ruechel & Mann, Reference Ruechel and Mann2005). Some studies suggest that older adults appear to strategically adapt their driving patterns (i.e., avoiding driving at night and in bad weather, changing routes to avoid traffic), speed (i.e., lowering speed), and maneuvers (i.e., avoiding parallel parking) to compensate for declines in function associated with aging (Baldock, Reference Baldock2004; Ruechel & Mann, Reference Ruechel and Mann2005). These types of self-regulatory practices appear to increase with age (D’Ambrosio, Donorfio, Coughlin, Mohyde, & Meyer, Reference D’Ambrosio, Donorfio, Coughlin, Mohyde and Meyer2008; Donorfio et al., Reference Donorfio, D’Ambrosio, Coughlin and Mohyde2008), particularly by women (D’Ambrosio et al., Reference D’Ambrosio, Donorfio, Coughlin, Mohyde and Meyer2008; Gwyther & Holland, Reference Gwyther and Holland2012; Molnar & Eby, Reference Molnar and Eby2008; Turano et al., Reference Turano, Munoz, Hassan, Duncan, Gower and Roche2009). Other documented factors influencing driving patterns include lifestyle (e.g., household income, retirement status, presence of other drivers in the household, need to drive), involvement in crashes, and attitudes and perceptions (i.e., comfort) of driving (Charlton et al., Reference Charlton, Oxley, Fildes, Oxley, Newstead and Koppel2006; Ragland, Satariano, & MacLeod, Reference Ragland, Satariano and MacLeod2004; Myers et al., Reference Myers, Paradis and Blanchard2008; Tuokko et al., Reference Tuokko, McGee and Rhodes2006).
To understand what motivates changes in driving practices, more research is needed to better understand the psychological process underlying driving self-regulatory practices in older adulthood (Dickerson et al., Reference Dickerson, Molnar, Eby, Adler, Bédard and Berg-Weger2007). Specifically, attitudes and perceptions about driving have been shown to be related to older driver self-regulation (Jouk et al., Reference Jouk, Tuokko, Myers, Marshall, Man-Son-Hing and Porter2014; Lindstrom-Forneri, Tuokko, Garrett, & Molnar, Reference Lindstrom-Forneri, Tuokko, Garrett and Molnar2010; Lindstrom-Forneri, Tuokko, & Rhodes, Reference Lindstrom-Forneri, Tuokko and Rhodes2007; Myers et al., Reference Myers, Paradis and Blanchard2008; Rudman et al., Reference Rudman, Friedland, Chipman and Sciortino2006; Tuokko et al., Reference Tuokko, McGee and Rhodes2006) and, in fact, may influence driving practices more so than objective driving abilities (Baldock et al., Reference Baldock, Mathias, McLean and Berndt2006; Blanchard & Myers, Reference Blanchard and Myers2010; MacDonald, Myers, & Blanchard, Reference MacDonald, Myers and Blanchard2008). Baldock et al. (Reference Baldock, Mathias, McLean and Berndt2006) found that self-regulatory practices (reported avoidance) were not associated with scores of on-road driving performance. Rather, the most commonly avoided driving situations (parallel parking and driving on a rainy night) were associated with decreased driver confidence.
Further studies have shown that perceptions of driving comfort and abilities are related to both self-reported (MacDonald et al., Reference MacDonald, Myers and Blanchard2008; Myers et al., Reference Myers, Paradis and Blanchard2008) and objectively measured restricted driving practices in older drivers (Blanchard & Myers, Reference Blanchard and Myers2010; Myers, Trang, & Crizzle, Reference Myers, Trang and Crizzle2011). In addition to confidence/comfort and perceived driving ability, decisional balance – defined as the weighing of the pros and cons with respect to self and others – has also been strongly linked to older driver self-regulation. Tuokko et al. (Reference Tuokko, McGee and Rhodes2006) found that individuals who possessed more positive attitudes about how their driving impacts others (a subscale that we call Pro-other) were less likely to reportedly restrict their driving, whereas those who held more negative attitudes about their own driving (a subscale that we call Con-self) were more likely to report actively restricting their driving.
Recently, we examined the psychosocial constructs of comfort, perceived driving abilities, and decisional balance in relation to self-reported driving restrictions in terms of kilometers driven and frequency and avoidance of challenging driving situations in a cross-sectional examination of baseline data from 928 drivers, age 70 and older, participating in the Candrive II cohort study (Jouk et al., Reference Jouk, Tuokko, Myers, Marshall, Man-Son-Hing and Porter2014). Consistent with prior research (e.g., Tuokko et al., Reference Tuokko, McGee and Rhodes2006), we found perceptions and attitudes to be associated with driving exposure and patterns such that the more positive and comfortable older adults felt about driving and their driving abilities, the greater their self-reported driving exposure. Conversely, older adults who expressed more-negative views about driving, including feeling less comfortable behind the wheel, reported driving fewer kilometers per week, as well as lower frequency and greater avoidance of driving in challenging situations (Jouk et al., Reference Jouk, Tuokko, Myers, Marshall, Man-Son-Hing and Porter2014).
We sought to extend this work in order to examine whether changes in attitudes (i.e., decisional balance) and perceptions (i.e., comfort) were associated with changes in older adults’ reported driving restrictions (e.g., frequency of driving, avoiding challenging driving situations) and perceived driving abilities over two years. It was expected that individuals who continued to feel more comfortable with and held more positive views of their driving would show no driving restrictions or perceived declines in driving abilities over time compared to those who felt less comfortable and had developed more negative views of driving.
Methods
Participants
All participants (n = 928) were part of a nation-wide prospective driving study (Candrive II) and recruited from seven cities across four provinces (Ontario, Quebec, Manitoba, and British Columbia). Human research ethics boards from each participating institution granted ethical approval prior to starting the research protocol. For detailed information about the Candrive II study and its participants, please refer to Marshall et al. (Reference Marshall, Man-Son-Hing, Bédard, Charlton, Gagnon and Gélinas2013).
At baseline, participants ranged in age from 70 to 94 years (M = 76.21, SD = 4.85); 62 per cent (n = 577) were males. Almost half (45%) had completed some post-secondary education, 19 per cent had obtained a diploma or a trade/technical certificate beyond high school, 26 per cent completed high school, and 10 per cent did not continue beyond grade school.
The average attrition rate across the three waves of data collection was only 6 per cent and therefore considered minimal. Selective attrition was examined by comparing baseline characteristics (Time 1; T1) of those who left the study one year later at T2 (n = 46, 5% attrition; 65% males) and two years later at T3 (n = 108, 12% attrition; 65% males) with those who continued. There were no significant differences in age, gender, or education at T2. However, those who dropped out at T3 were significantly older at baseline (M = 77.79, SD = 5.41) than participants who remained in the study (M = 76.01, SD = 4.74), t (926) = –3.39, p = 0.001.
Procedure
All participants provided written informed consent, including permission to access provincial driving records and to install an electronic recording device in their vehicles to monitor real-time driving patterns. Participants underwent annual comprehensive evaluations of their health status, functioning, driving habits, and intentions, which were completed by trained research assistants. Psychosocial scales (Situational Driving Frequency Scale, Situational Driving Avoidance Scale, Perceived Driving Abilities Scale, Driving Comfort Scales, and the Decisional Balance Plus scale) and measures of driving restrictions (described next) were completed at home and returned by mail. Research assistants also conducted follow-up assessments via telephone every four to eight months to determine if there were any changes in participants’ health status, medication regime, and driving patterns, as well as to see if they had endured any automotive collisions. See Marshall et al. (Reference Marshall, Man-Son-Hing, Bédard, Charlton, Gagnon and Gélinas2013) for detailed information outlining the procedures we followed for this study.
Measures
Driving Outcomes
Scores on the Situational Driving Frequency (SDF), Situational Driving Avoidance (SDA), and Perceived Driving Abilities (PDA) scales (MacDonald et al., Reference MacDonald, Myers and Blanchard2008) were used as outcome variables in the analyses. The SDF and SDA scales were developed for older adults to assess self-reported practices (frequency and avoidance respectively) concerning driving in challenging situations such as driving at night and on highways. On the 14-item SDF scale, respondents rated how frequently they engage in challenging driving situations on a 5-point scale ranging from “never” (coded as 0) to “very often” (coded as 4). Scores can range from 0–56, with higher scores indicating greater frequency of driving in challenging situations. On the 20-item SDA scale, participants were asked to check which challenging situations, if any, they try to avoid. Possible SDA scores range from 0 to 20, with higher scores indicating greater avoidance of challenging situations. Both the SDF and SDA scales have shown good test-retest reliability as indicated by intraclass correlation coefficients (ICC) of .89 and .86 respectively (Blanchard & Myers, Reference Blanchard and Myers2010; MacDonald et al., Reference MacDonald, Myers and Blanchard2008).
The 15-item PDA scale asks people to rate their current driving abilities (e.g., ability to see road signs at a distance, to see vehicles coming up alongside, or to make an over-the-shoulder check, ability to drive safely) on a 4-point scale as “poor” (coded as 0), “fair” (coded as 1), “good” (coded as 2), or “very good” (coded as 3) Scores can range from 0 to 45 with higher scores indicating more positive perceptions. The PDA scale has also been shown to have moderate test–retest reliability and good internal consistency as indicated by an ICC of .65 and α of .92 respectively (MacDonald et al., Reference MacDonald, Myers and Blanchard2008).
Psychosocial Variables
The Driving Comfort Scale (DCS; Myers et al., Reference Myers, Paradis and Blanchard2008) and the Decisional Balance Plus (DBP) scale (Lindstrom-Forneri et al., Reference Lindstrom-Forneri, Tuokko and Rhodes2007; Tuokko et al., Reference Tuokko, McGee and Rhodes2006) were assessed as psychosocial predictors in the analyses. The 13-item Day and 16-item Night DCS scales (DCS-D and DCS-N respectively) were developed inductively with older drivers to assess their level of comfort and confidence to drive in different situations, controlling for contexts in relation to traffic flow, speed, and road type. Respondents rate their level of comfort on a 5-point scale (0%, 25%, 50%, 75%, and 100%), from “not at all comfortable” to “completely comfortable”, with higher scores indicating higher levels of driving comfort during the day or at night. Examination of the ICCs suggest that the DCS-D and DCS-N have demonstrated good person (.89 and .96 respectively) and item (.98 and .97 respectively) reliabilities, as well as temporal stability (.70 and .88 respectively) in older drivers (Blanchard & Myers, Reference Blanchard and Myers2010; Myers et al., Reference Myers, Paradis and Blanchard2008).
The DBP scale asks participants to rate their responses on a 5-point scale ranging from “strongly agree” (coded as 1) to “strongly disagree” (coded as 5) to statements concerning various attitudes towards driving that comprise four subscales (Pro-self, Pro-other, Con-self, Con-other). Positive aspects of driving relevant for the individual (Pro-self) are assessed by 9 items (e.g., “Driving a vehicle is pleasurable”), with higher scores indicating less positive views of their own driving. Positive aspects of driving relevant to others (Pro-other) are assessed by 7 items (e.g., “Others count on me being able to drive”), with higher scores indicating less positive views of self in relation to others. Negative aspects of driving relevant for the individual (Con-self) are assessed by 9 items (e.g., “The financial cost of maintaining a vehicle is an increasing concern of mine”), with higher scores indicating less negative views of their own driving. Negative aspects of driving relevant to others (Con-other) are assessed by 6 items (e.g., “My driving bothers other people”), with higher scores indicating less negative attitudes of how others view their driving. Internal consistencies (α) for the Pro-self, Pro-other, Con-self, and Con-other subscales were .77, .57, .85, and .74 respectively.
Data Analytic Strategy
We used multi-level models to examine longitudinal changes in outcome and predictor variables. Two levels were specified to account for the nested structure of the data (i.e., measurement occasions are nested within individuals/people). Unlike traditional least-square techniques such as repeated measures analysis of variance (RM-ANOVA) which assume similar change across time for all individuals in a sample, multi-level analyses model each individual’s unique pattern of change across time providing both average (i.e., fixed effects) and individual deviations from this average trajectory (i.e., random effects). Multi-level analyses also permit the use of participants with incomplete data across time.
Time-based models were first fitted to all study variables to assess average change over time. Next, we added psychosocial variables of driving to the model to determine whether driving comfort and attitudes towards driving in relation to self and others moderated driving outcome trajectories. Specifically, estimated within-person intercepts and slopes for each psychosocial measure were computed and then entered as co-variates on the random intercept and slope in each driving outcome to predict individual differences in initial levels and change. The effects of age (at baseline) and gender (0 = male, 1 = female) were also controlled for in the analyses. Separate models were used to assess changes in each of the driving outcomes over time. We simultaneously modeled the psychosocial variables, age, and gender to consider unique contributions of each predictor while controlling for the influence of the others. Mplus v7 was used for all analyses using full information maximum likelihood (FIML) estimation procedures (Muthén & Muthén, Reference Muthén and Muthén2012). FIML estimation enables the analyses to use all available data to produce model estimates.
Results
Descriptive Data
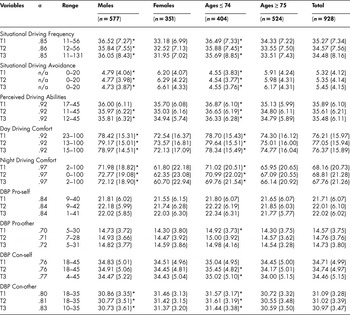
Psychometric data and means for all study variables are presented in Table 1. Males were more likely to report driving more frequently in challenging situations (SDF scores), while females were more likely to report greater avoidance (SDA scores) at each time point. Males had higher daytime and night-time DCS scores than females at each time point, as well as better perceived driving abilities (PDA scores), but only at T2 and T3. For the DBP constructs, a significant gender difference emerged only for Con-other. Men reported that other people viewed their driving more negatively compared to females at each time point. Age cohort differences between younger participants (≤ 74 years) and older participants (≥ 75 years) emerged for the majority of study variables. Specifically, compared to younger participants, older participants reported fewer situational driving frequency instances, more situational driving avoidance, lower perceived driving abilities, and less comfort consistently across time. There were no age cohort differences in the DBP Pro constructs across time (with the exception of Pro-other at baseline). For the DBP Con constructs, older participants had lower Con-self and Con-other scores consistently across time (with the exception of Con-self at baseline). Specifically, older participants tended to report more-negative views of their own driving and in relation to others.
Psychometric properties and mean levels (standard deviations) of driving outcomes and psychosocial driving factors for males and females, and for younger and older participants

DBP = Decisional Balance Plus; n/a = not applicable as scores are counts.
* Mean levels differ significantly (p < 0.05) between males and females, and between younger and older participants (age >74). α = Chronbach’s alpha.
Time-based Trajectories of Driving Outcomes and Psychosocial Measures of Driving
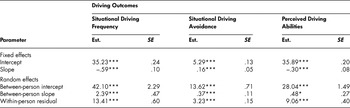
Table 2 summarizes results from the time-based models of driving abilities. On average, situational driving frequency scores declined over time (β = –.59, SE = .10, p < 0.01) while situational driving avoidance scores increased over time (β = .16, SE = .05, p < 0.01). That is, participants reported progressively more driving restrictions (lower SDF and higher SDA scores) for each additional wave of the study (i.e., declines T1 to T2, then further declines by T3). Perceptions of driving abilities also decreased over time for each additional wave of the study, as indicated by a decline in scores on the PDA scale at T2 and T3 (β = –.30, SE = .08, p < 0.01).
Time-based models: Driving outcomes as a function of time in study

Est. = standardized estimates; SE = standard errors.
*p = 0.08; **p < 0.05; ***p < 0.01
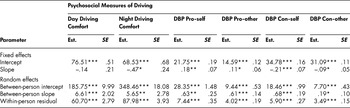
Table 3 summarizes results from the time-based models for the psychosocial measures. On average, driving comfort levels remained stable over time, although there was a trend towards decreasing comfort at night (β = –.47, SE = .24, p = 0.05). Scores on the DBP Pro-self scale increased, while score for Con-self decreased over time (βs = .18 and –.21, SEs = .07 and .07, ps < 0.05 and < 0.01 respectively). That is, participants reported fewer positive and more negative attitudes towards their own driving over time. Scores on the DBP Pro-other scale also tended to increase, whereas those on Con-other tended to decrease over time (ps = 0.059 and 0.067 respectively).
Time-based models: Psychosocial measures of driving over time

*p < 0.07; **p < 0.05; ***p < 0.01
Est. = Standardized estimates; SE = Standard errors; DBP = Decisional Balance Plus.
Moderator Models
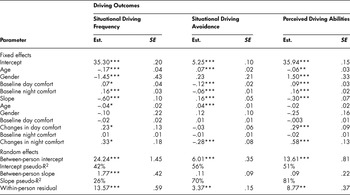
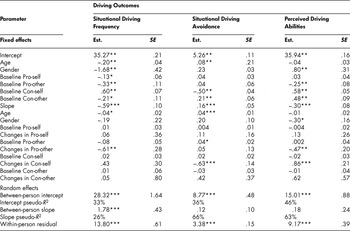
Results from the DCS moderator models of driving outcomes are summarized in Table 4. Table 5 summarizes results from the DBP moderator models of driving outcomes. Results are discussed separately for each outcome (restrictions and perceived abilities).
Moderator models: Fixed and random effects of between-person driving comfort (DCS) moderators of driving outcome trajectories

* = p < 0.09; **p < 0.05; ***p < 0.01
All models controlled for age and gender. Est. = standardized estimates; SE = standard errors; DCS = Driving Comfort Scale. Pseudo-R2 = proportion of reduction in variance after inclusion of moderator variables.
Moderator models: Fixed and random effects of between-person attitudes towards self and others (Decisional Balance Plus [DBP]) moderators of driving outcome trajectories

All models controlled for age and gender. Est. = standardized estimates; SE = standard errors. Pseudo-R 2 = proportion of reduction in variance after inclusion of moderator variables. *p < 0.09; **p < 0.05; ***p < 0.01
Driving Comfort Scale (DCS)
Situational Driving Frequency
Participants who had lower night driving comfort scores at baseline reported driving in fewer challenging situations at baseline (β = .16, SE = .03, p < 0.01). Women and participants who were older report also reported driving in fewer challenging situations at baseline (βs = –1.45 and –.17, SEs = .43 and .04 respectively). However, age, gender, and driving comfort (day or night) did not significantly moderate the slope of situational driving frequency. That is, changes in the levels of participants’ driving comfort were not associated with changes in their frequency of driving in challenging situations over time.
Situational Driving Avoidance
Participants with higher scores on the DCS-D and DCS-N reported less situational driving avoidance at baseline (β = –.12, SE = .02, p < 0.01; β = –.06, SE = .01, p < 0.01 respectively). That is, at baseline, participants who were more comfortable with driving during the day and at night did not avoid driving in challenging situations as much as participants who were less comfortable with their driving. Participants who were older also reported greater avoidance of driving in challenging situations at baseline (β = .07, SE = .02).
Age and driving comfort moderated the slope of situational driving avoidance. Specifically, older adults increased their avoidance of driving in challenging situations more rapidly compared to their younger counterparts (β = .04, SE = .01). Moreover, decreases in driving comfort at night over time were associated with greater driving avoidance over time (β = –.28, SE = .08, p < 0.01). That is, over the course of the study, participants who became less comfortable driving at night reported avoiding more-challenging driving situations. Baseline scores on the DCS-D and DCS-N, as well as changes in the DCS-D, did not moderate the slope of situational driving avoidance.
Perceived Driving Abilities
Participants who had higher baseline scores on the DCS-D and DCS-N had better perceptions of their driving abilities at baseline (β = .09, SE = .03, p < 0.01; β = .16, SE = .02, p < 0.01 respectively). Women also tended to report better perceptions of their driving abilities at baseline (β = 1.50, SE = .33). However, older adults reported less positive perceptions of their driving abilities at baseline (β = –.06, SE = .03).
Driving comfort moderated the slope of perceived driving abilities. While baseline scores on the DCSs also did not moderate the slope of perceived driving abilities, changes in both day and night driving comfort levels moderated the slopes of perceived driving abilities (β = .29, SE = .09, p < 0.01; β = .58, SE = .13, p < 0.01 respectively). That is, participants who showed decreasing levels of driving comfort showed more declines in their perceived driving abilities compared to individuals who had higher levels of comfort. Age and gender did not moderate the slope of perceived driving abilities.
Driving Attitudes (Decisional Balance Plus)
Situational Driving Frequency
Older adults and females reported driving in challenging situations less frequently at baseline (βs = –.20 and –1.68, SE = .04 and .42 respectively). Participants who endorsed higher scores on the DBP Pro-self and Pro-other scales, that is those who were less positive about driving, reported driving less often in challenging situations at baseline (β = –.13, SE = .06, p < 0.05; β = –.33, SE = .11, p < 0.01 respectively). Conversely, higher scores on the Con-self scale (fewer negative attitudes about their driving) at baseline were associated with higher driving frequency at baseline (β = .60, SE = .07, p < 0.01).
Age and gender did not moderate the slope of situational driving frequency. Baseline levels and changes in the majority of the DBP constructs also did not moderate the slope of situational driving frequency. However, decreases in the Pro-other scale were associated with declines in situational driving frequency (β = –.61, SE = 28, p < 0.05), such that participants who perceived others as less positively disposed towards their driving over time drove less often in challenging situations over the course of the study.
Situational Driving Avoidance
Women participants avoided more challenging driving situations at baseline (β = .08, SE = .23). Participants who had higher scores on the DBP Con-self scale at baseline had lower avoidance scores at baseline (β = –.50, SE = 04, p < 0.01). That is, participants who held fewer negative attitudes towards their own driving did not avoid driving in challenging situations at baseline as much as participants who held more negative attitudes. Conversely, higher scores on the Con-other scale at baseline were associated with higher avoidance scores at baseline (β = .21, SE = .06, p < 0.01). Specifically, participants who held less-negative attitudes of how others view their driving reported greater avoidance of driving in challenging situations at baseline.
Age moderated the slope of situational driving avoidance such that older adults increased their avoidance of driving in challenging situations more rapidly compared to their younger counterparts (β = .04, SE = .03). Only one of the DBP constructs moderated the slope of situational driving avoidance. Specifically, changes in the Con-self scale attenuated increases in situational driving avoidance (β = –.63, SE = 14, p < 0.01) such that participants who had increasingly negative attitudes of their own driving were more likely to avoid driving in challenging situations over the course of the study.
Perceived Driving Abilities
Women participants reported more positive perceptions of their driving abilities at baseline (β = .80, SE = .31). Participants who had higher scores on the Pro-other scale (i.e., others had more negative attitudes of their driving) had poorer perceptions of their driving abilities at baseline (β = –.25, SE = .08, p < 0.01). Conversely, higher scores on the Con-self and Con-other scales (i.e., fewer negative attitudes) at baseline were associated with better perceptions of their driving abilities at baseline (β = .58, SE = .05, p < 0.01; β = .48, SE = .09, p < 0.01 respectively).
Age and gender did not moderate the slope of perceived driving abilities. Increases in the Pro-other scale were associated with greater declines in perceived driving abilities (β = –.47, SE = .20, p < 0.05). That is, participants who believed others viewed their driving less positively over time had poorer perceptions of their driving abilities over the course of the study. Changes in Con-self (others had more negative views of their driving) also were associated with declines in perceived driving abilities (β = .86, SE = .21, p < 0.01).
Discussion
This study goes beyond a cross-sectional examination of older adults’ attitudes and perceptions related to driving to examine possible changes over time. Consistent with our a priori expectations, individuals whose attitudes towards driving became more negative over time were not only more likely to rate their driving abilities more poorly but also began restricting their driving by avoiding more challenging driving situations compared to individuals whose attitudes towards driving remained stable across the three-year period. This finding pertained specifically to individuals who displayed more negative attitudes towards their own driving (DBP Con-self) as well as to those who displayed fewer positive attitudes of how positively others viewed their driving (DBP Pro-other). Although driving comfort scores remained fairly stable, a trend emerged for driving comfort, particularly at night, to decline, which in turn was associated with poorer perceptions of their driving abilities and increased avoidance of challenging driving situations over time. The findings also suggested that, compared to younger participants, older participants avoided more-challenging driving situations over time. No additional age-related effects on the rate of change among the other driving variables were found.
Myers et al. (Blanchard & Myers, Reference Blanchard and Myers2010; Myers et al., Reference Myers, Paradis and Blanchard2008) speculated that driving comfort at night, even in good weather and road conditions, might be expected to decline before driving comfort during the day was appreciably affected. And consistent with Bandura’s social cognitive theory (Bandura, Reference Bandura1986), perceived confidence and abilities would be a better predictor of driving behaviour than actual driving skills (MacDonald et al., Reference MacDonald, Myers and Blanchard2008). Tuokko et al. (Reference Tuokko, McGee and Rhodes2006) found the DBP Con-self and Pro-other subscales were the most strongly associated with the likelihood of driving restrictions compared to the other DBP scales. It may be that the DBP Con-self once again emerged because, according to self-regulation theory (Bandura, Reference Bandura1986), individuals change their behaviour when they perceive changes to their functioning (e.g., vision, range of motion, comfort levels) and so it follows that feeling more negatively towards driving would provide motivation to change driving behaviour. Additionally, the negativity bias suggests that individuals have a tendency to pay more attention to negative information compared to positive information (Baumeister, Bratslavsky, Finkenaeuer, & Vohs, Reference Baumeister, Bratslavsky, Finkenauer and Vohs2001; Rozin & Royzman, Reference Rozin and Royzman2001), so in this context, negative attitudes (Con-self) about one’s own driving may be stronger influences for behaviour change than positive attitudes (Pro-self). The re-emergence of the Pro-other subscale underscores the importance of how social interdependence can influence behavior as the need to continue driving to meet the mobility needs of others is an area that has been identified in the literature in qualitative studies (Horowitz et al., Reference Horowitz, Boerner and Reinhardt2002). Overall, the consistency in findings across studies and now over time, as evidenced by the current longitudinal results, suggests that driving comfort levels at night (DCS-N), negative attitudes towards one’s own driving (DBP Con-self), and perceptions that others hold positive attitudes towards their driving (DBP Pro-other) may be good predictors of changes in driving behaviour, namely increased driving restrictions by older adults.
Driving comfort may be an important omnibus construct that combines many facets that influence individuals’ driving behaviour, including Con-self and Pro-other. The DBP constructs (attitudes) are more specific and narrowly defined, and it may be that their combined influences are experienced as “comfort”. It may be that changes in comfort emerge only after the influences of more specific attitudes towards driving (i.e., positive and negative influences) have been experienced and processed for some time, thus only two years may not be enough time to notice significant changes in driving comfort. As subsequent years of data become available, further exploration of how driving comfort and attitudes influence each other will be possible.
Neither causation nor directionality can be inferred from these results. Presently, it is unknown whether driving-related attitudes and perceptions lead to changes in behaviour or whether declining abilities and self-restrictions influence attitudes and perceptions, or both. Future longitudinal research using structural equation modeling and meditational analyses can provide some further insights as to the mechanisms behind these relationships. Future work will also benefit from longitudinal examination of other important variables that may influence attitudes and perceptions and moderate or mediate driving behaviour. According to the driving as an everyday competence (DEC) model (Lindstrom-Forneri et al., Reference Lindstrom-Forneri, Tuokko, Garrett and Molnar2010), individual and environmental factors at the global (e.g., social policies, location, presence of a disease, or mental illness) and specific (e.g., physical health, cognitive status, emotional well-being, sensory state, and driving experience) level interact to determine driving competence and are mediated by attitudes, self-efficacy, and awareness (Lindstrom-Forneri et al., Reference Lindstrom-Forneri, Tuokko, Garrett and Molnar2010). It is likely that other factors described in the DEC model that change over time, such as health and cognitive status, may impact a person’s attitudes and perceptions about his or her driving and thereby contribute to the self-regulatory process.
It is also important to note that although there was only a 6 per cent attrition rate over the course of the two years examined here, the individuals who dropped out of the study were more likely to be older in age. This may have resulted in a younger, more well-functioning sample, thus dampening the magnitudes of the age-related results we found. This may also account for the high scores on the DCS-D and DCS-N scales at baseline compared to previous samples (e.g., Blanchard & Myers, Reference Blanchard and Myers2010).
It must also be acknowledged that this study examined self-reported driving restrictions (frequency and avoidance) and perceived, not actual, driving abilities. Naturalistic driving studies have shown that older drivers may not restrict their practices as much as they report on questionnaires (e.g., Blanchard, Porter, & Myers, Reference Blanchard, Myers and Porter2010; Molnar et al., Reference Molnar, Charlton, Eby, Bogard, Langford and Koppel2013). Also, studies have shown that some older drivers overestimate their driving abilities, particularly those exhibiting some cognitive impairment (e.g., Dobbs, Reference Dobbs2000; Hunt, Morris, Edwards, & Wilson, Reference Hunt, Morris, Edwards and Wilson1997). As naturalistic driving data for the Candrive II cohort become available, we will be able to examine changes in attitudes and perceptions in conjunction with changes in actual driving practices (restrictions in exposure and patterns, as well as driving cessation) over time.
This study extends our current understanding of how attitudes relate to driving perceptions (e.g., comfort) and self-regulation in older adults by examining these constructs over time. Longitudinal analysis provides stronger evidence for age-related processes compared to cross-sectional analyses (Hofer & Sliwinski, Reference Hofer and Sliwinski2001). We anticipate that as subsequent waves of Candrive II data become available, further investigation into these psychosocial constructs will provide even greater insight into the factors contributing to older driver behaviour change.