1. Introduction: comprehensive investment as an indicator of sustainable development
The idea of using a nation's comprehensive investment (also referred to as genuine savings, genuine investment, inclusive investment and adjusted net savings) as a forward-looking indicator of ‘weak’ sustainability is well established (Hamilton and Clemens, Reference Hamilton and Clemens1999; Arrow et al., Reference Arrow, Dasgupta and Maler2003, Reference Arrow, Dasgupta, Goulder, Mumford and Oleson2012; Pezzey, Reference Pezzey2004). Weak sustainability assumes that all forms of capital – produced, natural, human and social capital – are perfectly substitutable, and can be measured and aggregated using a given numeraire. Pearce and Atkinson (Reference Pearce and Atkinson1993) were the first to suggest that the change over time in a country's total capital stocks (the sum of produced, human, natural and social capital) indicates the sustainability of its consumption into the future. This value of a country's total capital stocks at some point in time has been variously referred to as comprehensive wealth and inclusive Wealth (UNU-IHDP and UNEP, 2014). The change in comprehensive wealth over an accounting period (typically one year) is the level of comprehensive investment (CI, from here on) in that country. A negative value for this indicator at time t indicates that future wellbeing will be falling, since by implication reinvestment in the total capital stock is insufficient to offset depreciation. So long as CI is positive and not rising ‘too fast’, then a theoretical prediction is that future wellbeing will be higher than present-day wellbeing (Hamilton and Withagen, Reference Hamilton and Withagen2007).
Sustainable development, as defined by Arrow et al. (Reference Arrow, Dasgupta, Goulder, Mumford and Oleson2012), postulates an economic path where intergenerational wellbeing does not decline over time. What aspects of intergenerational wellbeing are included in the consumption vector are not uniquely defined, but can include both market and non-market goods. The sign and value of CI at time t reflect changes in the present value (PV) of flows of wellbeing in the future, since the shadow price of each asset included in comprehensive wealth is given by the marginal contribution of this asset to the PV of future flows of wellbeing (Arrow et al., Reference Arrow, Dasgupta and Maler2003). These shadow prices used to calculate changes in comprehensive wealth thus reflect what one assumes about the intertemporal social welfare function, since this defines wellbeing over time or at any instant in time. CI estimates have been reported for virtually all of the world's economies, typically using World Bank datasets (World Bank, 2006; UNEP, 2012) for years after 1970, although several longer time series of CI for individual countries are also available (Lindmark and Acar, Reference Lindmark and Acar2013; Greasley et al., Reference Greasley, Hanley, Kunnas, McLaughlin, Oxley and Warde2014; Hanley et al., Reference Hanley, Oxley, Greasley, McLaughlin and Blum2016). Alternative indicators of weak sustainability to the wealth-based indicators discussed above include Green Net National Product (Pezzey, Reference Pezzey2004): if Green Net National Product is falling, then this indicates future wellbeing will also be falling. Green Net National Product and CI are closely related to each other theoretically, as shown by Asheim and Weitzman (Reference Ashiem and Weitzman2001; see also (Pezzey et al., Reference Pezzey, Hanley, Turner and Tinch2006)).
For natural resource abundant economies, Hartwick (Reference Hartwick1977) developed ‘a rule of thumb’ for constant consumption over time, which required the reinvestment of rents from natural resource extraction in capital stocks along a competitive path in a Cobb–Douglas economy. HRT (Reference Hamilton, Ruta and Tajibaeva2006), hereafter HRT, generalized this ‘Hartwick rule’ and illustrated the possibility of unbounded and rising consumption if a CI rate of at least 5 per cent of GDP was maintained over time. Since HRT's generalization of the Hartwick rule provides a policy yardstick for raising consumption over generations, it offers a relevant and possibly appealing prescription for resource-rich developed countries such as Australia.
This paper draws upon the theory of weak sustainability to investigate central issues in the Australian political economy surrounding the utilization of natural resource rents and its comprehensive investment over time. Low rates of national savings have been mooted as characteristic of Australia's economy (McLean, Reference McLean2013; Greasley, Reference Greasley, Ville and Withers2015). The establishment of nation-building wealth funds in 2008 to support investment in infrastructure, health and education illustrates the concern that consumption growth has rested on resource depletion and may be unsustainable (Australian Government Futures Fund, 2014). In this paper, we extend the standard macro measure of saving to include accumulation of all forms of capital: produced, human, natural and social. Our purpose lies in gauging how Australia utilized its natural resource rents over time, and in particular whether higher consumption growth might have been sustained by Australia had it matched the CI of three ‘comparator’ countries, namely Britain, Germany and the USA. HRT (Reference Hamilton, Ruta and Tajibaeva2006) show, with post-1970 data, that consumption rather than investment of resource rents is common among resource-rich countries, to the detriment of future generations, but they do not consider Australia. Randall (Reference Randall2008), also using post-1970 World Bank data, describes Australia as ‘muddling along’, with adjusted net savings of around 5 per cent of GDP, but he questions if its genuine savings are positive, once environmental factors, including water resource depletion, are put into the accounts. Brown et al. (Reference Brown, Asafu-Adjaye, Draca and Straton2005) concur, and show that natural resource rich Queensland had a genuine savings rate of around half of the Australian average. However, neither HRT, Randall or Brown et al. include a measure of technological change in their estimates of CI. In contrast, we include a proxy for technological progress in CI, based on the method suggested in Pezzey et al. (Reference Pezzey, Hanley, Turner and Tinch2006), given the importance that other long-run analysis has shown of including such an adjustment (Greasley et al., Reference Greasley, Hanley, Kunnas, McLaughlin, Oxley and Warde2014).
2. Australia as a case study
Australia attained world-leading incomes and consumption by the 1850s, but lost its exceptional position during the 20th century (Broadberry and Irwin, Reference Broadberry and Irwin2007; Madsen, Reference Madsen, Ville and Withers2015). At issue is whether or not a depletion of natural assets uncompensated by investment in other elements of the capital stock and a comparatively low CI contributed to this ‘lost exceptionalism’. Australia's economy has long extracted natural resource rents (Cashin and McDermott, Reference Cashin and McDermott2000; Battelino, Reference Battelino2010). These rents have chiefly been gained from exploiting non-renewable minerals or finite pastoral land resources, against a backcloth of fast population growth.
As noted above, HRT (Reference Hamilton, Ruta and Tajibaeva2006) emphasize the ‘missed opportunities’ of natural resource abundant countries post-1970. Their counterfactuals show how the produced capital stocks of 70 resource-rich countries might have grown in the period 1970–2000 had they adopted variants of the Hartwick rule. Most resource-rich developing countries did not attain their ‘generalized’ Hartwick rule of 5 per cent genuine savings and, by implication, actual produced capital stocks for most countries were lower than in the counterfactual world, creating a wedge between potential and actual consumption. However, Australia differs from many developing countries with regard to non-renewable resources. The rise and fall of public investment and swings in international borrowing have been distinctive elements of Australian produced capital formation (Maddock, Reference Maddock, Ville and Withers2015). Moreover, human and technological capital now form a large part of Australia's wealth. Randall (Reference Randall2008) reports that intangible capital (calculated as a residual) comprised nearly 80 per cent of Australia's total wealth in 2000. Thus, HRT's method of constructing counterfactuals, which simply considers the reinvestment of resource rents in produced capital, is too restricted for Australia.
Further, simply reinvesting resource rents, or indeed attaining a 5 per cent CI/GDP ratio, does not provide a sensible ‘rule of thumb’ for Australia, which experienced world-leading incomes and consumption for much of the post-1861 period. This is because leading economies have often attained savings ratios of above 5 per cent. The counterfactual CI ratio used in our paper therefore uses the savings rates (rates of CI) attained by other leading OECD countries over the past 150 years (Hanley et al., Reference Hanley, Oxley, Greasley, McLaughlin and Blum2016) to calibrate what Australia might have saved and invested, and thus how much higher its present-day wealth (future consumption possibilities) might have been today.
The analysis has the following sequence. First, by constructing long series of CI for years since 1861 and by investigating their correlation with the PV of consumption changes over horizons of 50 years into the future, the utility of CI as a consumption predictor for Australia is gauged. Several variants of CI are considered, including indicators using TFP to measure changes in technological capital. Our analysis of CI as a sustainability indicator also includes a variant which assumes that new minerals discoveries offset extraction over finite (50 years) time horizons. Secondly, having estimated the relationships between savings and future consumption, they are used to identify the appropriate savings counterfactual for gauging the feasible trajectory of Australia's consumption. Thirdly, by drawing on previously constructed estimates of CI for several OECD countries for years since 1870, we postulate how Australian consumption might have grown. The counterfactural exercise projects Australia's actual consumption per capita of 1870, by assuming it matched the higher savings rates of the OECD countries, to gauge whether or not Australia is indeed a land of missed opportunities. The utility of the counterfactual rests on showing that some variants of CI can predict future consumption over a 50-year horizon, for Australia and the comparator countries. To anticipate, augmenting CI with measures of technological progress is necessary to predict the future consumption of OECD countries, including Australia, over long horizons.
3. Comprehensive investment and future consumption
FHV (Reference Ferreira, Hamilton and Vincent2008), hereafter FHV, showed that with a constant population growth rate of γ, a population at time t of N, a consumption discount rate of ρ, and year-on-year change in produced capital K, denoted
 $\dot{K}$
, that per capita CI, denoted g (for genuine savings) is given by:
 $$g = \displaystyle{{\dot{K}}\over{N}} - F_{R} \ r - \gamma w,$$
where (F R r) is the shadow value of per capita natural capital extraction and ω is per capita wealth, which is the sum of per capita natural and produced capital stocks W at time t divided by the population N. This shows CI per capita is determined by per capita net change in produced and natural capital (the first two terms on the right-hand side of equation (1)) adjusted by a ‘wealth-dilution effect’ from population growth −γ w. Equation (1) thus shows the constituents of the CI indicator at any point in time.
Of equal interest is the theoretical literature which relates CI to changes in wellbeing into the future. For instance, Arrow et al. (Reference Arrow, Dasgupta, Goulder, Mumford and Oleson2012) show that intergenerational wellbeing is rising over future periods if CI is positive when evaluated at the correct shadow prices in the current period. Hamilton and Withagen (Reference Hamilton and Withagen2007) show that, if CI is positive and growing at a slower rate over time than the real discount rate, then consumption will rise over time. FHV (Reference Ferreira, Hamilton and Vincent2008) show that in any period t, the value of g is equal to the discounted value of changes in per capita consumption from t to infinity if the consumption discount rate ρ is adjusted downward by the (constant) population growth rate. If population grows at a varying rate, then the relationship between per capita CI and the PV of changes in future consumption is altered. From this, FHV derive a reduced-form relationship between CI and the PV of changes in future consumption (PVΔ C) with constant population growth:
 $$PV \Delta C_{{it}} = \beta_{0} + \beta_{1} g_{{it}} + \epsilon_{it},$$
or with varying population growth:
 $$PV\Delta C_{{it}} + PV(\Delta \gamma_{{it}} w_{{it}}) = \beta_{0} + \beta_{1} g_{{it}} + \epsilon_{it}.$$
Ferreira and Vincent (Reference Ferreira and Vincent2005) was the first empirical test of CI as a forward-looking sustainability indicator. They used four alternative measures of changes in a country's capital: gross investment in produced capital; net investment in produced capital; net investment adjusted for depletion of natural capital (green net savings); and finally green net savings augmented by investment in education. A test of CI as a predictor of future changes in consumption is that β1 = 1. They found that β1 is always positive except for a subsample of 22 OECD countries, a finding they attribute to the likely greater importance of technology or TFP in developed countries. FHV (Reference Ferreira, Hamilton and Vincent2008) estimated both (2) and (3) using data for 64 developing countries over the period 1970–2003. Their chief finding is that the hypothesis β1 > 0 is supported only for green net savings and its varying population growth adjusted equivalent. However, their estimates of β1 are ‘significantly below 1’.
Greasley et al. (Reference Greasley, Hanley, Kunnas, McLaughlin, Oxley and Warde2014) and Hanley et al. (Reference Hanley, Oxley, Greasley, McLaughlin and Blum2016) extend tests of the CI by using longer spans of data, covering up to 250 years for Great Britain, Germany and the USA. They additionally investigate the effects of allowing for a ‘value of time passing’, treating time as an uncontrolled capital stock which, through exogenous technological progress, expands the economy's production possibilities, following Pezzey (Reference Pezzey2004). Thus, in the terminology of (2) and (3), g can now include changes in both human capital and a value of technological progress as increments to the capital stock, as well as changes in produced and natural capital. The hypothesis of a one-to-one relation (β1 = 1) between the more inclusive (value of technology-augmented) measures of net investment and future wellbeing over horizons of up to 100 years receives some support from their findings for Great Britain. Additionally, for a three-country panel of Germany, the USA and Great Britain with post-1870 data for consumption per capita and CI measures augmented with the value of technology, these authors report estimates of
 $\beta_{1} = 1.12$
and 1.16, for horizons of 50 years, depending on the inclusion or otherwise of fixed effects in the panel regressions.
3.1. Comprehensive investment and Australia
Now we turn to formulating the CI measures used to indicate future changes in Australia's consumption for years since 1861. Several measures of Australia's CI per capita are used here to represent g in the empirical tests of equations (2) and (3). The motivation of the tests is to establish how the alternative measures of CI indicate changes in the future consumption of Australia since 1861. The hypothesis β1 = 1 provides the basis for gauging the utility of the CI measures as an indicator of changes in future consumption in Australia, assessed here over forward-looking horizons of up to 50 years.
An important consideration for the Australian CI estimates arises in the treatment of minerals in the natural capital stock measures, which form part of green net savings and varying population growth adjusted green savings. Previous studies (e.g. Hamilton and Clemens, Reference Hamilton and Clemens1999; Hanley et al., Reference Hanley, Oxley, Greasley, McLaughlin and Blum2016) simply treat mining as capital depletion, but new discoveries of economically viable resources are potentially an important increment to Australia's capital stocks. In recent decades, the discovery of new economically viable reserves of many minerals have exceeded rates of extraction. In the absence of historical data on viable reserves, the alternative investment measures used here either count or omit mining as capital depletion, to gauge which approach best indicates future consumption changes. Moreover, technological progress has been a powerful long-run force in raising incomes and consumption in developed countries (Abramovitz, Reference Abramovitz1986). Pemberton and Ulph (Reference Pemberton and Ulph2001) and Pezzey et al. (Reference Pezzey, Hanley, Turner and Tinch2006) have highlighted the need to include changes in technology in measurements of a nation's capital stocks. Weitzman, (Reference Weitzman1997) suggested that the incremental value of technological change for a nation's total capital could be as high as 40 per cent of net national product. Since omitting a technological progress measure may understate changes in capital, especially for OECD countries, variants of CI augmented with a technology premium based on TFP are also reported and utilized here.
Accordingly, the results in section 5 use eight alternative measures of g t :
-
(1) NP, which is net national investment in produced capital;
-
(2) GreenI, which comprises NP plus changes in natural capital, where mineral extraction is equated to depletion;
-
(3) CI, which comprises GreenI and education investment;
-
(4) CIm, which is CI augmented with the value of mineral extraction;
-
(5) CITFP, which is CI augmented by a value for changes in exogenous technological progress;
-
(6) CImTFP, which is CIm augmented by a value for changes in exogenous technological progress;
-
(7) CITFPW, which comprises CITFP adjusted for the wealth dilution associated with a varying population growth; and
-
(8) CImTFPW, which comprises CImTFP adjusted for the wealth dilution associated with a varying population growth.
These eight variables are described in data section 4 (using the sources detailed in the online appendix, available at https://doi.org/10.1017/S1355770X17000110), and used in tests of the hypothesis β1 = 1, in results section 5. Having gauged the utility of the various savings measures as forward-looking indicators of Australia's consumption, section 6 then reports a counterfactual experiment to show a trajectory of consumption in a world where Australia matches the investment of Germany, the USA and Britain over the period 1870–2011, rather than investing at observed historical rates.
4. Measuring Australia's comprehensive investment and consumption
4.1. Consumption per capita
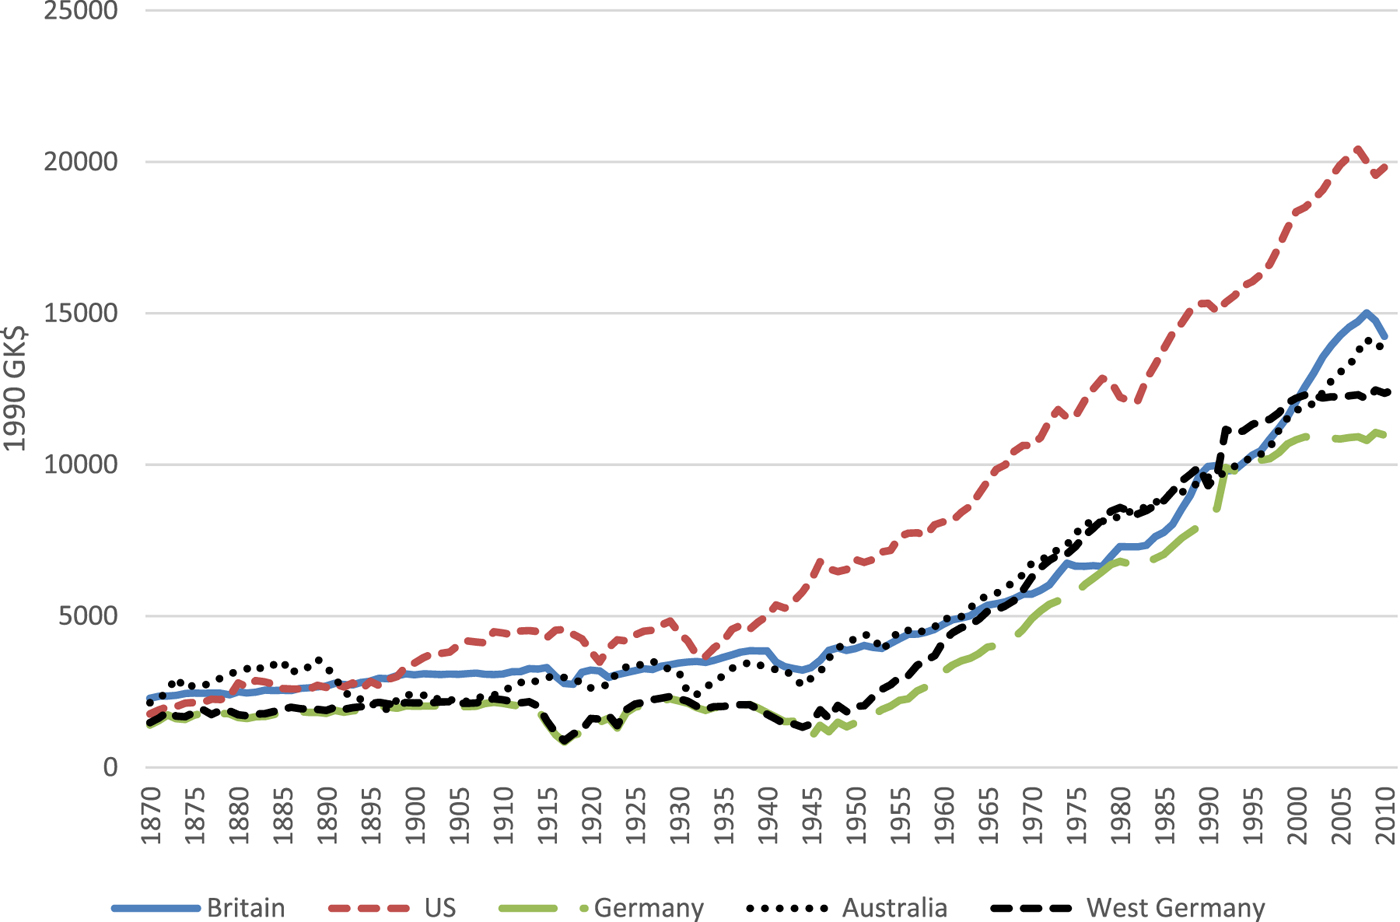
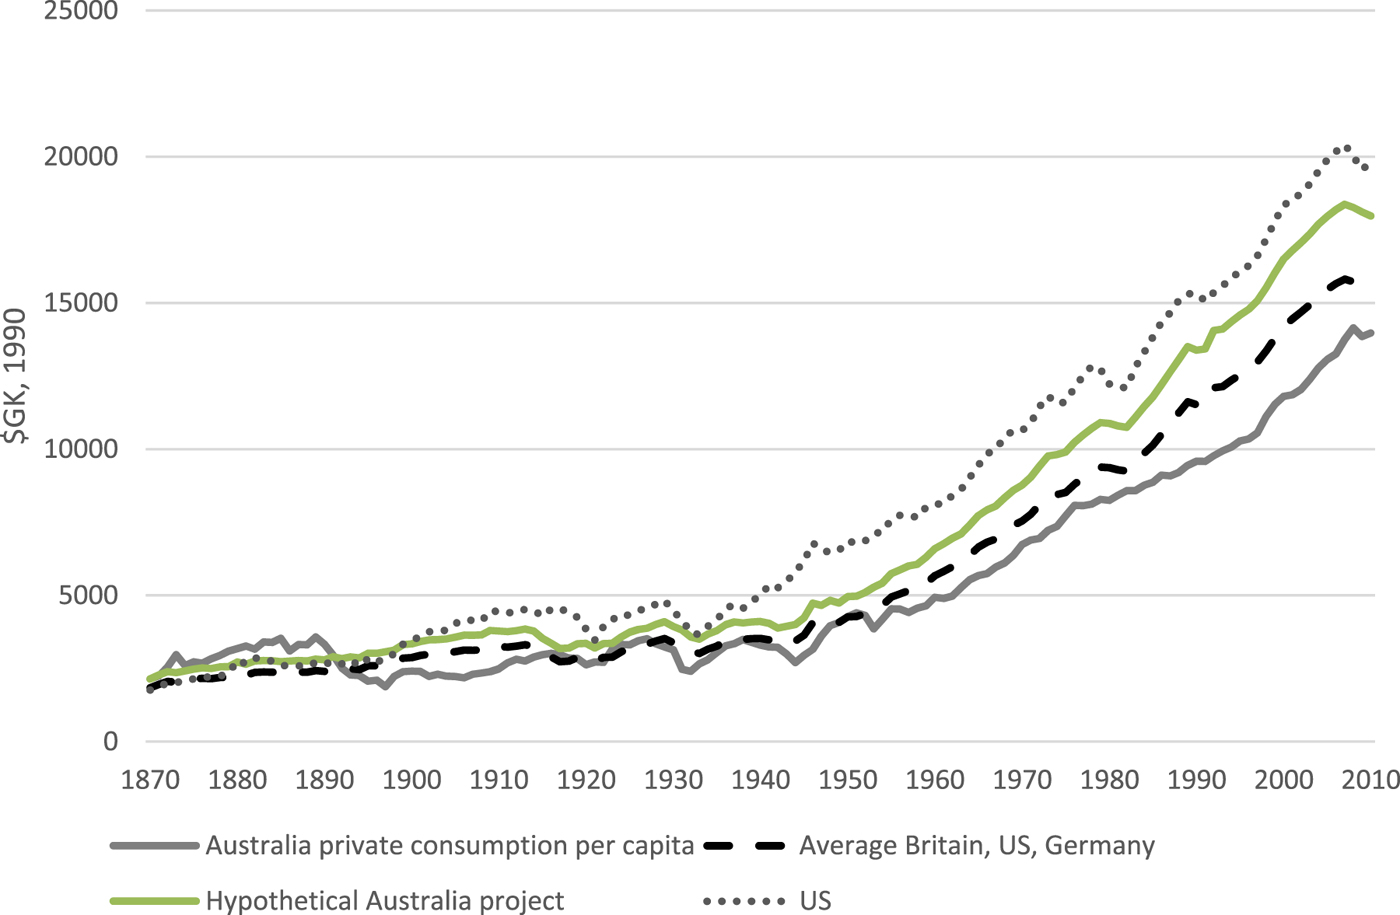
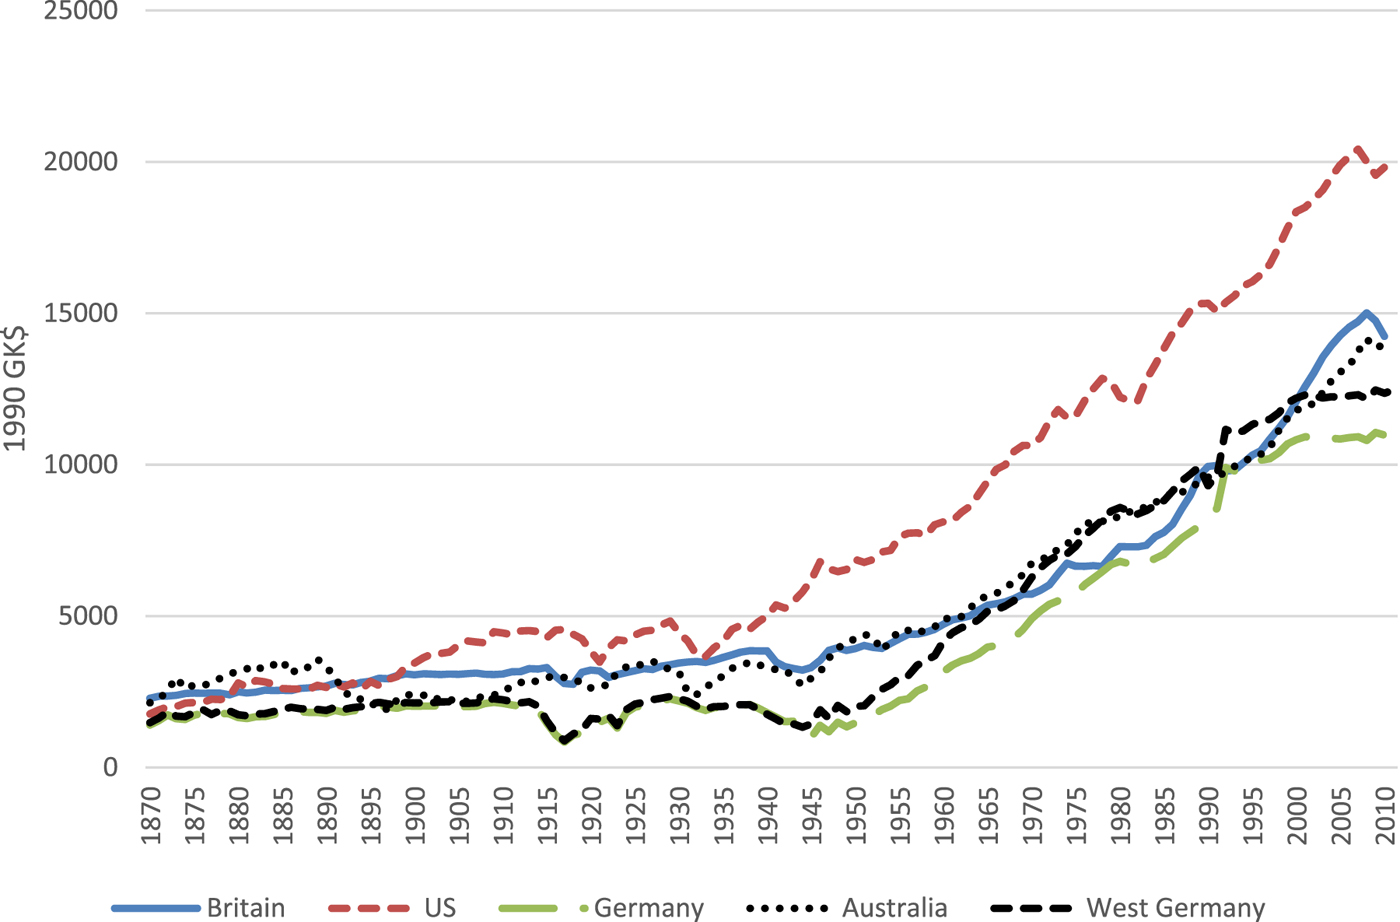
Australia's average consumption per capita was exceptionally high by the early 1870s, and was around 12 per cent higher than that of the UK over the years 1870–1874, when measured in purchasing power adjusted, $GK. The disparity in 1870–1874 with the USA and Germany was even greater, with Australian advantages of 35 per cent and 68 per cent, respectively. Most analysts attribute this ‘Australian exceptionalism’ to the high productivity of the pastoral and minerals economy (Broadberry and Irwin Reference Broadberry and Irwin2007). However, compared to the most prosperous parts of the world, Australia has experienced consumption decline since the 1870s, most obviously relatively to the USA, as shown in figure 1. British and Australian consumption per capita have aligned more closely since the 1870s, but the long phase of higher Australia levels post-1945 ended around 1990. Germany's relative position is impacted by the effects of the world wars but, along with the UK, West Germany catches up with Australian consumption levels in the 1990s, although reunification hits average German consumption thereafter.
Consumption per capita ($GK, 1990)
The PV of future changes in Australian consumption per capita in $A, for horizons of between 20 and 50 years using alternative discount rates, are shown as figure A1 in the online appendix. The discount rate of 2.64 per cent/year is the average long-run interest rate (Pope, Reference Pope1986; Homer and Sylla, Reference Homer and Sylla2005; OECD, 2017) minus the CPI inflation rate from 1861 to 2011.Footnote 1 Thus, for example, the final data point for the 50 years' horizon is 1961, with consumption changes measured over 1961–2011. The series show that consumption per capita generally rises, especially in the 20th century, although over the shortest 20 years' horizon negative changes are experienced until the 1920s, with consumption per capita falling 1927–1947. The central issue for us is whether or not this comparative decline in Australian consumption levels could have been avoided with higher savings.
4.2. Produced, green and education investment
Estimates of Australia's net national produced investment, NP, are extant for years from 1861 (Butlin, Reference Butlin1962, ABS cat. no. 5206). The chief additional elements in GreenI are the increments in the rental value of land and the extracted value of mining rents. Pastoral land accounts for the bulk of farmland rents in Australia. Butlin's investment accounts reflect the importance of cattle and most especially sheep farming in Australia by incorporating livestock accumulation. His sequence of net domestic capital formation, plus livestock accumulation, less net overseas borrowing leads to a concept of net national capital accumulation (Butlin, Reference Butlin1962: 5). Livestock have been an important part of Australia's assets, and the changes in their stocks were large compared to net investment in produced capital in the 19th century. The annual gain from livestock accumulation averaged 1.05 per cent of GDP 1861–1890 (Butlin, Reference Butlin1962: 62–67). The value of livestock's accumulation mirrors closely the changes in the rental value of pastoral land (Greasley, Reference Greasley, Ville and Withers2015: 163). Accordingly, the estimates of livestock accumulation are used here to approximate changes in pastoral rents, since nomadic pastoralism, especially in the earlier years, makes measuring pasture in use problematical. The land area under cultivation each year can be measured directly. Rental values per hectare of agricultural land are higher than for pasture, but cultivated land rent's contribution to overall land rents is relatively modest (Greasley, Reference Greasley, Ville and Withers2015: 164).
The estimates of NP excluding livestock accumulation, shown in figure A2 in the online appendix, averaged 6.57 per cent of GDP in 1861–2011. NP was sometimes negative, particularly in the 1890s and the early 1930s. The highest rates of NP were achieved in the decade before WWI, and during WWII and the 1950s. Australia's domestic produced investment (not shown) was sometime above NP, given the sometimes high level of overseas borrowing, for example during the 1870s and 1880s.
Australia has long extracted mineral rents, defined here as minerals production multiplied by price less wage costs per ton. Following the gold boom of the 1850s, there have been three periods when mining rents exceeded 5 per cent of GDP: during the 1860s, around the turn of the 20th century, and since 1988. Over the long period, mining rents averaged 3.53 per cent of GDP. Debiting minerals extraction and adding changes in pastoral (approximated by livestock accumulation) and cultivated land rentals from and to NP yields the series GreenI in figure A2 of the online appendix. This measure of Australia's green investment averaged 3.29 per cent of GDP 1861–2011, showing that Australia most likely surpassed the ‘Hartwick Rule’. Some elements of natural capital, most especially the net loss of forests, are omitted from GreenI, simply because of a lack of long-run data. Randall (Reference Randall2008) and Brown et al. (Reference Brown, Asafu-Adjaye, Draca and Straton2005) argue that deforestation is modest after 1970. There are only conjectures of the likely forest area for earlier years, notably those of Gammage (Reference Gammage2011) which argue that afforestation accompanied the decline of the aboriginal population.
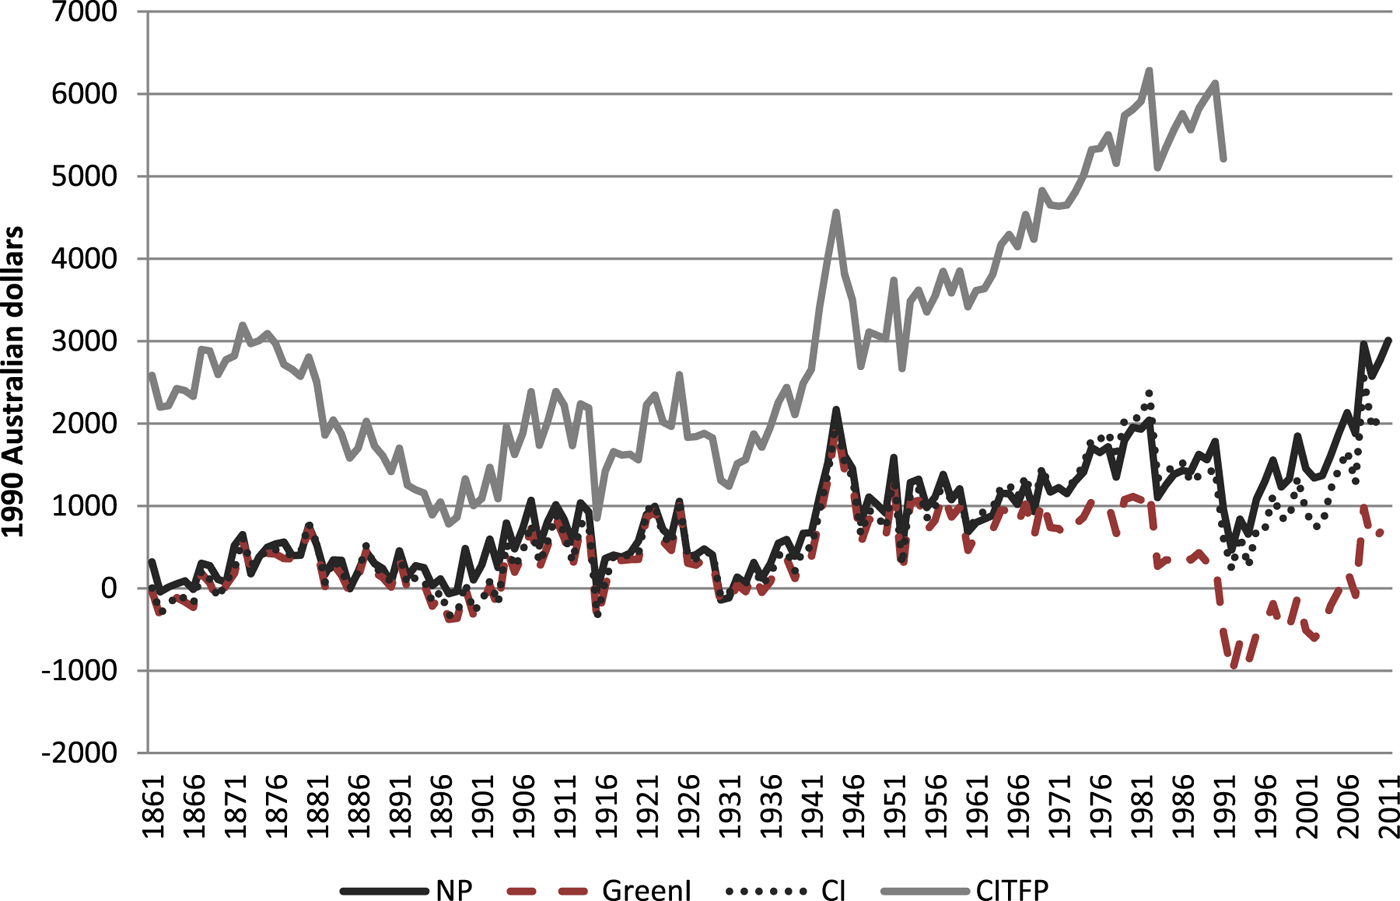
There are, however, prolonged periods where GreenI is negative, including between 1991 and 2007, during the earlier mining booms of the 1860s, and around the turn of the 20th century. For the years to WWII, CI and GreenI align closely, given low education investment. Thus, Australia's CI was also negative for long periods before 1939, on several occasions by amounts in excess of 5 per cent of GDP. In contrast, the higher rates of education investment after 1945 have been associated with consistently positive CI, contributing to an average CI/GDP ratio of 5.28 per cent in the period 1861–2011.
The alternative measure CIm does not debit extracted mineral rents, postulating that minerals finds in Australia offset the resource depletion from mining. The CIm/GDP ratio averaged 8.81 per cent between 1861 and 2011, showing Australia's savings in a more favourable light than the conventional CI measure. The historiography of Australia's mineral discoveries emphasizes that markets and institutions shaped exploration and the exploitation of minerals. Blainey (Reference Blainey1970) charts the discoveries of the 19th century, arguing that searches intensified when other trades slackened, as the opportunity cost (chiefly of labour) diminished. Alluvial gold mining was labour intensive, but the capital intensity of mining rose, and mining investment reached 4 per cent of GDP in 2009, around twice the ratio of the early 20th century mining boom. McLean (Reference McLean2013) attributes mining resurgence from the 1960s to Asian demand and shipping innovations, while Wright and Czelusta (Reference Wright and Czelusta2002) note the association of investment in mining education and the easing of export restrictions. The sustained rise in mineral prices from the 1970s further encouraged the rise in mining investment over the next 40 years (Greasley, Reference Greasley, Ville and Withers2015).
4.3. Augmenting comprehensive investment with technology
Weitzman (Reference Weitzman1997) and Pemberton and Ulph (Reference Pemberton and Ulph2001) advocated including exogenous technological progress in the capital stock assessments of a country. Arrow et al. (Reference Arrow, Dasgupta, Goulder, Mumford and Oleson2012) also included the value of technological progress as part of a country's capital stock. Pezzey (Reference Pezzey2004) refers to such technological progress as part of a ‘value of time passing’, which increases the future consumption possibilities of an economy. The case for including exogenous technological progress within a more comprehensive investment measure appears strong for OECD countries where residual productivity plays a central role in income growth (Manuelli and Seshadri, Reference Manuelli and Seshadri2014).
Trend growth TFP estimates underpin the valuation of exogenous technological progress. Treating time as an uncontrolled capital stock means TFP's contribution to the change in wealth in any year should be included in augmented measures of CI. Our approach to gauging how TFP contributes to changes in the value of wealth follows Pezzey et al. (Reference Pezzey, Hanley, Turner and Tinch2006, equation (14)) and calculates the PV of future changes in TFP over 20-year horizons, using a 2.64 per cent/year discount rate.Footnote 2
The TFP index utilized here includes inputs of pastoral land, approximated by the stock of sheep and cattle, and hectares of cultivated land (Greasley and Madsen, Reference Greasley and Madsen2016). Accordingly:
 $$ TFP = \gamma / K^{\alpha} T^{\beta} L^{1-\alpha-\beta},$$
where Y is real GDP, K is produced capital, T is pastoral and agricultural land, L is labour hours, and the exponents are the relevant output elasticity, measured by income shares.
The exclusion of mineral reserves as a factor input needs to be explained. Over time the extraction of minerals will diminish the reserve, to the likely detriment of measured TFP (Syed et al., Reference Syed, Grafton and Kalirajan2013). Alternatively, discoveries in Australia, most often of gold before 1914, but of a wider range of minerals from the 1960s including iron ore and bauxite, tempered depletion, to likely augment measured TFP. Thus the index of TFP, which shows actual average growth of 1.57 per cent/year 1842–1890 and 0.79 per cent/year 1891–2009, is a residual which may reflect, inter alia, the vagaries of minerals discoveries.
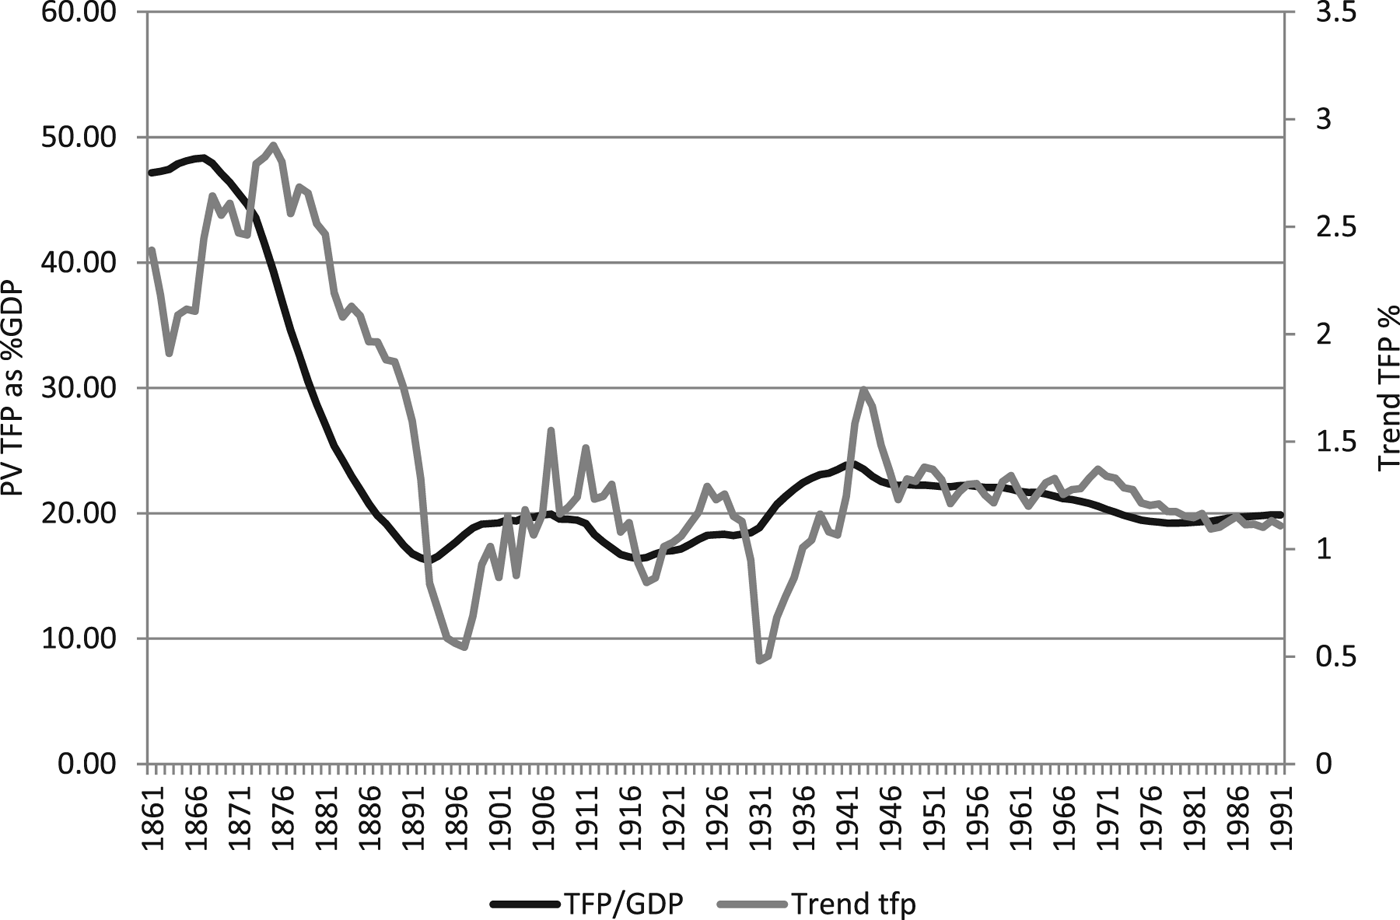
The measures of savings including technological change used here (CITFP and CImTFP) incorporate estimates of trend TFP (extracted using a Kalman filter) using data defined as equation (4), and illustrated in figure 2. TFP unadjusted for minerals reserves is adopted because TFP from any source will impinge upon future consumption. Moreover, the measures of TFP available for the comparator countries are also unadjusted for mineral reserves; thus the counterfactuals reported in section 6 are based on consistent data. The measure of trend TFP, therefore, is not strictly exogenous technological progress – the uncontrolled stock of technological capital associated with the ‘passing of time’ – but rather reflects wider forces influencing residual productivity.
Trend TFP and PV TFP/GDP

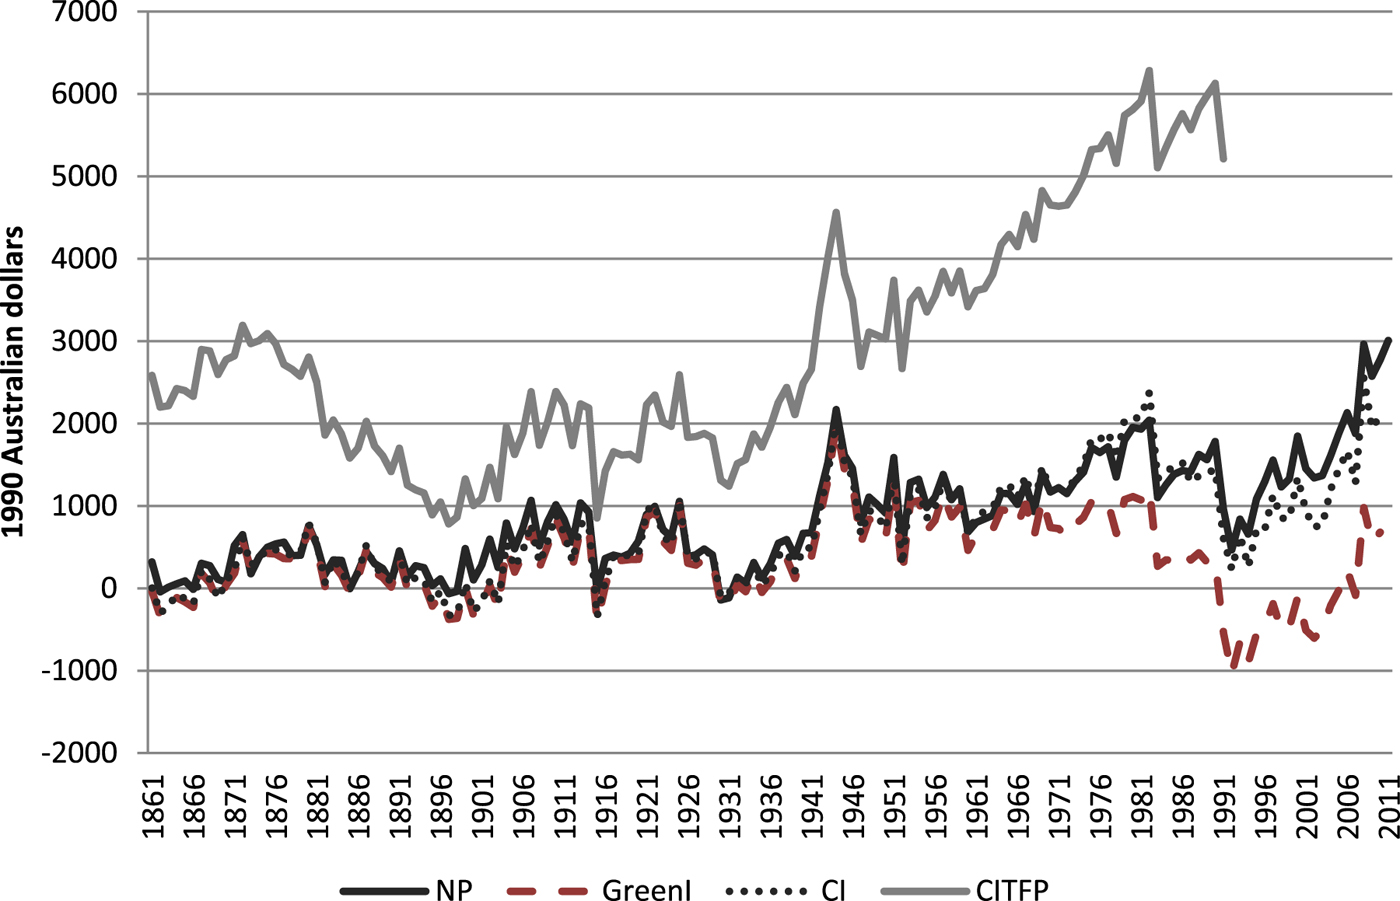
The PV of TFP summed over a 20 years' horizon and discounted at 2.64 per cent/year averaged around 20 per cent of annual GDP since the 1890s, and it was higher in earlier decades (see figure 2). These data highlight the magnitude of TFP for changes in the comprehensive wealth of Australia. To illustrate, figure A3 in the online appendix compares NP, GreenI and CI with the TFP augmented measure, CITFP. Whereas CI averaged around 5 per cent of GDP, the corresponding figure for CITFP is around 30 per cent. These comparisons highlight the central influence of technological change and the other ingredients of residual productivity for rich countries like Australia, and temper the value of HRT-type 5 per cent genuine savings prescriptions for OECD, and possibly for developing, countries.
Although the ratio of CITFP/GDP spiked in the 1870s and again after 1945, real CITFP per capita shows an upward movement through the 20th century (figure 3). While GreenI per capita is often negative, the values of CITFP per capita are consistently positive and generally rising. Intuitively at least, the positive changes in the PV of future consumption per capita shown in figure A1 (online appendix) correspond generally with the upward shifts in CITFP per capita. The precise relationship is estimated in section 5.
Alternative investment measures per capita ($A, 1990)
4.4. Varying population growth and wealth dilution
With varying population growth, FHV (Reference Ferreira, Hamilton and Vincent2008) show that the relation between CI and the PV of future changes in consumption is altered by a wealth-dilution effect (equation (3)). The wealth-dilution effect arises from the sharing of a given amount of capital between more people. So long as population growth is positive, wealth dilution reduces CI per capita. The measure of aggregate wealth used here to calculate the wealth-dilution effect follows the World Bank's ‘top-down’ construction method. The World Bank measure identifies total wealth with the PV of an estimated stream of private and public consumption over 25 years. On this basis Australia's wealth per capita shows no appreciable gain from the 1860s to around the years of WWII. Since then wealth per capita has grown by a factor of three.
5. Estimation and results of hypothesis tests on β1
The equations of interest are (2) and (3). These are not empirical models aiming to best represent the left-hand side variable; rather the equations are used to test the implications of the CI model. Our focus lies in producing estimates of β1 and their standard errors. These estimates may be affected by the proxies used for the relevant variables and by the estimation methods. Given the long time series for the alternative measures of g, used in the estimation of equations (2) and (3), the issue of possible non-stationarity of the data needs to be considered. Where the variables in (2) or (3) are stationary or integrated of order zero (denoted I(0)), the estimates will have classical propertiesFootnote 3 except where endogeneity issues might arise. Endogeneity is potentially a problem where population-adjusted savings and wealth-dilution terms are included, as in (3) (see FHV, Reference Ferreira, Hamilton and Vincent2008). In such cases an instrumental variable estimator (2SLS) is adopted. A further issue arises if the relevant variables are non-stationary, for example, integrated of order one (denoted I(1)). Here spurious correlation may arise unless the (two) variables in our test equations (2) or (3) are cointegrated (see Engle and Granger, Reference Engle and Granger1987).
Cointegration, should it exist, would have a property of producing ‘super-consistent’ estimates and the cointegrating relationship could be interpreted as representing a long-run equilibrium (Greasley and Oxley, Reference Greasley and Oxley2010). If the two variables in our test equations (2) or (3) are integrated of different orders, then a cointegrating relationship cannot exist, and if the two variables are both I(0), any linear combination of the variables (trivially) satisfies the properties of cointegration. Unit root tests of the variables of interest based upon the Augmented Dickey–Fuller test for (non-)stationarity are reported as table 1. Tests for the existence of cointegration use the Engle–Granger Engle and Granger Reference Engle and Granger1987 ‘two-step’ approach which appraises the time series properties of the residuals in a levels OLS regression and where the null hypothesis is of no-cointegration.
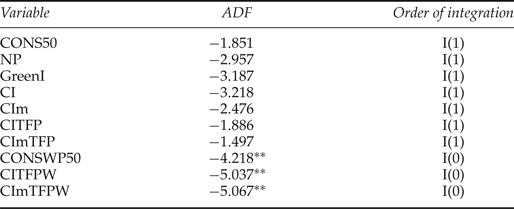
Unit root tests

Notes: CONS50 is the dependent variable of equation (2), the net present value of consumption per capita, measured over a 50-year horizon. The discount rate is 2.64%/year minus the population growth rate. CONSWP50 is the dependent variable of equation (3),
 $PV\Delta C_{t} + P V \lpar \Delta \gamma_{t}w_{t}\rpar $
, which adjusts CONS50 for possible wealth dilution associated with population growth. The other variables are the eight alternative measures of savings, g
t
defined in section 3.1. The degree of augmentation in the ADF is determined by the Hannan–Quinn criteria. **denotes significance at the 5% level.
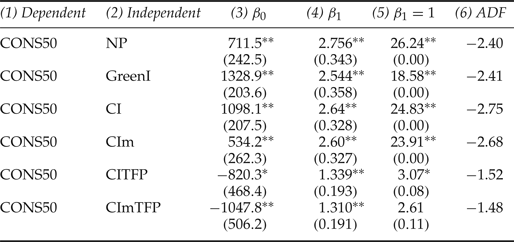
Consider first the results reported in table 2, where the estimates of β1 for NP, GreenI, CI and CIm fall in the range of 2.5–2.8. The
 $\hbox{proposition } \beta_{1} = 1$
underpins the empirical tests of CI as an indicator of future consumption, as explained in section 3. In all cases reported here, the
 $\hbox{hypothesis } \beta_{1} = 1$
is rejected for our data, so that the PV of future changes in real consumption per capita over a 50 years' horizon is higher than that indicated by the level of savings. Additionally, over the long run, the augmented measures GreenI, CI and CIm do not better indicate future changes in consumption than NP and all the measures not augmented with a value of technological progress greatly understate future consumption growth. Of course, these results need to be judged in the context of the ADF tests which do not reject the null of no-cointegration in the cases of NP, GreenI, CI and CIm.
OLS estimates of equation (2) and tests of β1 = 1

Notes: CONS50 is the dependent variable of equation (2), the net present value of consumption per capita, measured over a 50-year horizon. The discount rate is 2.64%/year minus the population growth rate. Figures in parentheses represent standard errors (columns 3 and 4) and p-statistics (column 5), where they are based upon Wald tests of the null hypothesis. ** and * denote significance at the 5% and 10% level, respectively.
What appears more relevant for Australia is the augmenting of the investment series with a technology premium. In this case, for CITFP and CImTFP (both of which are I(1), as is CONS50), the estimated β1 parameter values are 1.34 and 1.31, respectively, and in the latter case, the null of a one-to-one relationship between investment and future changes in consumption, looking forward 50 years, is not rejected. The results for CImTFP raise the possibilities that extracting minerals should not be counted as disinvestment and that Australia consumed exhaustible natural capital to support consumption, to the possible detriment of future generations. However, the longevity and the discovery of new mineral reserves in Australia casts some doubt on accounting conventions which simply equate extraction with disinvestment, and we return to this issue later. More certainly, technological change formed an important part of changes in Australia's wealth, and its value needs to be incorporated in interpretations of future consumption growth. However, once again, in the absence of cointegration, the estimated long-run coefficients of β1 in the cases of CITFP and CImTFP need to be treated with some caution.
A characteristic of Australia since 1870 has been its high population growth, which has exceeded the rates of Western Europe and the USA. Thus, the possibility of a significant wealth-dilution effect (the spreading of capital among a larger population) may have particular resonance for Australia. There was also a secular decline in labour force participation in Australia from the high, 90 per cent rates of the convict era to a low of around 40 per cent, which was not reversed until the 1970s. Participation, thereafter, rose to around 50 per cent by 2010, partly because of higher immigration. Australia's overseas born rose to 27 per cent of its population in 2010, to temper the effects of an aging native population on labour participation (Butlin et al., Reference Butlin, Dixon, Lloyd, Ville and Withers2015).
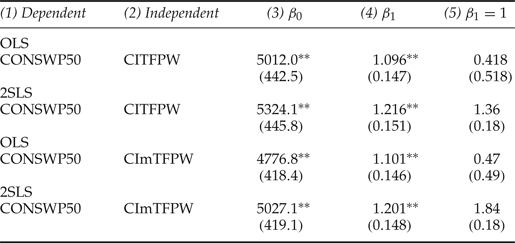
The estimates for the technology-augmented measures in table 3 are based on equation (3), which adjusts the savings–consumption relationship for possible wealth dilution. The form of the adjustment includes a wealth-related variable on both sides of the equation; hence we report OLS and 2SLS estimates, where the latter are deployed to counter any possible bias from endogeneity. As can be seen from table 1, all of the relevant variables are I(0), making both OLS and 2SLSFootnote 4 feasible and appropriate. In all four cases the estimated β1 value is not statistically significantly different from unity. These findings reinforce the argument for a technology premium to be included in the measure of savings, but also that wealth dilution associated with population growth was a drag on Australia's consumption growth. The robustness of these findings is strengthened by the rejection of no-cointegration.
OLS and 2SLS estimates of equation (3) and tests of β1 = 1

Notes: CONSWP50 is the dependent variable of equation (3)
 $ = PV\Delta C_{t} + PV\lpar \Delta \gamma_{t} w_{t}\rpar $
, the net present value of consumption per capita, measured over a 50-year horizon, adjusted for possible wealth dilution associated with population growth. Discount
 $\hbox{rate} = 2.64$
%/year minus population growth rate. Instruments used for 2SLS estimation are: dependent variable (−1); labour; capital; population; year; rate of interest (short). Figures in parentheses represent standard errors (columns 3 and 4) and p-statistics (column 5), where they are based upon Wald tests of the null hypothesis. **denotes significance at the 5% level.
The inclusion, or otherwise, of minerals extraction as disinvestment has very little effect on the estimated relationships. In the case of the 2SLS point estimates, β1 is, respectively, 1.22 and 1.20 with and without the inclusion of mining as disinvestment. This does not mean that attempts to include natural capital within investment accounts are without merit. While GreenI here includes the rental value of farmland and mineral extraction, the accounting exercises of Brown et al. (Reference Brown, Asafu-Adjaye, Draca and Straton2005) and Randall (Reference Randall2008) further consider forest depletion, water quality and pollution. We are unable to measure these variables with pre-1970 data, and the effects of their exclusion are uncertain, so their omission might lead to an overstatement of rises in wealth. Yet the point estimates of β1 all exceed unity. If anything, the wealth dilution adjusted estimates suggest that our broadest measure of savings, CImTFPW, understates changes in wealth, at least in the context of understanding consumption changes over finite horizons of up to 50 years ahead.
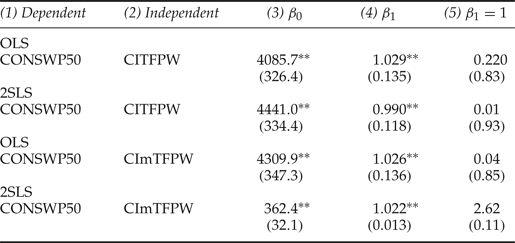
There are other possibilities as to why the point estimates β1 of in table 3 all exceed unity. These include that the wealth-dilution effects of population growth are overstated, or that the consumption discount rate is understated. Much of Australia's population growth since 1870 has been from immigration, and to the extent that the migrants embodied human capital not measured in the Australian national accounts, changes in its wealth might be understated in the accounting of CI. The consumption discount rate embedded in the estimates of tables 2 and 3 is the ex post long-run interest rate. To the extent that uncertainty surrounding the future might influence current consumption decisions, this rate might understate the value of immediate consumption. The results in table 4 incorporate a higher discount rate of 3.33 per cent/year (less the population growth rate), which reflects Australia's long-run capacity to consume, measured by real GDP growth. The effect is to reduce the point estimates of β1 to values very close to unity. Another feature of the results in table 4 is that the OLS and 2SLS estimated parameter values of β1 are much closer than for the results in table 3 with the lower discount rate. Again, the results which count or exclude mining output as capital depletion show little material difference.
OLS and 2SLS estimates of equation (3) and tests of β1 = 1 with alternative discount rate

Notes:
 $\hbox{CONSWP50} = PV\Delta C_{t} + P V \lpar \Delta \gamma_{t}w_{t}\rpar $
. Discount
 $\hbox{rate} = 3.33$
%/year minus population growth rate. Instruments used for 2SLS estimation are: dependent variable (−1); labour; capital; population; year; rate of interest (short). Figures in parentheses represent standard errors (columns 3 and 4) and p-statistics (column 5), where they are based upon Wald tests of the null hypothesis. **denotes significance at the 5% level.
6. Counterfactual Australia: comparisons with OECD countries
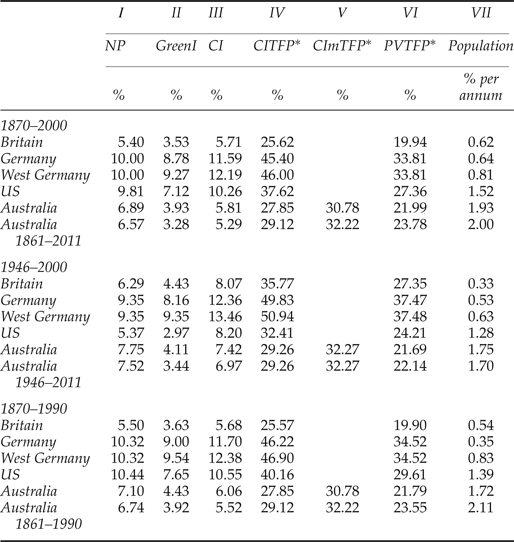
The statistical tests do not reject the hypothesis that CITFPW and CImTFPW exhibit a one-to-one relationship with the PV of future changes in Australia's consumption per capita for horizons of 50 years. We utilize this finding, along with earlier results for the UK, the USA and Germany, to explore what might have happened to the trajectory of Australia's consumption had Australia's savings matched that of the other countries. The chief elements in the savings ratios of the four countries are set out in table 5. Australia, since 1946, has had the lowest CI ratio of the four. Its NP after 1946 exceeds that of Britain, but Australia's higher depletion of natural capital and slightly lower education investment accounts for its lower CI. The three comparator (using West German data) countries' CI ratio averaged 9.91 per cent between 1946 and 2000, which is 33 per cent higher than Australia's ratio. The augmented ratio CITFP is also lower in Australia after 1946. The three-country ratio averaged 38.4 per cent between 1946 and 2000, which is around 32 per cent higher than Australia's CITFP ratio of 29.11 per cent. The implication is that, on both the simple measure (CI) and the technology-adjusted measure (CITFP), Britain, Germany and the USA achieved savings rates averaging around one-third higher than those of Australia after 1946. The consequences for Australia's comparative consumption decline after 1946 appear to have been ameliorated (over finite 50-year horizons) by consuming natural capital, according to the CImTFP measure, since not debiting mineral use adds 4.04 per cent to the saving rate 1946–1920.
Savings ratios as a percentage of GDP, and population growth rates

Notes: *Present value of TFP is discounted over a 20-year horizon; the data in columns IV–VI are averages ending in the year 1991.
Over a longer period since 1870, Australia's CI ratio also aligned closely with that of Britain, but lagged well behind the US and German ratios, which averaged a 9.38 per cent CI ratio between 1870 and 2000, some 60 per cent above Australia's ratio. For the technology-augmented CITFP ratio, the three-country average over the longer period is 36.5 per cent, or 31 per cent above Australia's ratio. Together, the comparative data for the post-1946 and post-1870 periods highlight that Australia's savings have been persistently low compared to its comparator countries, and that all measures of savings (NP, CI and CITFP), contributed to the shortfalls. Again, the consumption of natural capital appears to have tempered the relative decline of Australia's consumption over the 50 years' horizon, with CImTFP showing a 3.1 per cent higher savings rate than CITFP between 1861 and 2011.
Next we consider the possible extent of lost consumption arising from Australia's relatively low savings since 1870. Before doing so, we note that Australia's savings rate was only low relative to the comparator countries used here. Compared to developing, natural resource rich countries, Australia's savings rates are deeply impressive. HRT (Reference Hamilton, Ruta and Tajibaeva2006) generalized ‘Hartwick rule’ postulates that a 5 per cent genuine savings ratio may lead to unbounded consumption, and they highlight the failure of many natural resource rich countries to meet this rule post 1970. Our measure which corresponds most closely with HRT's genuine savings data is CI, and for Australia we estimate a CI/GDP ratio of 5.29 per cent for the period 1861–2011. The CI ratio markedly understates the savings of Australia, since it excludes a value for technological progress's contribution to the stock of wealth. On the wider CITFP measure, Australia's savings ratio averaged around 29 per cent between 1861 and 2011. Concomitantly, the real value of Australia's consumption per capita grew around seven times over the same period, despite a wealth-dilution effect due to the population growing by a factor of around 19. However, the other OECD countries attained CITFP ratios that averaged around 31 per cent higher, despite their lower population growth, which again points to missed Australian consumption opportunities. Even if we postulate that Australia had greater capacity to support consumption over finite horizons by consuming natural capital, the CImTFP measure shows an 1861–2011 savings rate of around 32 per cent, which falls short of the average 36.5 per cent CITFP of the comparator countries. At best, consuming natural capital only ameliorated the pace of Australia's relative consumption decline.
Had Australia, post-1870, matched the average CITFP of Britain, Germany and the USA, its consumption would at least have matched the average consumption growth of the comparators. We have shown elsewhere (Hanley et al., Reference Hanley, Oxley, Greasley, McLaughlin and Blum2016) that CITFP provides a good, near one-to-one indicator of future changes in consumption of the three comparator countries since 1870, over horizons of up to 50 years. The estimates of β1 for Australian CITFP are also not statistically different from unity, once allowance is made for wealth dilution from population growth, and these results hold with the alternative measures of the discount rate. For Australia, CImTFP, where mining output is not debited in the savings measure, also provides a near one-to-one indicator of future consumption over a 50-year horizon. Thus, Australia's consumption growth may have exceeded that of the other three countries had it simply matched their average CITFP, because of a greater capacity to consume natural capital.
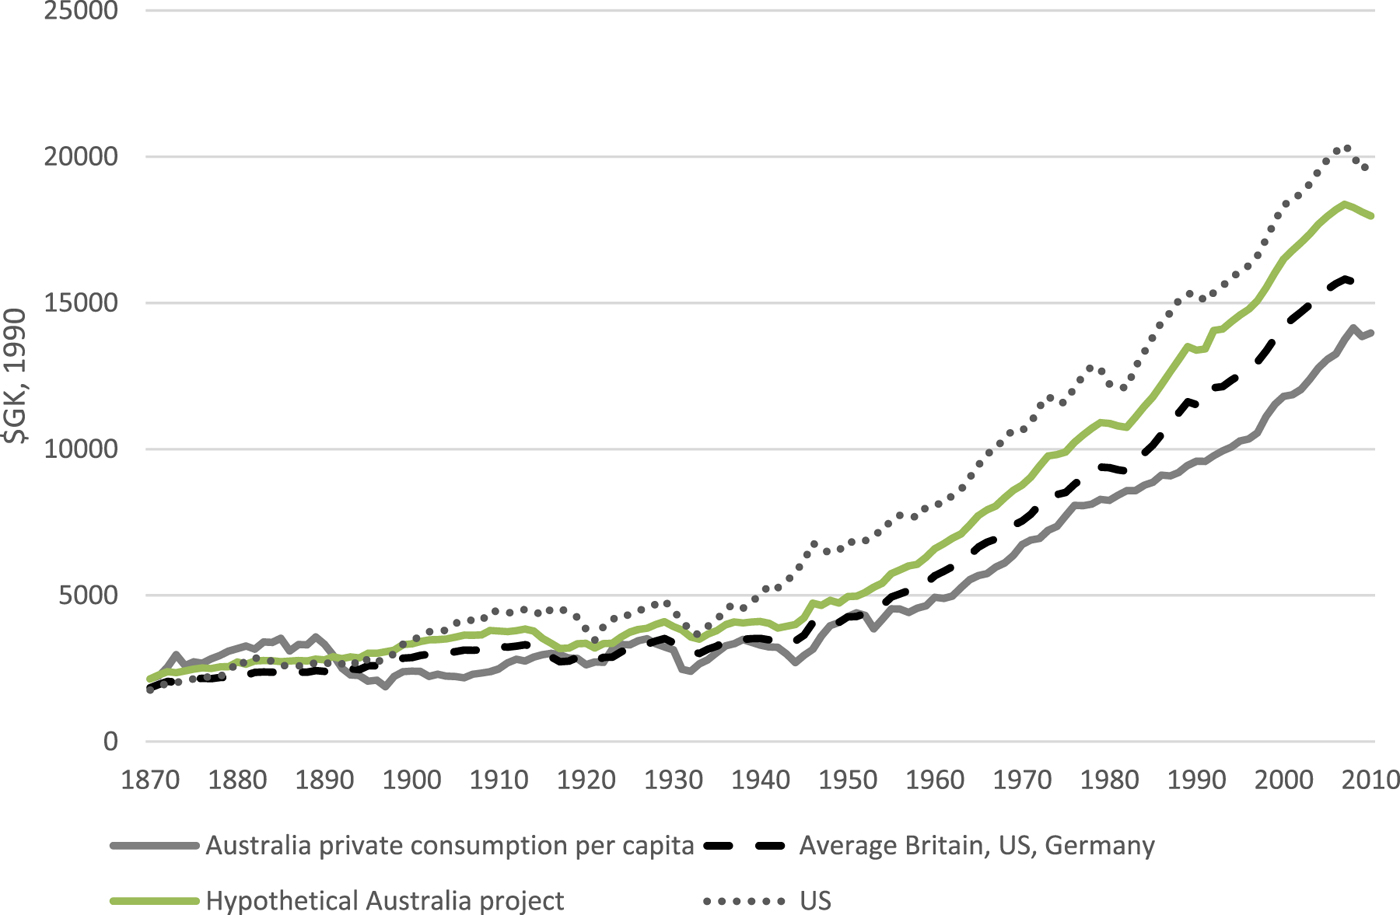
A projection from Australia's actual consumption per capita in 1870, figure 4, shows a counterfactual trajectory, assuming Australia did indeed match the average consumption growth of the OECD comparators. The counterfactual shows that Australian consumption per capita would have been around 28 per cent higher by 2010 had its CI, and thus its consumption growth, been equal to that of the comparator countries. The counterfactual shows a potential for Australia's consumption to have sustained a distinct margin above that of the leading European economies, which was forgone because of Australia's relatively low savings. Thus, in 2010, counterfactual Australian consumption per capita is 26 per cent above British, and 44 per cent above West German levels. These are large losses by any standards.
Consumption per capita ($GK, 1990)
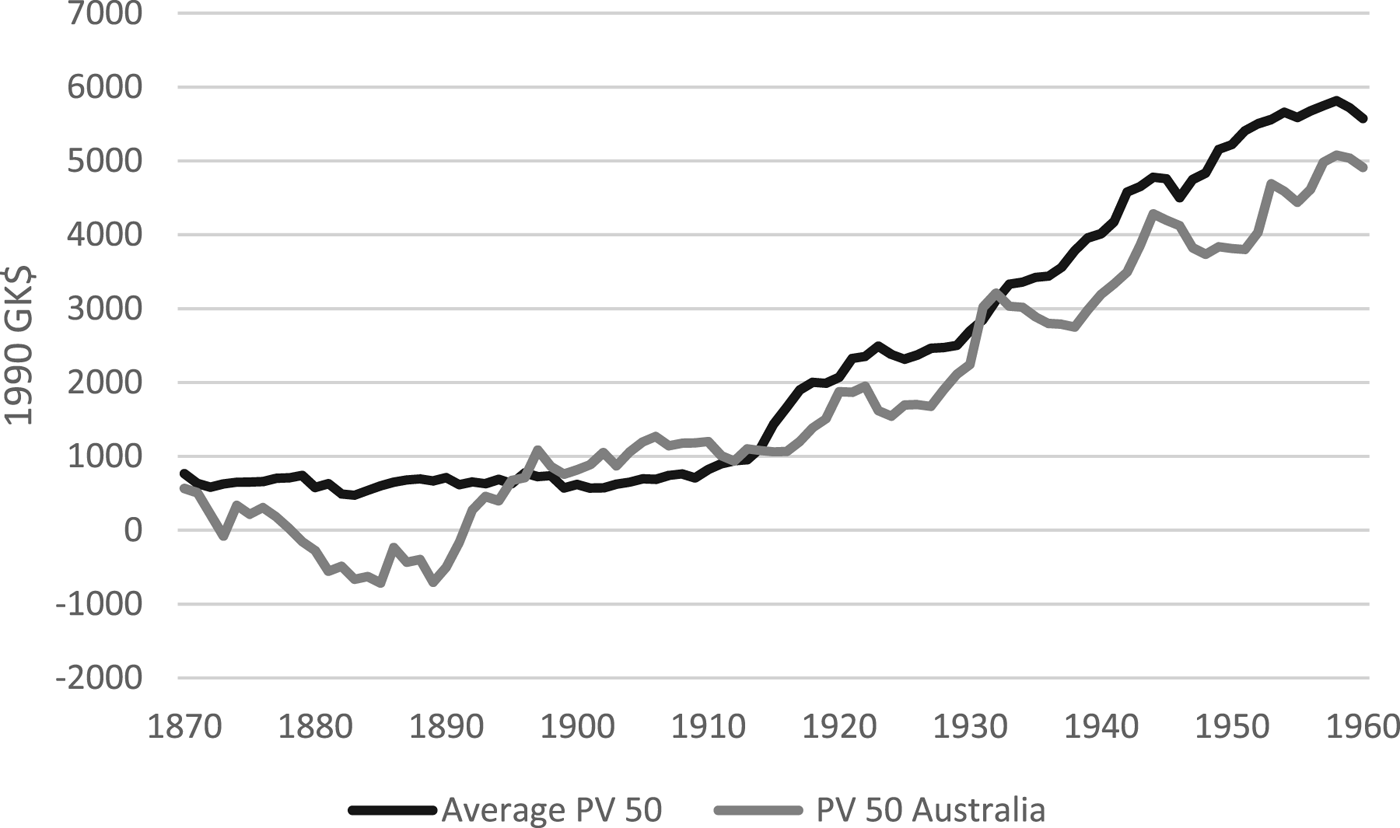
The erosion of Australia's world-leading consumption per capita levels of the early 1870s was not a smooth process. An illustration is provided by figure 5, which shows the discounted PV of consumption per capita changes over 50-year periods, for Australia and for the average of the comparator countries. In 1870 the (discounted) value of the change in Australia's consumption per capita over the next 50 years (PVΔC50) was $GK566, which, we have argued, reflects the value of CITFP or CImTFP in 1870. Thereafter, Australia's PVΔC50 fell sharply and was negative between 1879 and 1891. It was not until 1897 that Australia's PVΔC50 showed levels above the comparator countries' average PVΔC50. By implication, a long phase of relatively low Australian saving spanning the years 1870–1896 diminished relative Australian consumption growth over a period lasting until 1946. Unusually, Australia's PVΔC50 exceeds the three-country average between 1897 and 1913. These were years of higher Australian savings, as shown in figure A3 (online appendix) and figure 3, with produced investment showing a sharp rise during the first decade of the 20th century. This helped to moderate the gap between Australia's and the comparator countries' consumption growth through to the 1950s. However, Australia's pre-1914 savings upturn was short lived, and it was choked off, initially by WWI and by the interwar depression. Post-1945, CITFP growth was less strong in Australia, and the gaps between Australia's and the other countries' PVΔC50 persist to present day.
Present value of future changes in consumption over a 50-year horizon, Australia versus three-country average ($GK, 1990)

7. Concluding remarks
Comprehensive Investment (genuine savings) has become the most widely used economic indicator of sustainable development (World Bank, 2011; UNEP, 2012). This indicator focusses on how well a country maintains its asset base of all forms of capital over time, taking into account how the rents from natural resource exploitation are utilized as consumption or savings (Hamilton and Hartwick, Reference Hamilton and Hartwick2005). The issues are important for Australia's political economy, given its high endowments of natural resources per capita. The standard World Bank savings indicators do not place Australia in a favourable light, at least compared to other OECD countries. Moreover, others, including Brown et al. (Reference Brown, Asafu-Adjaye, Draca and Straton2005) and Randall (Reference Randall2008), have suggested that the World Bank indicators may overstate Australia's genuine savings, by understating its depletion of natural capital. The issues, however, are complex and Brown et al. (Reference Brown, Asafu-Adjaye, Draca and Straton2005) also note that new discoveries of minerals in Queensland have created reserves – of, for example, coal – which may last 600 years. Nevertheless, there is a growing concern that Australia's savings have been inadequate (McLean, Reference McLean2013). The establishment of nation-building wealth funds in 2008 to support investment in infrastructure, health and education illustrates one policy response to these widely held concerns (Australian Government Futures Fund, 2014).
This paper's principal contributions are fourfold. First, estimates of Australia's CI have been pushed back to 1870, and compared to the long-run data for the USA, Britain and Germany. Secondly, these measures of savings have been extended to include a value of technological progress. Thirdly, the utility of comprehensive saving measures as predictors of future changes in consumption over a 50-year horizon for Australia has been gauged. Fourthly, we have explored how the trajectory of Australia's consumption per capita would have grown after 1870, had it matched the savings of comparator OECD countries, to gauge Australia's ‘lost opportunities’.
Australia's comprehensive investment as reported here has been positive in most years since 1870, even without allowing for a value of technological progress. A genuine savings ratio averaging around 5 per cent of GDP, which is probably what Australia has attained since 1870, is sufficient to meet HRT (Reference Hamilton, Ruta and Tajibaeva2006) generalized ‘Hartwick rule’ for unbounded consumption over time. However, the growth of Australia's consumption after 1870 has, from the tests reported here, greatly exceeded what would follow from a 5 per cent savings rate. Much of the discussion surrounding the utility of comprehensive investment as an indicator of weak sustainability surrounds the possibility that natural capital depletion is understated in the empirical estimates (Pezzey and Burke, Reference Pezzey and Burke2013). Brown et al. (Reference Brown, Asafu-Adjaye, Draca and Straton2005) show, for example, that coral and water resource degradation may not be reflected in the accounts. Certainly, the historical data constructed here do not fully reflect all changes in natural capital. Yet, without allowing for a value of technological progress, the measures of CI grossly understate future consumption, looking forward 50 years. However, when allowance is made for productivity advances, the technology-augmented measure of savings indicates the future changes in consumption remarkably closely.
Now, this does not mean that incorporating changes in natural capital in measures of savings is unimportant. On the contrary, some forms of natural capital depletion may have implications for strong sustainability, and these ought to be measured. The impact at the local level of natural capital depletion, for tourism or agriculture, for example in Queensland or the Murray Darling Basin, might also be substantial. However, the results here show clearly that productivity improvements have been the chief driver of Australia's consumption growth since 1870. Thus, any attempts by policy makers to manage the natural capital stock need also to consider the implications for technological progress. In the case of minerals extraction, the World Bank's accounting methods would suggest a capital depletion averaging around 3 per cent of GDP in Australia since 1861. In contrast, the results suggest a value of technological progress's contribution to wealth that averaged around 23 per cent of GDP between 1861 and 1990. Within the context of weak sustainability, this technology premium clearly dominates natural capital depreciation, which has led to sustained and substantial growth of consumption, despite a rapid population growth. Weitzman's, (Reference Weitzman1999) argument that worries surrounding natural capital depletion need also to reflect policy concerns surrounding R&D effectiveness gains support from our Australian case study.
Within the assumptions of the weak sustainability model on which CI is based, Australia can readily consume natural capital and maintain consumption growth, so long as sufficiently rapid technological progress is maintained. Even in the context of strong sustainability, certain forms of natural capital depletion, including minerals extraction, may have little economic relevance, given the remaining lifetimes of reserves at current extraction rates. The results here, however, reveal some real concerns about Australia's savings rate when compared to other OECD countries. In common with previous studies we also find that Australia's CI has not matched that of other developed countries, a conclusion that applies to most years since 1870. The underpinnings of relatively low savings in Australia appear to be broadly based, and to span produced, human and technological capital. To an extent Australia's greater capacity to consume natural capital has probably ameliorated the pace of relative consumption decline. Even so, we show, on conservative assumptions, that Australian consumption per capita might have been 28 per cent higher by 2010 had it matched the savings rates of leading OECD countries since 1870. Had this higher savings rate been realized, Australia would have maintained the per capita advantage in consumption that it had over Western European countries more than 100 years ago.
Supplementary material and methods
To view supplementary material for this article, please visit https://doi.org/10.1017/S1355770X17000110.