Introduction
The causative agent of amoebic gill disease (AGD) in Atlantic salmon is Paramoeba perurans, an amphizoic amoeba (15–40 µm diameter) that has successfully fulfilled Koch's postulates (Crosbie et al., Reference Crosbie, Bridle, Cadoret and Nowak2012). Molecular tools, such as real-time reverse transcription polymerase chain reaction (real-time RT-PCR) and in situ hybridization, have been established to quantify and identify the presence of P. perurans both in the marine environment and in gill swabs and gill tissue (Young et al., Reference Young, Dyková, Nowak and Morrison2008; Bridle et al., Reference Bridle, Crosbie, Cadoret and Nowak2010; Crosbie et al., Reference Crosbie, Bridle, Cadoret and Nowak2012; Fringuelli et al., Reference Fringuelli, Gordon, Rodger, Welsh and Graham2012; Downes et al., Reference Downes, Henshilwood, Collins, Ryan, O'Connor, Rodger, MacCarthy and Ruane2015). However, since many early studies reported on P. pemaquidensis as the putative aetiological agent of AGD, relatively little is known about the biology of P. perurans and its potential environmental risk factors and distribution in relation to AGD outbreaks. A relationship between increasing water temperature and AGD prevalence has been reported during outbreaks in Atlantic salmon farms in Tasmania (Australia), Scotland (UK), Norway, Chile and South Africa (Clark and Nowak, Reference Clark and Nowak1999; Douglas-Helders et al., Reference Douglas-Helders, Saksida, Raverty and Nowak2001, Reference Douglas-Helders, O'Brien, McCorkell, Zilberg, Gross, Carson and Nowak2003, Reference Douglas-Helders, Nowak and Butler2005; Adams and Nowak, Reference Adams and Nowak2003; Steinum et al., Reference Steinum, Kvellestad, Rønneberg, Nilsen, Asheim, Fjell, Nygård, Olsen and Dale2008; Bustos et al., Reference Bustos, Young, Rozas, Bohle, Ildefonso, Morrison and Nowak2011; Mouton et al., Reference Mouton, Crosbie, Cadoret and Nowak2013). For example, in Tasmania, clinical infection usually occurs when the water temperatures are in the range of 15–20 °C (Munday et al., Reference Munday, Foster, Roubal, Lester, Perkins and Cheng1990), though AGD was recorded at a minimum temperature of 10.6 °C and a minimum salinity of 7.2 ppt if established prior to drop in temperature and salinity (Clark and Nowak, Reference Clark and Nowak1999). In Scotland, AGD has been reported at temperatures from 7.5 to 13.5 °C (http://www.scotland.gov.uk/Resource/0039/00393037.pdf accessed 15 January 2015). Moreover, not only temperature but also environmental factors like bacterial counts and turbidity (most likely organic matter) were found to be significantly correlated with increasing P. pemaquidensis density (Douglas-Helders et al., Reference Douglas-Helders, O'Brien, McCorkell, Zilberg, Gross, Carson and Nowak2003).
Most marine amoebae are bactivorous, although some are known to feed on other protozoans, algae or organic detritus (Bovee and Sawyer, Reference Bovee and Sawyer1979; Douglas-Helders et al., Reference Douglas-Helders, O'Brien, McCorkell, Zilberg, Gross, Carson and Nowak2003). Therefore, a better understanding of the role of bacterial densities and community makeup on AGD occurrence might be useful for future risk assessment of disease and management options. Previous studies in Tasmania investigated the role of salmonid gill bacteria on AGD (Bowman and Nowak, Reference Bowman and Nowak2004; Embar-Gopinath et al., Reference Embar-Gopinath, Butler and Nowak2005, Reference Embar-Gopinath, Crosbie and Nowak2006, Reference Embar-Gopinath, Bowman, Carson, Crosbie and Nowak2008). A culture-independent 16S rRNA gene-based approach was used to identify gill bacteria associated with AGD in Atlantic salmon infected in the laboratory or obtained from commercial sea cages (Bowman and Nowak, Reference Bowman and Nowak2004). These samples were found to be dominated by marine Gram-negative bacteria of the genus Psychroserpens spp. (family Flavobacteriaceae, phylum Bacteroidetes). These bacteria were not detected in any of the AGD-negative samples nor in one of two AGD-positive samples obtained from fish subjected to temporary freshwater immersion, suggesting that Psychroserpens spp. is a potential opportunistic genus associated with salmonid AGD in Tasmania (Bowman and Nowak, Reference Bowman and Nowak2004). However, a second study, using a culture-dependent approach, did not find the genus Psychroserpens spp. in AGD-positive samples, but rather Winogradskyella spp. (family Flavobacteriaceae, phylum Bacteroidetes) and Staphylococcus spp. (family Staphylococcaceae, phylum Firmicutes) were present (biochemical tests, cluster analysis and 16S rRNA gene-based approaches) (Embar-Gopinath et al., Reference Embar-Gopinath, Bowman, Carson, Crosbie and Nowak2008). Moreover, fish experimentally infected with a Winogradskyella sp. strain developed increased numbers of AGD lesions following Neoparamoeba spp. infection relative to those exposed to a Staphylococcus sp. strain (Embar-Gopinath et al., Reference Embar-Gopinath, Butler and Nowak2005, Reference Embar-Gopinath, Crosbie and Nowak2006). Amoebae cultures at the Marine Scotland Science (MSS) Marine Laboratory, UK, are maintained in a non-axenic environment and, thus, a number of bacterial species are present, of which six have been isolated from an amoeba polyclonal in vitro culture using single colony purification, and identified to the genus level by biochemical testing and 16S rRNA sequencing (McCarthy et al., Reference McCarthy, Hall, Schrittwieser, Ho, Collins, Feehan, Simons and White2015). These bacterial isolates were related to the genera Pseudomonas spp. (closest GenBank BLAST matches: JX144945, KF317743, KJ769212 and FJ210842), Marinomonas sp. (Marinomonas foliarum, NR116234) and Flavobacterium sp. (AJ244702) (McCarthy et al., Reference McCarthy, Hall, Schrittwieser, Ho, Collins, Feehan, Simons and White2015).
In this study, the effect on P. perurans population growth, in vitro, at two different temperatures relevant to Scottish salmon aquaculture, 10 and 15 °C, was assessed using two different amoeba clonal cultures (i.e. B8, CE6) and a polyclonal (G) culture (Collins et al., Reference Collins, Hall, Bruno, Sokolowska, Duncan, Yuecel, McCarthy, Fordyce, Pert, McIntosh and MacKay2017) maintained at the MSS Marine Laboratory. In addition, due to the potential role that the associated bacterial community can play in amoebae growth, an attempt was also made, by applying a 16S rRNA gene MiSeq analysis to the samples of the temperature experiment, to resolve the complex microbiota composition present in the different cultures, and the effect if any, of maintenance at 10 and 15 °C. These data could potentially inform further experiments on functional relationships of the microbiota with P. perurans growth.
Materials and methods
Amoeba culture
P. perurans polyclonal and monoclonal amoebae cultures were originally isolated from gills of infected farmed Atlantic salmon from the west coast of Scotland as described in Collins et al. (Reference Collins, Hall, Bruno, Sokolowska, Duncan, Yuecel, McCarthy, Fordyce, Pert, McIntosh and MacKay2017). The amoebae were cultivated at 10 and 15 °C in small Petri dishes containing a 5 mL underlay of malt yeast agar (MYA) (0.05 g malt extract, 0.05 g yeast extract, 10 g bacteriological agar, 500 mL of 35 ppt filtered seawater), with approximately 7 mL overlay of 35 ppt filtered sterilized seawater. Stericup® Filter Units (© EMD Millipore Corporation, Billerica, MA, USA, 2014) with a 0.22 µm pore size were used to filter the seawater, sourced from the North Sea (ca. 35 ppt salinity). Cultures were maintained in a non-axenic environment containing different bacterial strains probably isolated with amoebae from gills during culture establishment, as previously described by Collins et al. (Reference Collins, Hall, Bruno, Sokolowska, Duncan, Yuecel, McCarthy, Fordyce, Pert, McIntosh and MacKay2017), and no antibiotics were used during the culture.
Effect of temperature on P. perurans population growth in vitro
The in vitro experiment was performed with three different P. perurans cultures, a polyclonal culture named ‘G’ and two derived clonal cultures ‘B8’ and ‘CE6’ (Collins et al., Reference Collins, Hall, Bruno, Sokolowska, Duncan, Yuecel, McCarthy, Fordyce, Pert, McIntosh and MacKay2017). These clonal cultures showed differences in virulence, in terms of number of gill lesions, in a previous study (B8 generated higher average gill score and CE6 a lower score) (Collins et al., Reference Collins, Hall, Bruno, Sokolowska, Duncan, Yuecel, McCarthy, Fordyce, Pert, McIntosh and MacKay2017). The amoeba cultures, which were prior maintained for 2 years at 15 °C, were acclimatized at the two different temperatures used in the in vitro growth study (10 and 15 °C) for 3 months before starting the experiment. Four passages of the cultures were performed over this time to maintain their survival until the start of the experiment. The choice of number of replicates (n = 8) and vessel (T-25 cell culture flasks, Greiner CELLSTAR®, Sigma-Aldrich®, UK) was based on the results of two preliminary experiments to enable power analysis. Amoeba cultures of the same clonal type were initially pooled and mixed in a larger T-175 cell culture flask (Greiner CELLSTAR®, Sigma-Aldrich®, UK) to avoid differences that might have arisen during the 3 months of acclimatization, one flask for each culture and temperature, respectively. The amoebae were then distributed to each technical replicate (n = 8) with a starting number of ca. 10 amoebae per T-25 flask (n = 10, biological replicates). The same medium (MYA 35 ppt) and filtered seawater (35 ppt) were used for preparing all the flasks for the experiment. Counts of attached amoebae and amoebae suspended in the seawater overlay, in flasks maintained at 10 and 15 °C, were taken on a daily basis for 21 days. To count the amoebae in suspension (un-attached amoebae), flasks were first gently agitated to mix suspended amoebae but to minimize detaching amoebae from the agar surface, and then placed vertically. From each flask, 100 µL samples were taken in triplicate for counting in 96-well plates. The neutral red assay was used to determine viability of suspended (non-attached) amoebae. Briefly, 0.35 µL of filtered neutral red (Sigma-Aldrich®, UK) solution (25 mg mL−1 in PBS) was added to the 100 µL aliquots of amoeba cultures. After 30 min to allow neutral red uptake, amoebae were centrifuged at 2200 g for 10 min, the supernatant was removed and amoebae re-suspended in 100 µL of sterilized seawater (35 ppt). Counts of viable amoebae were performed in triplicate in 96-well plates at a 1:10 dilution in 100 µL under a microscope (10×). The counting of amoebae attached to the MYA was performed on pictures captured with a camera mounted on the microscope (10×, Olympus camera model CKX41 with adaptors – Canon EOS 700D mounted on the trinocular tube with an Olympus U-TV1X-2 mount and U-TMAD and T-EOS), which were taken immediately after the 100 µL aliquot was collected, and was always performed in the same 3 cm2 region at the centre of the flasks, for accurate comparisons. Every 2 days, 200 µL of sterile seawater (35 ppt) was added into the flasks to compensate for evaporation and samples taken for counting, to maintain a constant volume of seawater over the experimental period.
Analysis of count data
The null-hypothesis for count data analyses aims to test for the absence of a difference in growth of each clonal culture between 10 and 15 °C over 21 days. Each culture count dataset was analysed separately for the attached and un-attached amoebae, using the R Statistical Environment (Ihaka and Gentleman, Reference Ihaka and Gentleman1996). The Poisson generalized linear model (GLM) is typically used in regression analysis of count data in R. However, due to an increase of the mean of the variance of response variables over time (overdispersion), a GLM with a negative binomial distribution in the MASS library was applied to all the growth rate analyses with the function glm.nb (R software, 3.0.1). The negative binomial distribution was determined to be the more appropriate model for all the count data analyses based on outcomes from the following downstream analyses: (1) the comparison of the nested models using the anova command, which applies a series of analysis of deviance tests and (2) the validation of the models with a figure containing diagnostic plots. Models were validated when (1) the residuals against fitted values graph did not represent a structure or pattern in the plot (heteroscedasticity); (2) the normal quantile–quantile plot graph was a straight line if the errors were normally distributed; (3) the square root of the standardized residuals against the fitted value graph did not represent a structure or pattern in the plot, similar to the first plot and (4) standardized residuals as a function of leverage, along with Cook's distance (combination of leverage and residuals in a single measure) for each of the observed values of the response variable, did not show a pronounced pattern (Crawley, Reference Crawley2007). The logarithmic link function (link = ‘log’), used in both the quasi-Poisson GLM and the negative binomial GLM for results’ comparisons, ensured that all the fitted values were positive.
DNA extraction for characterization of microbial communities
To better interpret any differences in growth rate found among amoeba cultures, it was decided to characterize the microbial communities present in the different cultures and at the two different temperatures (10 and 15 °C). At the beginning of the in vitro amoeba population growth experiment, a ‘negative control’ was also set up for each temperature and each amoebae culture, i.e. flasks containing the respective culture medium filtered through a 3.0 µm pore size Cyclopore™ Track Etched Membrane (GE Healthcare, Whatman, UK), in order to separate out the amoebae but retain the culture bacteria. Amoeba cultures and the ‘negative control’ were cultured in the same way to have a similar volume/dilution of medium to each flask. Four replicates were used to verify the homogeneity of microbial communities among samples of the same culture type and temperature. At the end of the in vitro experiment, 200 µL of well mixed amoeba culture containing bacteria (hereafter referred to as ‘samples’) (n = 8 per culture × temperature combination) and 200 µL of ‘negative control’ medium (hereafter referred to as ‘medium’) (n = 4 per negative control × temperature combination) were taken for the characterization of the microbial communities in the amoeba cultures. Samples and medium aliquots were centrifuged at 2200 g for 10 min, the supernatant was removed and the pellet stored at −80 °C until DNA extraction. Four out of eight different technical replicates of the ‘samples’ and all four technical replicates of the ‘medium’ per culture and temperature were used for DNA extraction and downstream analyses. Briefly, 0.5 mL of pre-heated (65 °C) sodium dodecyl sulfate (SDS) lysis buffer (0.7 m NaCl, 0.1 m Na2SO3, 0.1 m Tris HCl (pH 7.5), 0.05 m EDTA (pH 8), 1% SDS, autoclaved) was added to the pellet. After gentle mixing, the SDS extraction buffer and the pellet were transferred into 2 mL tubes containing lysing matrix B (MP Biomedicals) and 0.5 mL of UltraPure™ phenol:chloroform:isoamyl alcohol (25:24:1, v/v) (ThermoFisher Scientific, UK) was added to the tubes. The tubes were then placed in a Hybaid Ribolyser™ Cell Disrupter (Hybaid) at a speed setting of 4.0 for 30 s and cooled on ice for 1 min. Cell debris was removed by centrifugation (11 000 g for 15 min at 4 °C), and the extracted aqueous layer was mixed with an equal volume of chloroform:isoamyl alcohol (24:1, v/v). After centrifugation at 16 000 g for 15 min at 4 °C, the aqueous layer was transferred to a fresh tube and the DNA was precipitated by adding two volumes of 30% polyethylene glycol 6000 solution in 1.6 m NaCl (sterilized by autoclaving) and 2 µL of linear acrylamide (5 mg mL−1, ThermoFisher Scientific, UK). Samples were incubated for 3 h on ice and then centrifuged at 11 000 g for 30 min at 4 °C. The pellet was washed with 1 mL ice cold 70% ethanol and re-suspended in 20 µL of Tris-EDTA buffer (Sigma-Aldrich®, UK) and the purity was checked on a NanoDrop ND-1000 Spectrophotometer (PEQLAB GmbH, Germany).
Next-generation sequencing (NGS) of microbial communities
Illumina MiSeq sequencing of the bacterial 16S rRNA genes was performed for samples and medium (four technical replicates each) for the three cultures (B8, CE6 and G) kept at the two different temperatures (10 and 15 °C) for 21 days. In total, 48 DNA samples were sequenced. Genomic DNA samples were submitted to the Research and Testing Laboratory Genomics (RTL Genomics, Lubbock, TX, USA) for next-generation Illumina MiSeq sequencing of the bacterial 16S rRNA genes. A detailed protocol is given in the Supplementary Materials. For this study, it was chosen to amplify the V1–V2 region using the 28f (5′-GAG TTT GAT CNT GGC TCA G-3′) (Handl et al., Reference Handl, Dowd, Garcia-Mazcorro, Steiner and Suchodolski2011) and the 388r (5′-TGC TGC CTC CCG TAG GAG T-3′) (Francés et al., Reference Francés, Benlloch, Zapater, González, Lozano, Muñoz, Pascual, Casellas, Uceda, Palazón, Carnicer, Pérez-Mateo and Such2004) primers based on available assays at RTL Genomics, and on their advice based on their annotated internal database to classify sequences. Briefly, amplifications were performed in 25 µL reactions with Qiagen HotStar Taq master mix (Qiagen Inc., Valencia, CA, USA), 1 µL of each 5 µ m primer and 1 µL of template. Reactions were performed on ABI Veriti thermocyclers (Applied Biosystems, Carlsbad, CA, USA) using the following thermal profile: 95 °C for 5 min, then 25 cycles of 94 °C for 30 s, 54 °C for 40 s, 72 °C for 1 min, followed by one cycle of 72 °C for 10 min and a 4 °C hold. A second PCR was also performed and the amplification products visualized with eGels (Life Technologies, Grand Island, New York). Generated sequences were processed and quality checked by the RTL Genomics data analysis pipeline. The sequence reads were then sorted by length from the longest to the shortest and clustered into operational taxonomic units (OTUs) at a 4% divergence using the USEARCH clustering algorithms (Edgar, Reference Edgar2010) to prefix dereplication. OTU selection was performed using the UPARSE OTU selection algorithm (clustering method in USEARCH) (Edgar, Reference Edgar2013) to classify the large number of clusters into OTUs and chimera checking was performed using the UCHIME chimera detection software (Edgar et al., Reference Edgar, Haas, Clemente, Quince and Knight2011). Taxonomic identifications were made by comparing the OTU sequences against a database of high-quality sequences derived from the NCBI database using the Ribosomal Database Project (RDP) Classifier (Wang et al., Reference Wang, Garrity, Tiedje and Cole2007). The term ‘unknown’ was assigned when the algorithm was not able to make a confident determination of the taxonomic classification at a certain level (number of matching taxonomic levels/number of total taxonomic levels >51%). The data were analysed by RTL Genomics using R software (3.0.1). Generation of a rarefaction curve plot of the number of OTUs vs the number of sequences and the Chao1 Richness and Shannon Diversity indices were performed. Measures of diversity were screened for group differences using analysis of variance (ANOVA). Individual OTUs were examined for significant changes between genera and barplots were generated using OTU relative abundances with a sum to 100%. A heatmap was generated to visualize the relative abundances of the most predominant bacterial genera, where the samples and bacterial genera were sorted according to Euclidean metrics and weighted (a quantitative measure suited to revealing community differences that are due to changes in relative taxon abundance) using the phylogenetic distances (Unifrac method). Multivariate differences among groups were evaluated using the ‘Permutational Multivariate Analysis of Variance Using Distance Matrices’ function adonis, where distances among samples were calculated using un-weighted (presence/absence of OTUs) or weighted (relative abundance of OTUs) UniFrac distances (Lozupone et al., Reference Lozupone, Lladser, Knights, Stombaugh and Knight2011) using the phyloseq package (McMurdie and Holmes, Reference McMurdie and Holmes2013) in R (software 3.0.1). Principal Coordinates Analysis (PCoA) was conducted and plotted from weighted and un-weighted UniFrac distances.
Results
Effect of temperature on P. perurans population growth in vitro
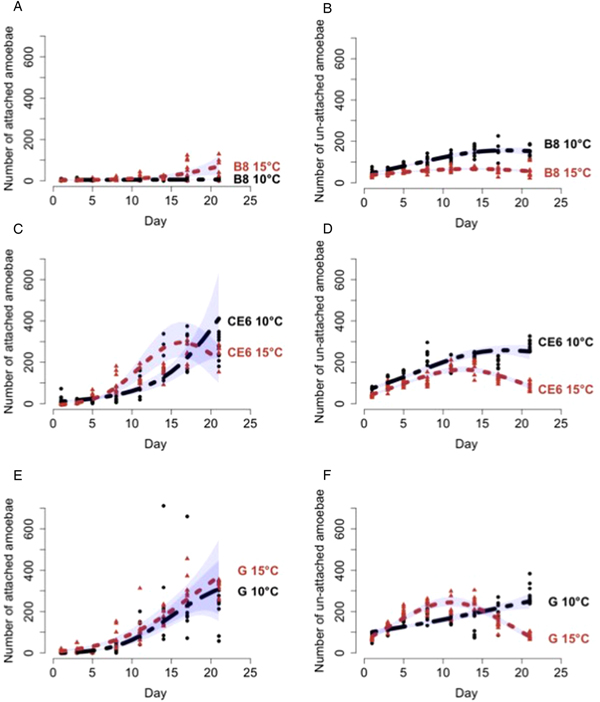
The null-hypothesis was to test whether a difference in growth of each culture was seen between 10 and 15 °C over 21 days and to test this hypothesis each culture was analysed separately for the attached and un-attached amoebae count data (see Supplementary Materials for models’ details). At the end of the in vitro experiment the number of B8 attached amoebae was higher at 15 °C than at 10 °C (Fig. 1A). An opposite trend was shown with the number of B8 un-attached amoebae, where higher values were detected at 10 °C than at 15 °C (Fig. 1B). B8 attached and un-attached amoebae count data results showed a significant difference between the two temperatures (P ⩽ 0.001 and P ⩽ 0.05, respectively, n = 128). Based on the attached and un-attached CE6 amoebae count data, the model output again showed significant differences in population growth between the two temperatures (10 and 15 °C) over 21 days (P ⩽ 0.001, n = 128) (Figs 1C and D). For the attached G count data, the model output showed a significant difference between the two temperatures (P ⩽ 0.001, n = 128) that was greater than the relationship between the two temperatures over time (P ⩽ 0.05, n = 128). In fact, the graph shows a similar trend of count data of attached amoebae for both temperatures (Fig. 1E). While, the best fitting model for the G culture un-attached count data (Fig. 1F) showed a significant difference between the two temperatures over time (P ⩽ 0.001, n = 128).
Growth curves of P. perurans culture. Model interpretation using a predict function on the original scale for the B8, CE6 and G cultures at 10 °C (dark black line) and 15 °C (light red line) ± 95% confidence interval (CI) (blue polygon). The number of attached amoebae were counted in an area of 3 cm2 (A, C, E). The number of viable un-attached amoebae were counted in a 1:10 dilution in 100 µL (B, D, F), viability assessed using the neutral red assay.

Lastly, it was decided to test that there was no difference in growth among B8, CE6 and G cultures at 10 and 15 °C over 21 days, analysing separately attached and un-attached amoebae as done in the previous growth rate analyses. The model output for 10 °C attached amoebae count data showed that B8 and CE6 growth rates were significantly different (P ⩽ 0.01, n = 128), CE6 and G growth rates were significantly different (P ⩽ 0.001, n = 192) and B8 and G growth rates were significantly different over time (P ⩽ 0.01, n = 192). At 15 °C attached amoebae count data showed a similar trend for B8 and G cultures which increased over time even if at a different magnitude, while CE6 count data numbers started to decrease after 15 days. The model output for 15 °C attached amoebae count data showed significant differences between the CE6 and G count data and between the G and B8 count data (P ⩽ 0.001, n = 192), while the B8 and CE6 count data showed a significant difference only over time (P ⩽ 0.001, n = 192). Un-attached amoebae count data showed an increasing trend at 10 °C over time for all cultures with significant differences among the different cultures (P ⩽ 0.001 between B8 and CE6 count data and between B8 and G count data, P ⩽ 0.01 between CE6 and G count data, n = 192), while at 15 °C un-attached count data numbers started to decrease after 10 days in all the different cultures. The model output for 15 °C un-attached amoebae count data showed a significant difference between the G and CE6 count data (P ⩽ 0.001, n = 192) and between the G and B8 count data (P ⩽ 0.001, n = 192), whereas the difference between the CE6 and B8 count data was significant only over time (P ⩽ 0.001, n = 192).
NGS of microbial communities
Firstly, the species richness was assessed from the results with rarefaction curves using the UPARSE pipeline (Edgar, Reference Edgar2013). The rarefaction curves demonstrated that when the number of sequence reads increased, the species richness rose considerably with each sample (Supplementary Fig. S1). The alpha diversity (within sample diversity) demonstrated by the rarefaction curves also showed that the culture samples and medium reached an asymptote, indicative of adequate reads to robustly report on species composition of each sample, allowing for the comparison of the experimental samples.
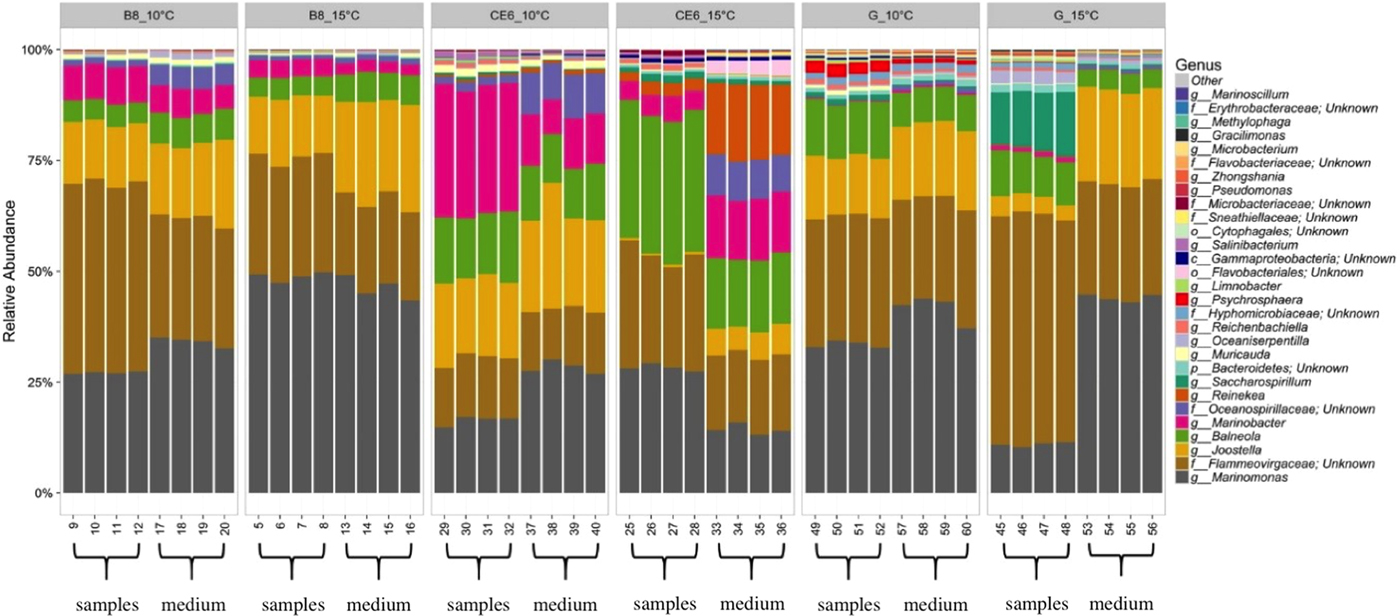
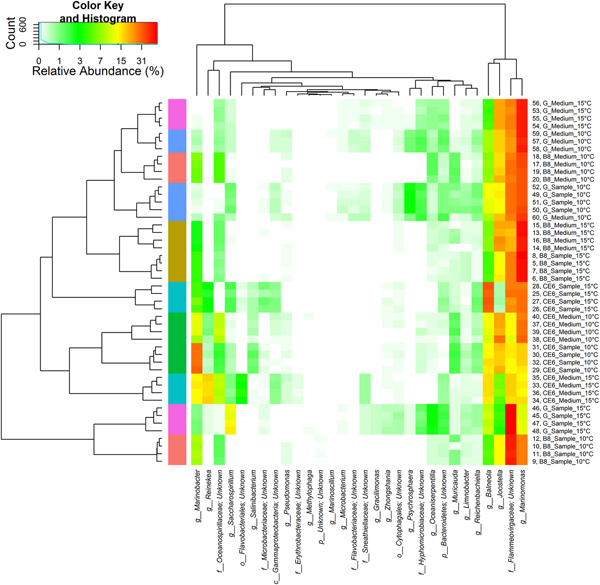
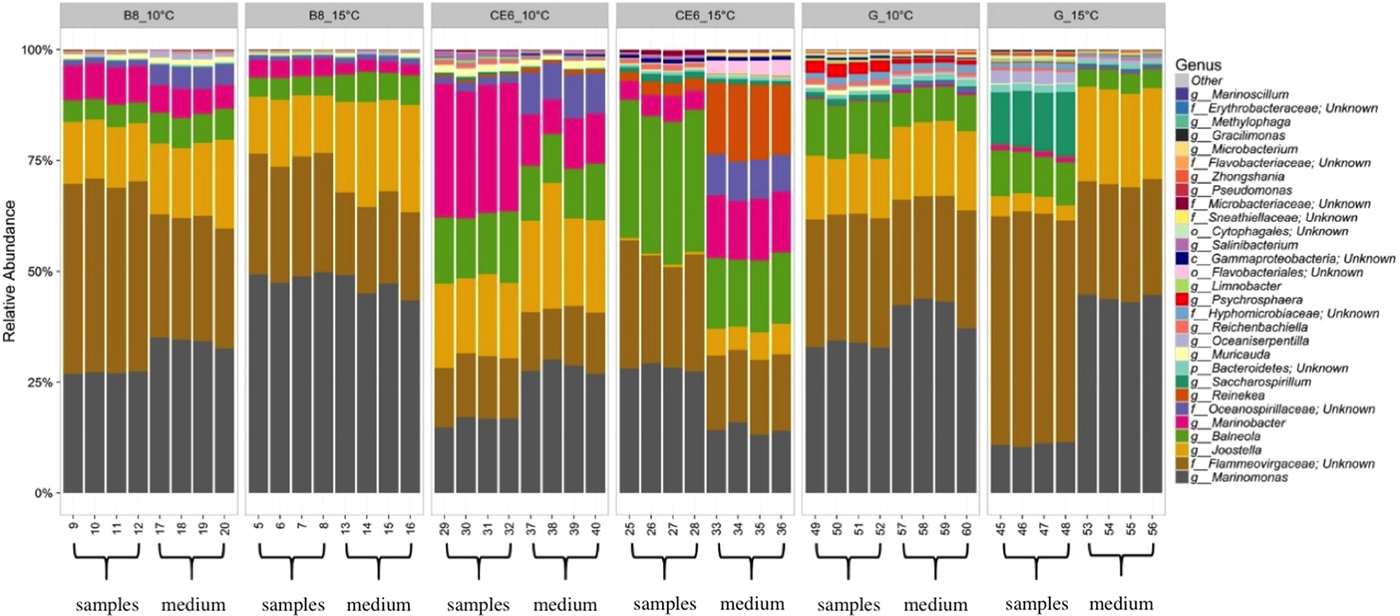
Individual OTUs were used to examine for significant changes in genera/families, and the relative abundances of OTUs were used to determine the 30 most predominant genera/families in all samples (Fig. 2). A heatmap was generated to visualize the relative abundances of the 30 most predominant bacterial genera/families (Fig. 3). The heatmap and the barplots showed that the four technical replicates (per sample/medium) had similar profiles in terms of genera composition, reflecting the limited source of variation related to the random noise associated with different flasks and environmental bacterial contamination (Figs 2 and 3). The heatmap also showed that most of the sample/medium for each amoeba clonal culture did not closely group together in a cluster analysis, with the exception of the B8 sample/medium at 15 °C and CE6 sample/medium at 10 °C (Fig. 3). These clustering differences reflected a change between the culture and the medium for some cultures and it also clearly showed differences between temperatures in the same cultures. The most abundant phyla of the overall microbiome were assigned to Proteobacteria, Bacteroidetes and Actinobacteria. Marinomonas sp. (Proteobacteria), Flammeovirgaceae/‘unknown’ (Bacteroidetes), Joostella sp. (Bacteroidetes), Balneola sp. (Bacteroidetes) and Marinobacter sp. (Proteobacteria) were the most abundant genera/families found in the microbiome among all cultures and temperatures, indicating a predominance of Gram-negative bacteria in the amoeba cultures (Figs 2 and 3). The most abundant Gram-positive bacteria were represented by the Microbacteriaceae family (Salinibacterium sp. and Microbacterium sp., phylum Actinobacteria) (Figs 2 and 3).
Relative abundance of the 30 most dominant genera in all samples, grouped by culture type (medium and samples) and temperature (10 and 15 °C). The ‘unknown’ taxonomic information was assigned when the algorithm was not able to make a confident determination of the taxonomic classification at a certain level (number of matching taxa/number of total taxa >51%). Sample: culture containing amoebae. Medium: culture without amoebae (‘negative control’).
Heatmap of relative abundances of the 30 most dominant bacterial genera by type. Samples/medium and bacteria were sorted based on weighted UniFrac and Euclidean distances, respectively. Sample: culture containing amoebae. Medium: culture without amoebae (‘negative control’). The x axis shows the relative abundance (%) of the different genera in each sample/medium for each culture and temperature; on the y axis the different colours show the clustering differences between the cultures and the samples/medium for each culture and temperature.

Differences in the microbiota between sample and medium of the two clonal cultures, which showed lowest and highest differences in virulence in the Collins et al. (Reference Collins, Hall, Bruno, Sokolowska, Duncan, Yuecel, McCarthy, Fordyce, Pert, McIntosh and MacKay2017) study were as follows: compared with their respective medium controls at 10 °C Marinobacter sp. and Flammeovirgaceae had higher abundance in CE6 and B8 cultures, respectively, whereas Oceanospirilaceae and Marinomonas sp. in the CE6 samples, and Joostella sp., Oceanospirilaceae and Balneola sp. in the B8 samples, showed lower abundance. Compared with their respective medium controls at 15 °C, Salinibacterium sp., Microbacteriaceae, Reichenbachiella sp., Balneola sp., Flammeovirgaceae and Marinomonas sp. abundance all increased in the CE6 cultures, while Joostella sp., Sneathiellaceae, Erythrobacteraceae, Pseudomonas sp., Flavobacteriales and Oceanospirilaceae decreased. As for 10 °C, in the B8 cultures Flammeovirgaceae increased and, Joostella sp. and Balneola sp. abundance was seen to decrease compared with medium controls. Cytophagales sp. abundance was also seen to decrease at 15 °C in the B8 cultures compared with medium controls not containing amoebae.
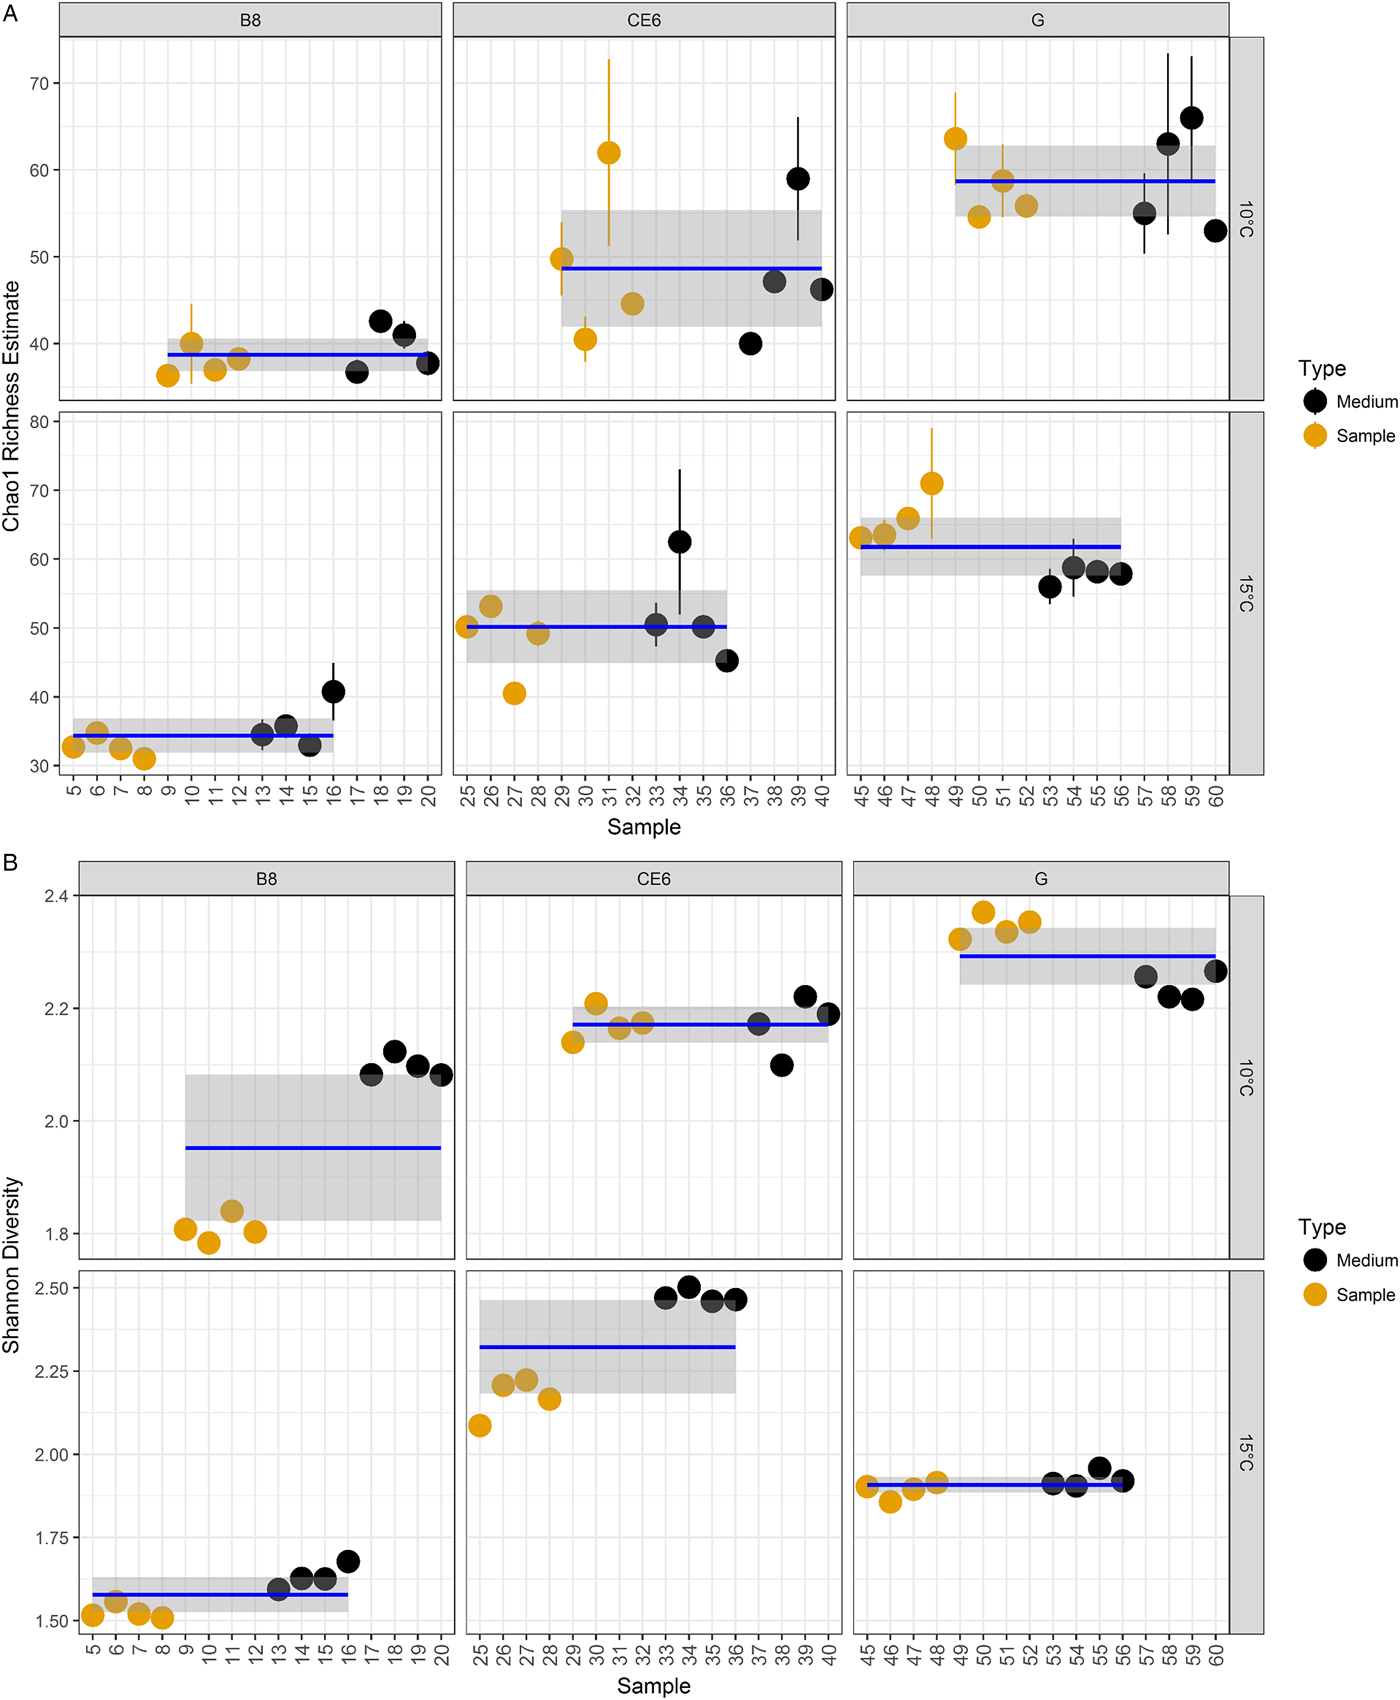
Diversity measures were examined in terms of (1) overall richness (i.e. number of distinct organisms expressed as OTUs present within the microbiome) quantified using the Chao1 richness estimator (Fig. 4A), and (2) overall diversity (i.e. the distribution of abundance among distinct taxa) expressed as Shannon diversity index (H′) (Fig. 4B). The Chao1 richness estimator showed the highest levels of overall richness in the G culture at both temperatures, while the B8 clonal culture showed the lowest overall richness (Fig. 4A), indicating a higher number of different bacterial genera/families in the polyclonal culture compared with the B8 and the CE6 clonal cultures. In terms of overall diversity, a lower H′ was shown by the B8 clonal culture at both temperatures, while the G culture had the highest H′ index at 10 °C and the CE6 clonal culture at 15 °C (Fig. 4B). This indicates that the relative abundance of different bacterial genera/families was more evenly distributed in the CE6 and G cultures, compared with the B8 culture where most of the bacteria belonged to fewer dominant genera/families. ANOVA results showed that differences in terms of Chao1 richness and H′ index among cultures were significant (CE6, B8 and G) (P ⩽ 0.001, n = 48). The B8 clonal culture was the only one showing a significant difference in Chao1 richness between the two temperatures (P ⩽ 0.01, n = 16) but not between culture types (samples/medium) (P > 0.05, n = 16). The H′ index was statistically significant between the two temperatures and culture type for the B8 (P ⩽ 0.001, n = 16) and the CE6 cultures (P ⩽ 0.01, n = 16), while the G culture showed a significantly different H′ index just between the two temperatures (P ⩽ 0.001, n = 16). The results indicate that the presence of bacterial genera/families in all cultures grow preferentially at 10 or 15 °C, with changes in their relative abundance between the two temperatures. The differences in the H′ index between the sample and medium indicate that the presence of amoebae changed the relative abundance of certain bacterial genera/families.
Measures of richness and diversity. (A) Chao1 richness within the total microbiome data, coloured by type, grouped by temperature and culture type (mean value ± 95% CI). (B) Shannon diversity within the total microbiome data, coloured by type, grouped by temperature and culture type (mean value ± 95% CI). Sample: culture containing amoebae. Medium: culture without amoebae (‘negative control’).

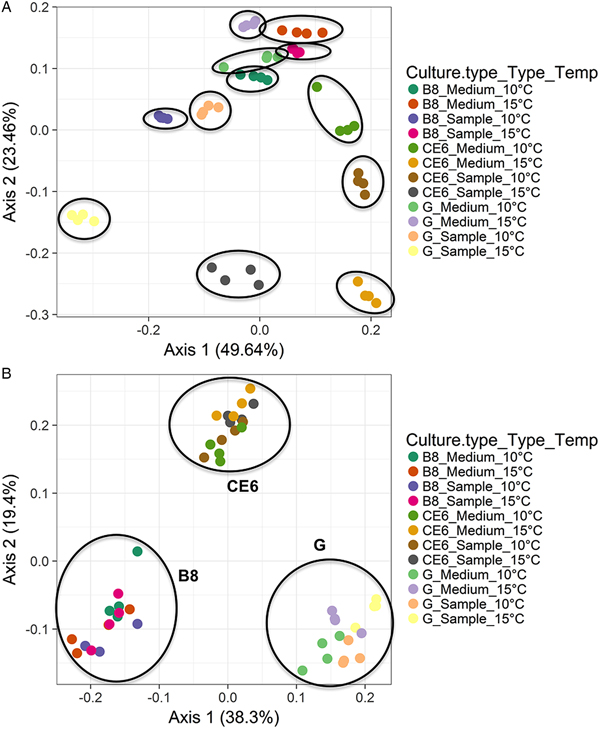
UniFrac, coupled with standard multivariate statistical techniques including PCoA, identifies factors explaining differences among microbial communities (Lozupone et al., Reference Lozupone, Lladser, Knights, Stombaugh and Knight2011). PCoA transforms the distance matrix into a new set of orthogonal axes where the first axis (axis 1) can be used to explain the maximum amount of variation present in the dataset, followed by the second axis (axis 2). PCoA based on un-weighted UniFrac distances (not considering the relative abundance of OTUs) revealed that all cultures (CE6, B8 and G) formed distinct groups (Fig. 5A). Results of the multivariate analysis with the function adonis showed a significant difference among cultures (P ⩽ 0.001, n = 48) but not in the interaction between the temperature (10 and 15 °C) and culture types (medium and samples) in each culture (P > 0.05) indicating that differences existed in the bacterial genera/families between the different cultures and that temperature and P. perurans presence did not significantly change the presence of different genera/families within the different cultures. Weighted (taking relative abundance of OTUs into account) UniFrac distances showed distinct groups among all culture types and temperatures (Fig. 5B), which was also reflected in the adonis results, including the interaction terms (P ⩽ 0.001, n = 48), indicating that temperature and presence of amoebae both significantly affected the relative abundance of bacterial genera/families in the cultures.
PCoA of beta diversity based on un-weighted Unifrac distances (A) and on weighted Unifrac distances (B). Sample: culture containing amoebae. Medium: culture without amoebae (‘negative control’). (A) PCoA based on un-weighted UniFrac distances (not considering the relative abundance of OTUs) revealed that all cultures (CE6, B8 and G) formed distinct groups (circles), and were significantly different (P ⩽ 0.001, n = 48). (B) PCoA based on weighted (taking relative abundance of OTUs into account) UniFrac distances showed distinct groups among all culture types and temperatures (circles), and were significantly different (P ⩽ 0.001, n = 48).

Discussion
In this study, an in vitro approach was used to gain a better understanding of the effect on P. perurans population growth of two different temperatures, 10 and 15 °C, relevant to the European Atlantic salmon industry to inform future risk assessments. Three different cultures were used and counts were performed on amoebae attached to the MYA and on un-attached amoebae to better mimic a natural situation on the gills (i.e. amoebae attached to the gills or suspended in adjacent seawater). All cultures (G, B8 and CE6) showed a significant difference in amoebae numbers between the two temperatures at 21 days post culture seeding; both for the attached and un-attached amoebae count data. Moreover, a comparison among the different cultures also showed significant differences for the attached and un-attached amoebae at both temperatures.
The results of a previous in vivo challenge study (terminated at 21 days post infection) showed difference in virulence for the amoeba cultures used here, in terms of the ability to generate gill lesions on the host, with B8 showing the highest virulence and CE6 the lowest (Collins et al., Reference Collins, Hall, Bruno, Sokolowska, Duncan, Yuecel, McCarthy, Fordyce, Pert, McIntosh and MacKay2017), suggesting that these differences in virulence between the amoeba cultures may be linked to factors influencing amoebae numbers, such as growth rate and/or attachment ability. However, in the current in vitro study, B8 attached and un-attached amoebae showed lower count values in comparison with G and CE6 cultures at the two temperatures. Nevertheless, attached and un-attached amoebae counts were stable or increasing in vitro at 21 days post seeding in the B8 culture, at 10 and 15 °C, while decreasing at 15 °C for both attached and unattached CE6 culture amoebae at day 21. Reasons for differences in B8 and CE6 amoebae numbers, and associated virulence, seen between the in vivo and in vitro studies are not known. The CE6 amoebae numbers were decreasing by day 21 in the in vitro study, and perhaps this represents a falloff in CE6 numbers at day 21 in vivo also, as in vivo sampling in Collins et al. (Reference Collins, Hall, Bruno, Sokolowska, Duncan, Yuecel, McCarthy, Fordyce, Pert, McIntosh and MacKay2017) did not occur prior to day 21. It has been shown that P. perurans cultures can also change over time (Bridle et al., Reference Bridle, Davenport, Crosbie, Polinski and Nowak2015), therefore different results might have been generated if freshly isolated or older cultures were used for both in vitro and in vivo experiments. Alternatively, if the in vitro experimental period was extended, a decrease in amoebae numbers may also have been observed in the B8 culture due to toxic metabolites building up in the enclosed flask system. Growth characteristics in vitro of different cultures also may not be representative of grow characteristics in vivo, in the presence of host nutrients/environment, at least for some P. perurans strains. The differences in virulence between B8 and CE6 cultures (Collins et al., Reference Collins, Hall, Bruno, Sokolowska, Duncan, Yuecel, McCarthy, Fordyce, Pert, McIntosh and MacKay2017) may also be due to factors or activities particular to B8, not related to attachment or increase in amoebae numbers. What is clear from both the study here and that of Collins et al. (Reference Collins, Hall, Bruno, Sokolowska, Duncan, Yuecel, McCarthy, Fordyce, Pert, McIntosh and MacKay2017) is that P. perurans clones/cultures can differ in their growth and virulence properties, but the reasons for these differences are complex (Douglas-Helders et al., Reference Douglas-Helders, Nowak and Butler2005; Bridle et al., Reference Bridle, Davenport, Crosbie, Polinski and Nowak2015).
One factor which may have influenced both growth and virulence of P. perurans cultures is their associated microbial community (Jellett and Scheibling, Reference Jellett and Scheibling1988; Paniagua et al., Reference Paniagua, Parama, Iglesias, Sanmartin and Leiro2001; Burgess and Petri, Reference Burgess and Petri2016), as P. perurans cultures were maintained in the laboratory under non-axenic conditions. To study this, next-generation Illumina MiSeq sequencing was performed at the end of the in vitro experiment for samples and filtered medium of the three cultures (G, B8 and CE6) to investigate the complexity of the microbial community in each culture. A predominance of Gram-negative bacteria was found in the amoebae cultures as also seen by McCarthy et al. (Reference McCarthy, Hall, Schrittwieser, Ho, Collins, Feehan, Simons and White2015). In Tasmania, a culture-independent 16S rRNA gene-based approach identified the genus Psychroserpens spp. (family Flavobacteriaceae, phylum Bacteroidetes) as gill bacteria associated with AGD in Atlantic salmon (Bowman and Nowak, Reference Bowman and Nowak2004), while a study using a culture-dependent approach found the genera Winogradskyella spp. (family Flavobacteriaceae, phylum Bacteroidetes) and Staphylococcus spp. (family Staphylococcaceae, phylum Firmicutes) associated with AGD (Embar-Gopinath et al., Reference Embar-Gopinath, Bowman, Carson, Crosbie and Nowak2008). In the current study, other genera belonging to the Flavobacteriaceae family were found (Joostella sp. and Muricauda sp.), potentially showing a difference in the microbial community dependent on the seawater area of sampling.
Chao1 richness estimator showed the highest levels of overall richness in the G culture at both temperatures, while richness in the B8 clonal culture was the lowest. B8 and CE6 are clonal cultures isolated from the polyclonal G (Collins et al., Reference Collins, Hall, Bruno, Sokolowska, Duncan, Yuecel, McCarthy, Fordyce, Pert, McIntosh and MacKay2017) culture; therefore, the single amoeba cell sorting may have also reduced the selection of the bacterial community. These results could offer one explanation for the lower amoebae numbers in the B8 attached and un-attached amoebae count data in comparison with the G and CE6 cultures at both temperatures, in that preferred bacterial prey species may be absent or in lower abundance in this culture (e.g. Balneola sp. in comparison with G and CE6 cultures). Chao1 richness ANOVA results were not significantly different between the sample and filtered medium, indicating that the microbial community present was not dependent on the presence or absence of P. perurans for their survival. The B8 clonal culture was the only one showing a significant difference in richness between the two temperatures with a lower value for 15 °C, indicating a possible presence of bacterial genera/families unable to survive or grow at this temperature, which in turn may have contributed to changes in B8 amoebae growth. However, the Shannon diversity index (H′) (combining measures of richness and abundance) ANOVA results showed significant differences between the two temperatures and between the culture type (sample/medium) for B8 and CE6, while G sample/medium cultures showed a significantly different H′ index for temperature only – i.e. the presence of P. perurans did not influence relative abundance of bacteria. A differential effect of temperature (10 and 15 °C) alone on the growth of certain bacterial genera/families, was observed in all cultures, as evidenced by significant changes in their abundance (H′ index) between the medium samples at the end of the experimental period. This could underlie the significant differences in P. perurans population numbers over 21 days found between temperatures for each culture, in both attached and un-attached count data, as a preferential distribution of abundance among distinct bacterial taxa (representing prey or inhibitors/enhancers of amoebae growth) related to temperature. Interestingly, the results of the multivariate analysis of variance (adonis) showed significant differences among all culture types (sample/medium) and temperatures only in the weighted UniFrac distance analysis, while the un-weighted UniFrac distance analysis showed significant differences among cultures but not in the interaction between temperature and culture type (for each culture). The results of un-weighted UniFrac distance analysis may again reflect the potential isolation of different bacterial taxa with single amoebae cells when establishing clonal cultures or it may reflect specific interactions with preferred bacterial genera/families by the different clonal P. perurans strains, which have changed bacterial compositions in culture over time. The results of weighted UniFrac distance analysis, using abundance as well as relatedness, indicate that the isolated bacterial genera/families have preferential growth temperatures – i.e. not all growing uniformly, and that the P. perurans amoebae have differential effects on the abundance of bacterial genera/families within their environment, either through preferential choice of prey species, or factors which inhibit or enhance certain bacteria. Therefore, the differences in virulence of these amoeba cultures shown by Collins et al. (Reference Collins, Hall, Bruno, Sokolowska, Duncan, Yuecel, McCarthy, Fordyce, Pert, McIntosh and MacKay2017) may be linked to the observed differences in bacterial composition between the P. perurans cultures, which in turn might have influenced amoebae number under different in vitro conditions in terms of growth rate and attachment ability. Balneola spp. were seen to differ between the CE6 and B8 cultures (of the top 30 most prominent bacterial genera/families detected), across both temperatures, in terms of decreasing abundance in samples with amoebae. However, it should be noted that some of the observed differences between sample and medium, i.e. absence/lower abundance in medium compared with the sample, may not be due to an effect of amoebae presence/absence, but due to loss of bacterial species which form clumps under the in vitro culture conditions, excluded during the filtering step.
In conclusion, this study showed that all P. perurans cultures showed a significant difference in population growth dynamics between the two temperatures over time, both for the attached and un-attached count data. It also showed that different clonal cultures, isolated from the same polyclonal culture, can differ significantly in their growth dynamics, and from the overall growth dynamics of the originating polyclonal culture. Their different growth dynamics under different conditions highlights the possibility of seasonal or regional selection of different amoeba strains, though other environmental factors may also be involved. Significant differences were found among the bacterial communities in the isolated P. perurans cultures used, which were reflected by significant differences in relative abundance of the 30 most prevalent bacteria genera/families. Their relative abundances changed with temperature and also with the presence of amoebae, indicating an interaction with the amoebae. Further targeted in vivo studies are required to help elucidate relationships, if any, between environmental factors (e.g. different temperatures, microbial environment) and P. perurans pathogenicity and AGD prevalence.
Supplementary material
The supplementary material for this article can be found at https://doi.org/10.1017/S0031182018001798.
Acknowledgements
The authors thank Dr Una McCarthy for reading of the manuscript and for invaluable advice regarding the amoebae in vitro experiment, and Dr Graeme Nicol for advice on the microbial communities experiment. The MiSeq data were generated by RTL Genomics, Lubbock, TX, USA.
Financial support
This work was supported by a PhD studentship from the Marine Collaboration Research Forum (MarCRF), which is a collaboration between the University of Aberdeen and Marine Scotland Science (MSS), Marine Laboratory, UK, and by Scottish Government project grant AQ0080.
Conflict of interest
None.
Ethical standards
Not applicable.