Most development spending is politically motivated, and in all countries incumbent politicians make decisions about its allocation. Consequently, a large literature studies the political factors that determine how such funds are allocated. To avoid all distributive spending being politically skewed, most countries have set aside a portion of their budget for ‘formula- or rules-based’ fund distribution.Footnote 1 While some scholars have focused on the politics of how these formulas or rules are established, it has generally been assumed that once they are in place, they are automatically followed. Furthermore, politically neutral rules – that is, rules under which fund distribution is not driven by constituency- or legislator-specific political factors – are not typically analyzed. As a result, the literature has largely overlooked the question of whether neutral spending rules lead to neutral spending.
However, this question is important to address for at least three reasons. First, countries set aside part of their budget for rules-based spending precisely to prevent politicized spending, but is that primary goal always achieved? Secondly, a rapidly growing literature focuses on how various rules-based development funds are spent by the politicians who have the money at their disposal for their constituencies. Such analyses are essentially the second step in the chain, since they implicitly assume that when there are rules in place for distributing resources, individual politicians necessarily receive their promised share. Finally, if there are discrepancies between the rules and actual distribution, what factors determine them?
This is a difficult issue to address empirically because most rules-based spending is not neutral, as has been extensively discussed in the literature (Banful Reference Banful2011; Boadway and Shah Reference Boadway and Shah2007). In other words, the rules themselves are politicized, and often complicated. However, I address this question using data from Pakistan, which had an ‘equal distribution’ constituency development fund (CDF) that ran from 1988 to 2013, allocating the same amount of money to every federal legislator to undertake small development projects in his or her constituency. The format of this fund allows me to directly investigate whether neutral rules led to neutral spending, which is not possible to study in many contexts.
Using a regression discontinuity design (RDD) in conjunction with the first comprehensive dataset on this CDF, I present strong evidence that ruling-party legislators were highly advantaged in terms of receiving these development resources, and opposition legislators were highly disadvantaged, especially within the close races that the RDD focuses on. On average, closely elected opposition legislators' allocation from the CDF was at least 25 percentage points lower in the more conservative estimates; this difference was as high as 80 percentage points in some specifications. This discontinuity translates to about 2.5 million (and 8 million, respectively) Pakistani rupees (PKR) fewer from a fund that distributed up to PKR 10 million per legislator annually (roughly $100,000 in 2013).Footnote 2 I also take into account other potentially relevant factors – such as legislator quality and experience, ideology of the ruling party, electoral competitiveness and turnout, timing of elections and electoral constituency fixed characteristics – and find that partisan bias is the most consistent and plausible explanation for the findings.
Though the CDF represents a relatively small part of the budget, as is the case with most formula-based development funds, it is nonetheless important for political credit claiming at the individual legislator level, since it is one of the few sources of project funding that can be directly associated with the specific legislator who undertook each project for her constituents.Footnote 3 In addition, these findings are potentially informative for a much broader set of countries. Formula-based spending, when not publicly released or audited by independent third parties, may have discrepancies between rules and spending, as Timmons and Broid (Reference Timmons and Broid2013) find in the case of Mexico. Though developing countries, especially those like Pakistan that have weak institutions and centralized control over such funds, are perhaps more likely to have low levels of transparency and low audits of such spending, that does not necessarily imply that formula-based spending is neutral elsewhere. This empirical question merits investigation, for the reasons mentioned above.
My findings build on and extend the distributive politics literature by focusing on a different aspect of development spending that pertains to formula-based politically neutral distribution rules. Empirically, much of this literature relies on associative evidence; my article also contributes in this regard by providing causal evidence of partisan bias in the distribution of development funds. In addition, I focus on the domestic politics of a strategically important yet understudied country, building on a small but growing literature on Pakistan's electoral politics (see, for example, Afzal Reference Afzal2014). Finally, the results have potential implications for how we think about electoral competition and long-term development patterns, which I discuss after presenting the main findings.
The article proceeds by discussing why rules-based spending is an important subset of distributive politics that should garner more empirical attention in the literature. I then outline the political context and specific development fund in Pakistan to establish its relevance as a suitable case for addressing the question at hand before introducing the data and research design. Next, the main results are presented and potential mechanisms for distortion discussed before delving in to competing and complementary mechanisms. The last section concludes.
Formula-Based Development Funds
There is a rich literature studying the influence of political factors, especially partisan bias, on distributive spending of all sorts. Though the extent of political factors driving development resource allocation varies across countries, in most contexts such spending is inherently political. For instance, though developed countries tend to have less partisan bias, on average (Albouy Reference Albouy2013; Balla et al. Reference Balla2002; Berry, Burden and Howell Reference Berry, Burden and Howell2010; Levitt and Poterba Reference Levitt and Poterba1999; Solé-Ollé and Sorribas-Navarro Reference Solé-Ollé and Sorribas-Navarro2008), there are still some differences, especially within specific sectors, administrations or political parties (Ansolabehere and Snyder Reference Ansolabehere and Snyder2006; Lazarus Reference Lazarus2010; Lee Reference Lee2003). Politically skewed spending is generally much higher in developing countries (Arulampalam et al. Reference Arulampalam2009; Keefer and Khemani Reference Keefer and Khemani2009; Khemani Reference Khemani2003; Schady Reference Schady2000), especially where political power does not alternate frequently, such as under hegemonic regimes (for example, Mexico under the PRI (Magaloni Reference Magaloni2006) and India soon after independence (Rodden and Wilkinson Reference Rodden and Wilkinson2004)), or when democratic institutions are still emerging, as was the case in Portugal (Veiga and Pinho Reference Veiga and Pinho2007) and Italy (Golden and Picci Reference Golden and Picci2008).
In the last few decades, many countries, both developing and developed, have dedicated part of their budget to rules-/formula-based spending, in part to reduce politically skewed development spending. Some have done so in the form of CDFs, where a specific portion of the national budget is channeled directly to the constituencies of Members of Parliament (MPs), and the funds are to be spent on local development projects (Tshangana Reference Tshangana2010). Almost twenty countries, primarily in Asia and Africa, have CDFs. In some cases, such as in India and Pakistan, they apportion the same amount of resources to each constituency. CDFs in other countries, such as Ghana, South Africa, Kenya and Nigeria, use formula-based resource allocation mechanisms (Banful Reference Banful2011).
Other countries have constructed formulas for transfers between different levels of government outside of CDFs, based on various factors such as population, population density, economic capacity, literacy rates, poverty, etc. This includes many OECD (Organisation for Economic Co-operation and Development) countries that disburse portions of their budgets through ‘mandatory’ grants (Bergvall et al. Reference Bergvall2006) as well as various developing countries, including Mexico (Timmons and Broid Reference Timmons and Broid2013), Colombia and Morocco (Boadway and Shah Reference Boadway and Shah2007).
Two components of such rules-based funds have received most of the attention in the literature based on two stages of their operation: (1) how the rules are constructed and (2) how the funds are spent. The middle step of the process has been largely overlooked – whether formula-based funds, especially those constructed on a politically neutral basis, are disbursed based on these formulas.
Some scholars have looked at whether formula-based funds’ formulas are also politically skewed, since that goes against the main motivation for establishing them. They often find that the rules and indicators for determining these distribution formulas are chosen in ways that produce politically desirable patterns of transfers (Banful Reference Banful2011; Boadway and Shah Reference Boadway and Shah2007).
Other scholars have focused on the second stage, studying how individual politicians spend their share of resources from a rules-based fund, especially in the case of CDFs. Despite representing a relatively small portion of the overall development budget, these funds are useful from a research standpoint in part because they allow us to analyze individual MPs' political motivations as they provide MPs with a high degree of authority to initiate projects (Tsubura Reference Tsubura2013). Recent studies have examined how MPs distribute development projects within their constituencies in Kenya (Harris and Posner Reference Harris and Posner2019) and India (Jensenius and Chhibber Reference Jensenius and Chhibber2016), as well as how they spend more development funds close to elections and when they win by small electoral margins in the same two countries (Blair Reference Blair2017; Gutiérrez-Romero Reference Gutiérrez-Romero2013; Keefer and Khemani Reference Keefer and Khemani2009; Pal and Das Reference Pal and Das2010).
Though understanding the role of politics in both these stages of rules-based funds is important, it is not clear whether such funds are in fact disbursed as intended. In one of the very few articles that addresses a similar question, Timmons and Broid (Reference Timmons and Broid2013) find that in Mexico, there are some discrepancies between the formulas that dictate intergovernmental transfers and the actual allocations, though only some parties exhibit partisan biases in this regard. There are three reasons this is a relevant question to ask. First, it is inherently interesting in cases where the allocation formula is relatively politically neutral, that is, when each MP is ‘allowed’ to use the same amount of resources for her constituency. Secondly, in order to answer questions about MPs' efforts in spending such funds, the timing of this spending, their preferences regarding who to reward within their constituencies, etc., it is necessary to first ensure that such funds are, in fact, distributed to the MPs as intended. Finally, if part of the motivation for having rules-based development funds is to reduce the role of politics in some portion of development spending then it is important, in and of itself, to analyze whether constructing such funds achieves this goal.
At the same time, as is true in Mexico, it is difficult to study rules-based funds because the formulas are often obscure and complicated, and there is little data available on how the resources are distributed on the ground. In addition, there are always confounding factors that may also affect an MP's ability to receive and spend her share of a formula-based resource, such as her effort and experience, the chain of fund distribution, variation in local government capacity, etc. That is, even if there are discrepancies in how a rules-based fund is distributed in practice, identifying partisan effects and disentangling them from other political and non-political factors is not empirically straightforward.
Pakistani Politics and CDFs
Pakistan is a good case for identifying potential partisan effects on the distribution of politically neutral funds for two sets of reasons. First, Pakistani politics provide relevant scope conditions for the ruling party – that is, the political party that controls the center – to be able to influence the distribution of such a fund. Secondly, the set-up of its rules-based fund makes it likely that any observed discrepancies in the distribution rules and reality are caused by political considerations rather than other factors. I discuss both of these in turn.
Pakistan's regime and government instability, both of which have been constant features of its politics since the country's creation in 1947, have further exacerbated its problems of low political transparency. Perhaps partly because of this, the CDF I study did not have third-party or independent audits, nor was information on its spending released publicly, as happens in other developing countries, including Brazil in the former case, and India in the latter (Ferraz and Finan Reference Ferraz and Finan2008; Pal and Das Reference Pal and Das2010). Consequently, it becomes easier for the ruling party to inordinately influence fund distribution despite the official rules.
The data for this article come from the only development fund in Pakistan that provided, theoretically at least, equal development resources to each federal legislator (known as a Member of the National Assembly or MNA).Footnote 4 MNAs serve in the Lower House (National Assembly) of the bicameral Majlis-e-Shoora (Parliament), such that 272 of the 342 are elected directly by voters at least every five years, in single-member districts with plurality electoral rules.Footnote 5 Though this CDF had different names under different governments,Footnote 6 it was allocated in the federal budget each year from 1985 to 2013 when the national legislature existed.Footnote 7 Interestingly, the fund was first introduced by General Zia-ul-Haq's non-democratic regime, following his 1977 military coup. He initiated the fund following the 1985 ‘party-less’ elections held under his tenure (Tshangana Reference Tshangana2010). While the exact motivation behind its initiation is not documented, it is likely that the fund was created to indirectly strengthen the center even further by giving these non-party legislators more individual power, thereby reducing the regional strength of existing political parties. Nonetheless, the non-democratic origins of this fund perhaps explain its seemingly politically neutral set-up in the sense that individual legislators and their party affiliations were ostensibly unrelated to fund distribution.
Though this CDF makes up a fairly small portion of the overall development budget, it is nonetheless important because it is one of the rare sources of development spending that lets individual legislators credibly claim credit for specific projects, which is a meaningful component of legislators' re-election strategies (Blair Reference Blair2017; Lee Reference Lee2003). The credit-claiming link is further strengthened by the requirement that these projects must be infrastructural. I conducted in-depth interviews with MNAs and senior officials at the Ministry of Local Government and Rural Development, which had been in charge of running this particular fund, to better understand its procedures since these details are not otherwise available.Footnote 8 MNAs all repeatedly spoke about prioritizing projects based on their constituents' preferences; an overwhelming majority of such projects are small ‘farm-to-market’ roads that help connect rural communities to the main roads. Both ruling and opposition MNAs mentioned identical sectors and preferences, implying that differential fund distribution is unlikely due to different types of spending priorities.
The nature of these projects makes it easier for legislators to link specific undertakings to themselves, and thus convincingly claim credit from their constituents. In India, a similar CDF (the Members of Parliament Local Area Development Scheme, or MPLADS) includes construction of a plaque to honor the legislator who initiated a specific project (Blair Reference Blair2017). Though Pakistan does not have compulsory plaques, this indicates the relevance of such projects in linking legislators to their constituents, and there are certainly instances in Pakistan where a legislator gets similar recognition. For instance, one of the legislators I interviewed described a large project he undertook that involved constructing a hostel block in a women's college in a large city of Pakistan; he mentioned that the hostel block was subsequently named after him.Footnote 9 Such instances naturally help with claiming credit and reaping long-term electoral benefits.
In addition to this credit claiming, the process of applying for projects through this fund required very little effort on the part of each legislator, unlike similar CDFs in other countries. This came up repeatedly in interviews with politicians as well as bureaucrats. Each MNA submitted a prioritized list of projects for her constituency to the (now defunct) Ministry of Local Government and Rural Development each year, which forwarded all lists to the federal Planning and Works Department for cost estimates. Upon receiving the estimates, the ministry approved the maximum possible projects for each legislator, and released funds accordingly. Thus all MNAs had to do at the application stage was identify the projects and prioritize them each year. Ministry officials repeatedly corroborated this description by saying that almost all legislators submitted more projects each year than could be funded, implying that everyone was – at least on average – applying for more than 100 per cent of their fund share.
In an ideal world, one would have data on each MNA's project applications as well as subsequent cost estimates, project approvals and fund release. However, obtaining even the data that I do use (on fund disbursement) was near impossible, since the ministry was very reluctant to share any information. It claimed that records of legislators' applications were not consolidated.Footnote 10 Given how easy it is to apply for projects, though, it is very unlikely that a low fund allocation reflects low requests, on average. News coverage from Pakistan corroborates the hypothesis that CDFs are distributed by the ruling party for strategic purposes rather than based on the allocation rules. Although the CDF I study ended in 2013, in recent years, governments have distributed ‘one-off’ CDFs exclusively to constituencies with a ruling-party MNA (Yasin Reference Yasin2017). I return to the question of legislator effort in the empirical section.
A final relevant feature of this CDF is that it came under the purview of a single federal ministry. In many contexts, a differential allocation of development resources could be partly driven by differences in local government and bureaucratic capacity. In this case, however, a single federal ministry controlled the processing of project proposals and the release of funds for all MNAs. The fact that the fund was controlled by a federal ministry also made it easier for the ruling party to have influence, both formal and informal, over how it operated. For one, the ruling party had almost complete control over who was appointed as minister. Secondly, since Pakistan's bureaucracy is heavily politicized and often faces major reshuffling when the government changes, it was easier for the ruling-party elite to influence the officials in charge of processing these funds than would be the case in countries where the bureaucracy is better insulated from political interference. I discuss specific ways in which the release of funds was likely hindered in practice for non-ruling-party members, especially for weaker opposition MNAs, after presenting the main results.
Based on the specifics of the CDF outlined above, I expect the ruling party to have high incentives and opportunity to distort its actual distribution along partisan lines, even though the allocation rules are ‘politically neutral’. The next section empirically tests this hypothesis.
Data and Methods
Research Design
I use an RDD to identify the effect of being a ruling-party legislator on development fund allocation. The biggest advantage of this design is that it resolves the identification problem where the amount of development funds released to a legislator is endogenous to constituency and legislator characteristics. My empirical approach builds on a growing strand of political science research that focuses on close elections (for example, Asher and Novosad Reference Asher and Novosad2017; Eggers and Hainmueller Reference Eggers and Hainmueller2009; Hall Reference Hall2015; Lee Reference Lee2008). Identification of the RD estimate relies on the continuity of potential outcomes across the treatment threshold (de la Cuesta and Imai Reference de la Cuesta and Imai2016; Lee Reference Lee2008).Footnote 11 Here, that requires that any difference in the release of development funds between constituencies where a ruling-party candidate ‘barely won’ and constituencies where a ruling-party candidate ‘barely lost’ (that is, where an opposition-party candidate ‘barely won’) must be due to the difference in their treatment status, rather than any other factor. If this continuity assumption is plausible, I can systematically compare the fund allocation between these two types of constituencies to measure the treatment effect of being a legislator from the ruling party.Footnote 12
A fundamental consideration that stems from this continuity assumption is that there must not be ‘sorting’ close to the cutoff: In very close races, candidates must not have perfect control over the outcome of the election. For a violation to occur, candidates must not only know that the election will be exceedingly close but also have the resources and ability to manipulate voting in that narrow time period such that the outcome is affected to their benefit. In a country with frequent elections and government changes, and a lack of systematic political polls, it is arguably very difficult for even the parties themselves to accurately predict which constituencies will have the tightest races. Even if candidates could somehow discern which races will be the closest, based on past experience for instance, it is plausible that only those who are already in power will have access to the resources needed to try to manipulate votes. Balance tests, presented in Appendix A.3.2, verify that bare winners from ruling versus opposition parties are not different in any meaningful way. Continuity tests of the forcing variable are outlined in subsequent sections.
Data
The outcome of interest is how much of the allotted development fund was actually released to each legislator in a given year, and the unit of analysis is electoral constituency-year.Footnote 13 Due to data limitations, I use information from all national constituencies (also known as electoral districts in Pakistan) that fall within the province of Punjab for the democratic years between 1991 and 2013.Footnote 14
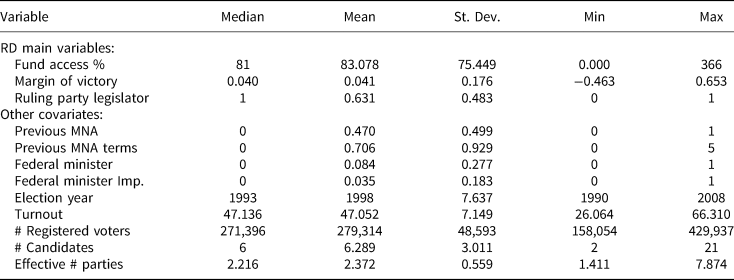
The dependent variable, Fund Access Percent, is calculated as the percentage of the total possible allocation that was released to each constituency; depending on the year, the total was either PKR 5 million or PKR 10 million (see Table 1 for summary statistics). The maximum allocation for Fund Access Percent is much higher than 100 per cent because some legislators were given more than the official amount allowed. Though such outliers are relevant because they are likely observed for political reasons, the following results are nonetheless robust to forcibly recoding them as 100 per cent, or using PKR amounts as the dependent variable (see Appendix Tables A1 and A2).Footnote 15
Descriptive statistics

Margin of Victory is the forcing variable, and is calculated for each observation from the point of view of the ruling party:
 $${\rm Margin\ of\ Victor}{\rm y}_{it} = \displaystyle{{{\rm Votes\ Receive}{\rm d}_{irt}-{\rm Votes\ Receive}{\rm d}_{iot}} \over {{\rm Total\ Votes\ Cas}{\rm t}_{it}}},$$
which refers to the difference between the vote share of the candidate from the ruling party r and the vote share of the highest vote-earning candidate from any other party o, in electoral district i in election year t.Footnote 16 Thus, for an electoral district where the winning candidate belongs to the ruling (opposition) party, Margin of Victory is positive (negative) because the vote share of the ruling-party legislator is greater (lower) than that of the highest vote getter from any other party.Footnote 17
The treatment dummy, Ruling Party Legislator, indicates whether a constituency's legislator belongs to the ruling partyFootnote 18 (1) or not (0) for each observation.Footnote 19 In other words, it is a function of the forcing variable since it is coded 1 where Margin of Victory is positive, and 0 where it is negative.
The remaining variables in Table 1 are other factors that may be associated with the fund percentage a legislator gets; they refer to politician-specific and election-specific characteristics. Previous MNA and Previous MNA Terms are dummy and count variables, respectively, that measure experience as a federal legislator.Footnote 20 Being an ‘important’ and well-known politician is proxied by two dummy variables that measure whether an MNA has ever been a cabinet member (Federal Minister) or part of the even more exclusive group of federal ministers belonging to one of the highest-profile ministries (Federal Minister Important).Footnote 21 During interviews, some legislators described having an easier time getting resources for their constituencies in their second terms because they had learned how to ‘work the system’. Others, who had headed federal ministries, mentioned having no trouble accessing their share of resources even when in opposition.Footnote 22 Finally, Turnout, # Registered Voters, # Candidates, and Effective # Parties measure election characteristics at the constituency level.
Empirical Analysis
The dataset contains 1,099 observations, a large proportion of which are close elections. Almost 50 per cent of the observations have races decided within a 10 per cent margin of victory interval, slightly over a quarter within 5 per cent, and almost 12 per cent have a victory margin smaller than 2.5 per cent.
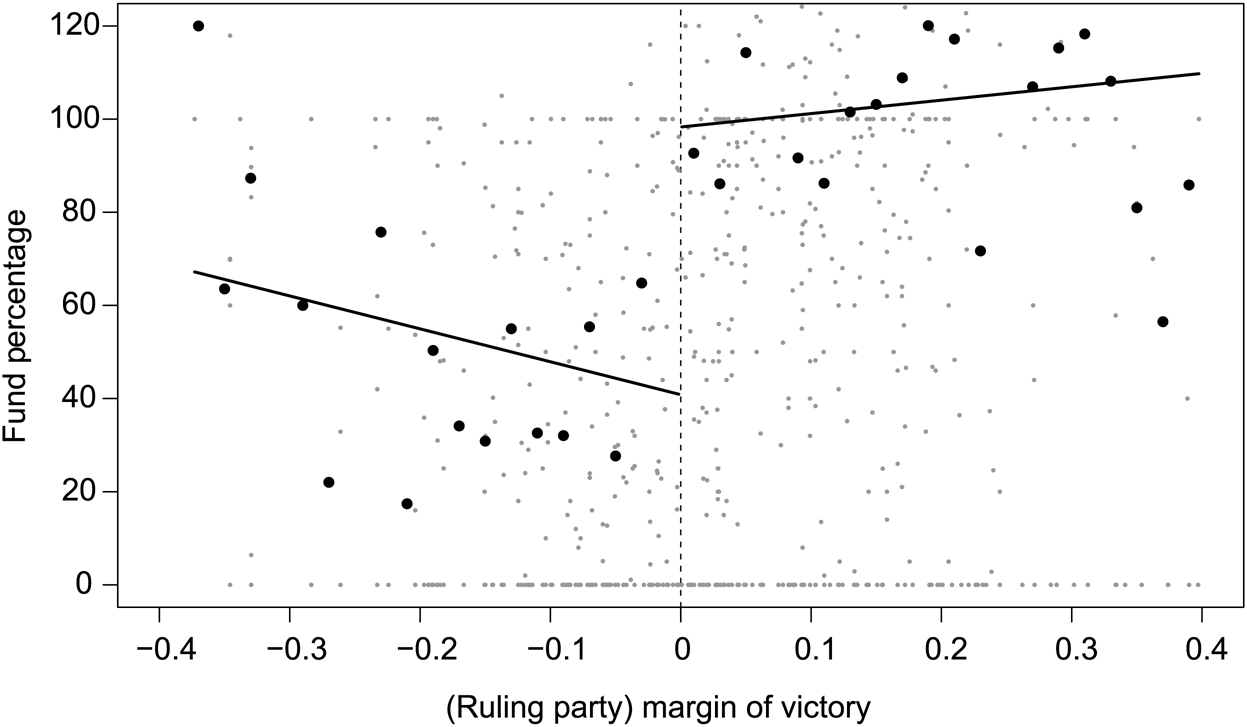
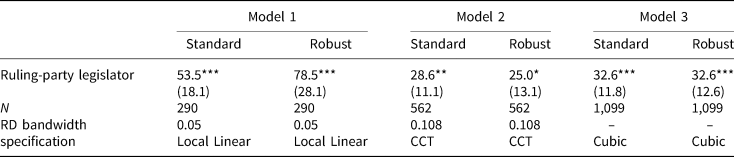
Figure 1 depicts the discontinuity in the allocation of federal development funds for close elections. For constituencies where a ruling party candidate just won versus those where a ruling party candidate just lost, there is a big visual jump in the percentage of development funds released subsequently. Table 2 presents the RD estimates for this treatment effect using local linear regressions for different bandwidths (Models 1 and 2) as well as the estimate of the local average treatment effect from a cubic polynomial (Model 3), which estimates Equation 1, where β 1 is the treatment effect at the threshold. In the equation, i denotes constituency and t denotes the year.Footnote 23
 $$\eqalign{& {\rm Fund\ Acces}{\rm s}_{it} = \beta _0 + \beta _1{\rm Ruling\ Party\ Legislato}{\rm r}_{it} + \beta _2{\rm Margin\ of\ Victor}{\rm y}_{it} + \cr & \beta _3{\rm Ruling\ Party\ Legislator} \times {\rm Margin\ of\ Victor}{\rm y}_{it} + \beta _4{\rm Margin\ of\ Victory}_{it}^2 + \cr & \beta _5{\rm Ruling\ Party\ Legislator} \times {\rm Margin\ of\ Victory}_{it}^2 + \beta _6{\rm Margin\ of\ Victory}_{it}^3 + \cr & \quad \quad \beta _7{\rm Ruling\ Party\ Legislator} \times {\rm Margin\ of\ Victory}_{it}^3 + \varepsilon _{it}} $$
Using both the conventional (Standard) and the bias-corrected (Robust) local linear estimation method first introduced in Calonico, Cattaneo and Titiunik (Reference Calonico, Cattaneo and Titiunik2014) for RDDs, a bandwidth of 0.05 yields substantively large, and statistically significant, discontinuity estimates of almost 54 and 79 percentage points, respectively. This estimation uses all 290 races that were decided by a vote share difference of 5 per cent or less. Model 2 uses the optimal bandwidth calculation procedure recommended by Calonico et al. (Reference Calonico2018), which suggests a bandwidth of 0.108.Footnote 24 The associated discontinuity estimates are over 25 percentage points and significant. I also estimate the treatment effect using a cubic polynomial (specified in Equation 1) with appropriate interactions between different orders of the forcing and treatment variables; the discontinuity estimate (Model 3) remains over 30 percentage points and highly significant, even after clustering the standard errors by administrative district. The results are robust to various bandwidth and modeling choices, details for which can be found in Appendix A.2.
Effect of ruling party legislator on development fund access
Note: the figure was created by running separate OLS regressions on either side of the cutoff in the forcing variable. That is, Fund Percentage is regressed on (Ruling Party) Margin of Victory for negative values of Margin of Victory and then regressed separately for positive values of Margin of Victory. The OLS predicted lines are plotted. The gray dots in the background denote the raw data (n = 1,099) while the black dots represent the raw data aggregated and averaged in bins of length 0.02.

Effect of ruling party legislator on development fund access

Note: for Models 1 and 2, standard specifications provide ‘conventional’ estimates while robust specifications report ‘bias-corrected’ estimates with robust standard errors, both using the RDRobust Package in R. For Model 3, robust reports robust standard errors, clustered at the administrative district level. Standard errors reported in parentheses. CCT uses the optimal bandwidth calculation suggested by Calonico et al. (Reference Calonico2018). ***p < 0.01; **p < 0.05; *p < 0.1
Though the continuity assumption is not directly testable, I ensure that other potential explanatory variables are balanced close to the cutoff using three different methods, in line with the existing literature; the results are available in the Appendix. First, I conduct t-tests on relevant covariates, including Previous MNA, Previous MNA Terms, Federal Minister, Effective # of Parties, Turnout and Rejected Votes for different bandwidths, and find no evidence of imbalance (Table A4). Next, I re-run Equation 1 with these covariates as the dependent variable one by one. The insignificant treatment coefficients lend credence to the argument that the legislators observed in a narrow interval on either side of the cutoff are similar on other dimensions that could potentially affect fund access (see Table A5 in Appendix A.3.2). Finally, I also establish the irrelevance of these covariates close to the cutoff by including them as control variables in the three main RD regressions. The treatment effect remains large and statistically significant (Table A6).
Another way to ensure continuity as much as possible is by analyzing the continuity of the forcing variable. I do so in Appendix A.3.1 in two ways: first by plotting the density of Ruling Party Margin of Victory for its entire range (Figure A4), and second by conducting the tests suggested by McCrary (Reference McCrary2008) for various bandwidths (Figure A5).
In addition, Appendix A.4 further strengthens the findings by presenting results from two placebo tests. The first introduces ‘fake cutoffs’ for treatment, instead of using the actual 0 per cent victory margin as the treatment threshold. The second test lags the dependent variable by one administration. Both approaches yield null results, and find no discontinuity.
These results indicate that it is not just winning, but also being from the ruling party that is important for a legislator, especially in close races, because that leads to a high release of one's development fund share. Conversely, winning a close race as an opposition-party legislator leads to a low allocation of funds, presumably as ‘punishment’ from the ruling party, in order to hinder such legislators from consolidating their electoral support.
Election Cycles and Different Ruling Parties
Some previous studies on distributive politics find that incumbents spend more of their resources close to elections. The reasoning is intuitive: when one's constituents are about to go to the polls, incumbents have more incentives to spend on them. Blair (Reference Blair2017) finds that Indian MPs increase their CDF spending just before elections, whereas Bohlken (Reference Bohlken2018) looks at the relationship between federal and state legislators in India, and finds that the former allocate more project dollars in state-level constituencies where a co-partisan recently won.Footnote 25 There is similar evidence of election cycles in other developing countries (Gutiérrez-Romero Reference Gutiérrez-Romero2013). In Pakistan, where the ruling party misallocates a rules-based development fund along partisan lines, the complementary expectations would be as follows. First, this incentive to distort should be higher in election years; that is, the treatment effect should be larger. Secondly, perhaps overall spending is also higher in election years, regardless of party affiliation.
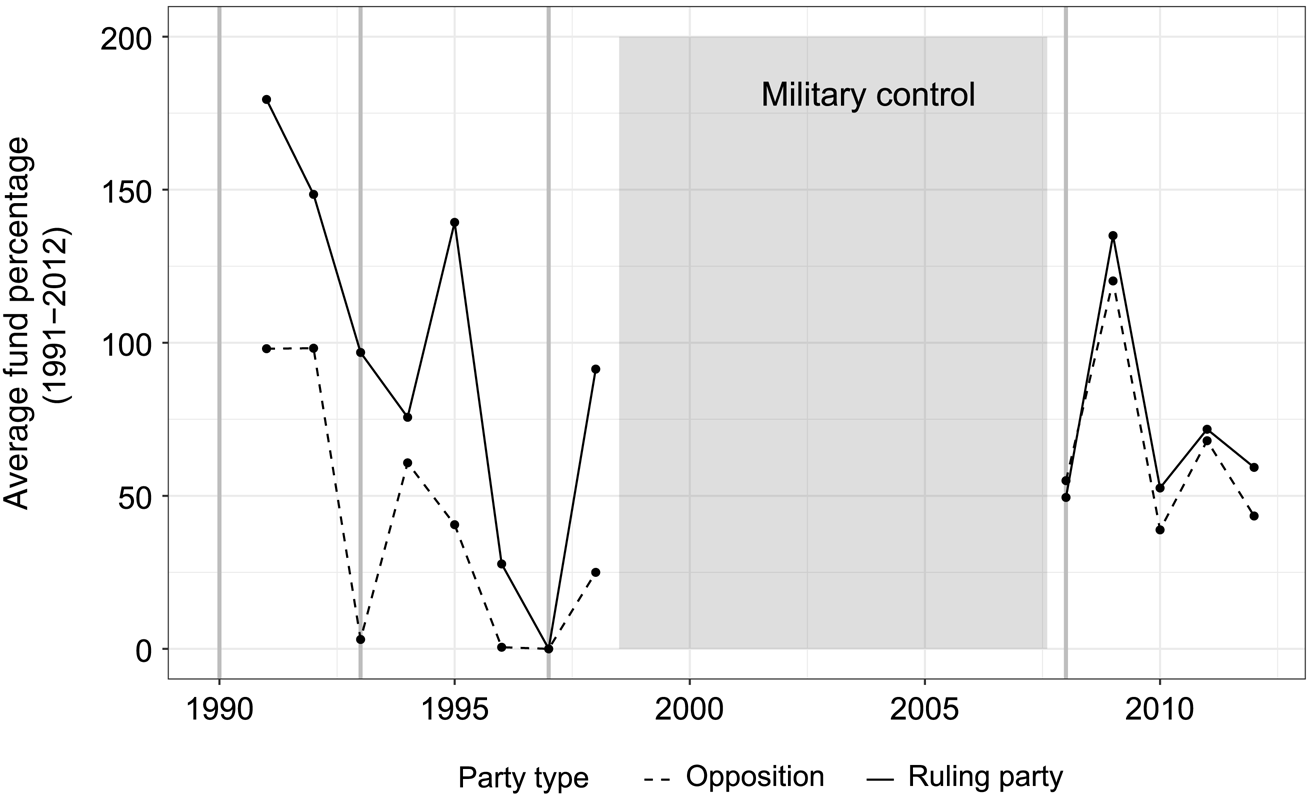
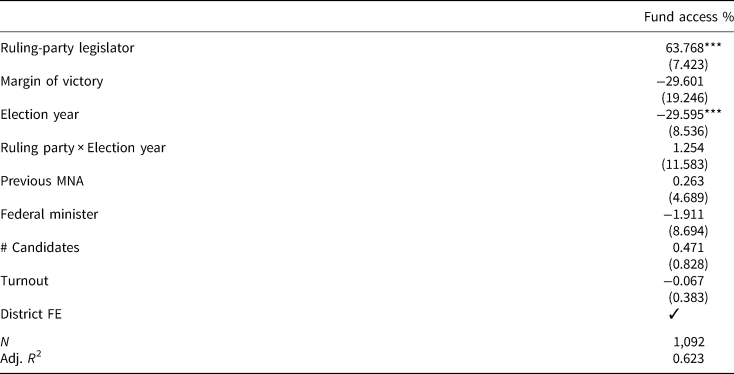
However, as Table 3 and Figure 2 show, that does not appear to be the case. Table 3 summarizes the results from an ordinary least squares (OLS) regression with an interaction term between Ruling Party Legislator and a dummy variable for Election Year.Footnote 26 The insignificant interaction indicates that the advantage of being a ruling-party legislator is no higher in election years than other years. It is also interesting that overall spending is lower in election years, contrary to what we might have expected.
Access to development funds by year – raw data
Note: the figure was created by aggregating data on the dependent variable, Fund Percentage, separately for Ruling Party observations and Opposition observations for each year. Elections are denoted by grey vertical lines, and occur in 1990, 1993, 1997 and 2008.

Election cycles

***p < 0.01; **p < 0.05; *p < 0.1
The same pattern is also discernible from Figure 2, where the average amount allocated to all ruling-party legislators and all opposition legislators is plotted for each democratic year with available data, with election years marked by gray vertical lines. The figure highlights two noteworthy findings. First, as mentioned earlier, the period of military government is excluded from the analysis since the article pertains to democratic political competition.Footnote 27 Secondly, the figure illustrates that overall spending is, indeed, lower in election years. As mentioned earlier, 1997 was dropped from the analysis since no CDF money was allocated that year, so this election year is not driving the negative Election Year base term.
There are likely at least two reasons that help to understand this lack of election cycle in Pakistan. The main explanation for this pattern is that Pakistan has rarely had elections in the years in which they were due to be held, meaning that election timing is difficult to predict. The figure clearly indicates that elections have not been held at five-year intervals in this period, because multiple governments were dismissed early on the grounds of their ‘inability to govern’. Thus ruling parties know they are unlikely to make it through their five-year term, so it is a sensible electoral strategy to immediately start providing co-partisans with high levels of development funds while cutting off resources from the opposition. A complementary second explanation, especially when contrasting this CDF with the one in India, is that this fund is non-lapsable, which means that unused amounts cannot be carried forward to the next fiscal year.Footnote 28 This feature is different from the Indian MPLADS fund, where an individual MP can use all of her share in the last year of the administration if she so chooses (Blair Reference Blair2017). Therefore, even if elections were held on time in Pakistan, there is no incentive to ‘hoard’ one's share of the CDF in wait of an election year.
The overall lower spending in election years can be understood through similar channels. That is, when a government is being dismissed early, that implies a caretaker government is set up in a rush and elections are held. This process, especially when not planned well in advance, takes up a large portion of the fiscal year, meaning there are fewer months left for the relevant logistical and bureaucratic processes to take place.
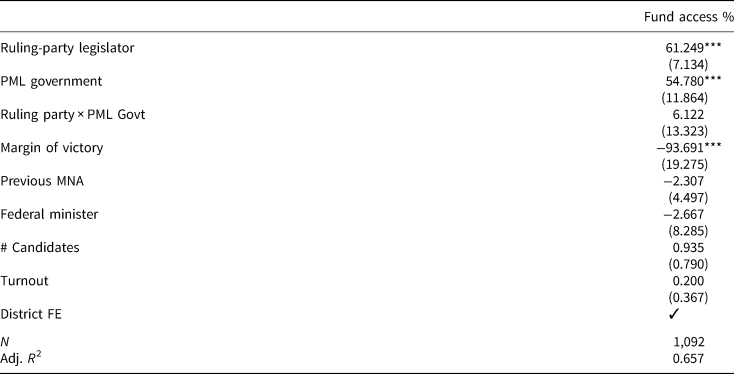
Another substantively interesting question pertains to heterogeneous effects based on specific political parties. Scholars have sometimes found that differences in development fund distribution are driven by the type of party in power. This is true in both developed contexts (for example, Berry, Burden and Howell Reference Berry, Burden and Howell2010; Lee Reference Lee2003) and developing countries with rules-based spending (Timmons and Broid Reference Timmons and Broid2013), and could be driven by specific types of ideologies or differing party capacities or organization, etc. In the case of Pakistan's CDF, I find no significant differences between the two political parties that alternated power at the center between 1991 and 2013, namely the Pakistan People's Party (PPP) and the Pakistan Muslim League Nawaz (PML-N). Table 4 presents the results when I interact a dummy variable for a PML-N government with the Ruling Party Legislator dummy. The insignificant interaction coefficient indicates that there is no significant difference associated with being a ruling-party legislator under a PML-N government versus a PPP government. Since the data are from Punjab, we might expect stronger effects of being a ruling-party legislator under PML-N governments since Punjab has traditionally been a PML-N stronghold; the PPP is primarily rooted in the province of Sindh. This expectation may be even stronger if party alignment between national and provincial legislators also matters for fund distribution, as Bohlken (Reference Bohlken2018) finds in India. However, that is not the case here.
Different ruling parties

***p < 0.01; **p < 0.05; *p < 0.1
Having more than one ruling party in the dataset – and having both parties hold power at the center twice each – allows me to conclude that the treatment effect of being a ruling-party legislator is a ‘general’ phenomenon in the case of Pakistan rather than a finding driven by a particular political party. Either party, when in power, engages in similar levels of distortionary behavior.
How does this distortion occur?
The discussion so far has pertained to development funds being disbursed to ruling-party legislators at much higher rates than opposition legislators, particularly in the close races analyzed in the RD. This finding is robust and extends to both parties that have held federal power. How exactly might the ruling party be accomplishing this on the ground? That is, what mechanisms does the party in power use to reduce fund allocation to the opposition?
Ideally, one would also know what projects each legislator initially applied for, have cost estimates for each, know how many projects were subsequently approved, which of those projects were funded, when the funding was released, and what the official reason was for the remainder not being approved or not being funded. Unfortunately, however, such data are not available – and likely are not even compiled by the government and relevant authorities. However, the interviews as well as the process of applying for projects through this fund help shed light on the most plausible mechanisms for this distributive distortion.
It is important to note, as mentioned earlier, that the CDF's operation was heavily centralized under the federal government, which gave the ruling party considerable control over each stage. A federal ministry dealt with project approval and subsequent fund release. Similarly, the federal Planning and Works Department (PWD) worked with the ministry, estimated project costs and then managed project execution. Given that bureaucracies in Pakistan are not independent and are heavily politicized, with major reshuffling after each election, it is quite plausible that the PWD could also influence what happened on the ground at various stages.
These conditions make it likely that the ruling party could affect how funds were distributed, especially because this CDF had no third-party audits or annual public release of projects. The interviews I conducted help understand how this was done within the system. The main mechanism was through unnecessary and prohibitively long delays at various stages. Most interviewees mentioned such delays at the project approval phase, and every former opposition legislator I spoke with highlighted delays at the fund release stage.Footnote 29
There are at least two reasons why the release of funds, which equates to the project launch in this case, was the most common stage for delays. First, rejecting project proposals outright may have been harder because there were very few guidelines dictating what projects could or could not be proposed; the only real requirement was that they had to be infrastructural. Similarly, rejecting projects because the cost estimate was too high was also implausible because a government department (the PWD), rather than legislators, calculated these estimates. Thus from a logistical standpoint, the release of funds was a feasible stage for interference.
The second reason is that the ministry and the PWD had an inordinate amount of control over this stage, at which many seemingly plausible excuses could be made to delay the fund release, ranging from contractor unavailability or inefficiency to bureaucratic red tape and procedures. This control was also strengthened by the fact that the fund money was never physically released to the legislator herself. Rather, the PWD was in charge of finalizing a contractor and executing the project.
Most interviewees talked about how their projects would often have delayed approval but would mostly get approved. However, the ministry's delay tactics would be at play at the last hurdle of having funds released, and since fund money did not carry forward from one year to the next, even several months’ delay could be sufficient to ensure that a given project was never executed. Many opposition interviewees said that personal connections were important for getting funds released if you were not from the ruling party, and stated that it would require endless trips to the PWD and ministry and countless arguments. If personal connections mattered, marginally elected opposition legislators were the most likely to be adversely affected, which was also corroborated in the interviews.
The picture that emerges is one in which being a member of the opposition meant facing unnecessary delays in project approval and fund release. As one legislator bluntly put it, ‘Now, the ruling party is not letting any development happen in our constituencies…the problem with our politicians is that, when they are in government, they politically victimize the opposition and don't allow any development in their areas’.Footnote 30
A potential concern may be whether legislator effort explains some of the observed variation; perhaps ruling-party legislators applied for more projects or chased down the PWD bureaucrats more often. Even if partly true, this is not a sufficient explanation of the results. For instance, even though ruling-party legislators probably knew they were more likely to get their projects approved, if they applied for 300 per cent of funds while opposition legislators only applied for 150 per cent, the logic is still the same. In other words, even if opposition legislators applied for fewer projects than their ruling-party counterparts, they did so because they knew their funds would not be released rather than because they were putting in less effort.
However, even that potential explanation is not satisfactory because applying for projects entailed such low costs in the initial phases, as described above. As is well established in the literature, marginally elected legislators need to work harder and be more responsive to build on their narrow margin of support (Berry, Burden and Howell Reference Berry, Burden and Howell2010; Rodden and Wilkinson Reference Rodden and Wilkinson2004; Ward and John Reference Ward and John1999). Therefore, especially for legislators elected by small margins, the need to work harder for their constituencies far outweighs the meager effort required to apply for CDF projects. Furthermore, if opposition legislators nonetheless sometimes applied for amounts greater than 100 per cent but still lower, on average, than what ruling-party legislators applied for, then we would expect that to be most likely in opposition strongholds, where legislators do not need to work as hard to maintain their electoral margin, as has been found in other similar contexts (Keefer and Khemani Reference Keefer and Khemani2009). As the next section shows, however, that is not the case; in fact, opposition and ruling-party strongholds received similar funds during the study period. Finally, controlling for legislator experience and conducting balance tests for the RD all also indicate that the differential allocation of resources is not driven by differences in legislator effort but by a systematic distortion in how development funds were distributed in ways outlined here.
Implications for Development
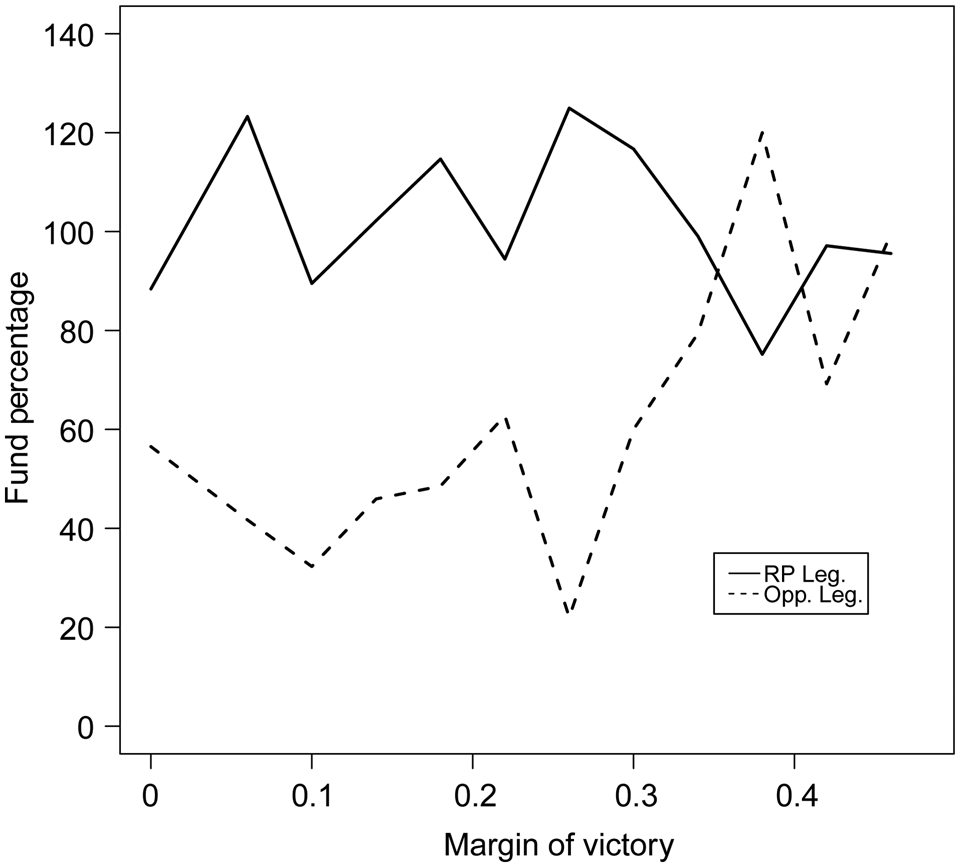
The article's main findings are identified by focusing on close electoral races. Though descriptive, moving beyond the observations close to the cutoff highlights some interesting patterns with potentially important implications. Figure 3 summarizes the raw data, aggregating the dependent variable for each 0.04 interval of Margin of Victory and plotting it separately for ruling-party and opposition legislators. It shows that for close races – those with small margins of victory – there is a big difference in fund allocation depending on the party, as was reflected in the RD estimates. However, as we move towards less competitive races, the distribution of resources becomes quite similar for both types of legislators.
Access to development funds by party affiliation – raw data
Note: the figure was created by aggregating data on the dependent variable, Fund Percentage, separately for Ruling Party observations and Opposition observations. The variable is aggregated for intervals of length 0.04 for the Margin of Victory variable. Though Margin of Victory theoretically ranges from 0 to 1, the x-axis is limited to the range that actually occurs in the data for both types of legislators.

Though this could of course be driven by various factors, such as legislative experience or more skilled MNAs in opposition strongholds, the descriptive trend may nonetheless have important implications, especially if electoral competition is somewhat stable over time. That is, if strongholds have reasonable access to resources regardless of who controls them, then such constituencies are likely to experience relatively sustained development over time. In stark contrast, if swing districts sometimes have very high and sometimes very low access to their share of development funds, depending on whether the legislator is from the ruling party, this high variance can lead to inefficient development in the most competitive constituencies. This trend may be further exacerbated by high levels of government instability and the fact that no party has held control at the center for two consecutive administrations.
This pattern also highlights an interesting mechanism through which national politics can affect local development. That is, voters in a competitive constituency may be satisfied with their legislator and vote her into office again, but if her party does not control the center, she will not be able to contribute to local development. Similarly, voters may be dissatisfied with a ‘poor-performing’ legislator whose poor performance is in fact driven by his party not controlling the center rather than his own lack of hard work. Though this discussion is speculative and further analysis is beyond the scope of this article, the trend in the data merits systematic analysis and has potentially important implications for thinking about development, especially because it suggests that electoral competition may not always produce ‘good’ outcomes in democracies, as is traditionally assumed.
Conclusion
This article has addressed the question of how development funds are distributed in contexts where their allocation rules are politically neutral. That is, do politically neutral rules lead to politically neutral spending? This is an important question because most of the distributive politics literature has studied how incumbent politicians distribute resources in the absence of spending rules, and how such rules, when they do exist, are politicized. The question of what happens when spending rules are constructed and are politically neutral has received considerably less attention. This lack of attention is perhaps partly driven by the assumption that spending must also be politically neutral in such cases. However, as I show using data from Pakistan, that is not necessarily true.
Introducing a new dataset on federal development resource allocation, I have shown using an RDD that winning is not sufficient for a federal legislator to be allocated his fair share of resources; he must also be from the ruling party, especially in closely contested electoral districts. Specifically, I find a local average treatment effect of at least 25 percentage points (and up to almost 80 percentage points for some specifications), which is robust to a variety of bandwidths and specifications. Controlling for other potentially relevant factors, such as legislator quality and experience, as well as various electoral characteristics of the constituencies, does not diminish the main findings. Similarly, the results are not driven by any particular party, and cannot be explained exclusively by the timing of elections.
Beyond the importance outlined above, the article makes an empirical contribution by causally identifying the effect of being a ruling-party legislator on development fund allocation; most previous scholarship has focused on associative evidence. In addition, the findings are relevant for a growing literature that uses data on such rules-based spending to address more nuanced questions regarding legislators' spending preferences and incentives within their constituencies; such studies address issues of legislator effort, election cycles in spending, the distribution of pork within constituencies and so on. However, using rules-based funds to answer such questions requires assuming that such funds are distributed as intended. Such manipulation is plausible in Pakistan given the structure of the CDF as well as its low level of transparency and unstable governance – characteristics shared by many developing countries. Indeed, most countries have at least some portion of their budgets allocated through formula-based funds. Finally, the findings have broad potential implications for thinking about development patterns and the various ways in which national and local politics interact.
Supplementary material
Data replication sets are available in Harvard Dataverse at: https://doi.org/10.7910/DVN/GYMPE7 and online appendices at: https://doi.org/10.1017/S0007123419000541.
Acknowledgements
I thank Scott Abramson, Sergio Ascencio, Matt Blackwell, Casey Crisman-Cox, Andy Harris, Gretchen Helmke, Phil Keefer, Bethany Lacina, Alex Lee, Mona Lyne, Beatriz Magaloni, Jack Paine, Bing Powell, Brad Smith, Jeff Timmons, Svanhildur Thorvaldsdottir, participants at the University of Rochester Comparative Politics Workshop, the annual meeting of the Midwest Political Science Association (2015), and the annual meeting of the American Political Science Association (2015), and three anonymous reviewers, for helpful suggestions and comments.