Introduction
Nineteenth century US economic development coincided with agricultural change, and geographic regions that are productive agricultural regions in the 21st century are not the same as those in the 19th century. For example, the American South was among the leading 19th century US agricultural regions (Conrad & Meyer, Reference Conrad and Meyer1964, p. 342; Ransom & Sutch, Reference Ransom and Sutch1977; Cochrane, Reference Cochrane1979, pp. 337–343), but its advantage declined as other regions came into agricultural prominence. As the US frontier advanced westward, agricultural production followed, and by the mid-20th century the value of agricultural production moved from Southern to Midwestern states, particularly Indiana and Illinois, and later the Dakotas, Kansas and Nebraska. This transformation occurred as numerous immigrants streamed onto the Central Plains, and the Homestead Act changed immigrants' access to land and opportunity. Nebraska is one agriculturally productive state that developed during the late 19th century and received a considerable share of European and Eastern state immigrants (Stewart, Reference Stewart2006, p. 549), and health and biological conditions in Nebraska were related to its economic growth.
The body mass index (BMI, weight in kilograms/height in metres squared) is one commonly used measure that reflects health and is the net current balance between nutrition, work effort and the physical environment. Before the rise of the modern obesity epidemic, BMIs increased when economic conditions improved and decreased when economic conditions deteriorated. This study, therefore, uses 19th century height and weight records from the Nebraska state prison to assess how BMIs varied on the Central Plains during agricultural development. Historical BMI studies provide important insight into the evolution of health during economic development. For BMIs less than 20, Waaler (Reference Waaler1984) and Koch (Reference Koch2011) found inverse relationships between modern BMIs and mortality risk. Costa (Reference Costa1993) applied Waaler's results to a historical population and found that the modern BMI relationship applies historically, and Jee et al. (Reference Jee, Sull, Park, Lee, Eliseo and Samet2006, pp. 780, 784–785) found that the relationship was stable across racial groups. Costa (Reference Costa2004, pp. 8–10) and Carson (Reference Carson2009a, Reference Carson2012) demonstrated that there were considerable differences between 19th century African-American and white BMIs, and that blacks had greater BMIs than whites. Costa also found that BMI values increased between 1860 and 1950, and Cutler et al. (Reference Cutler, Glaeser and Shapiro2003) found that US BMIs have increased since the beginning of the 20th century, not because people are less active, but because they consume more calorie-dense foods. On the other hand, Lackdawalla & Philipson (Reference Lakdawalla and Philipson2002, p. 25) indicated that about 60% of increased modern obesity is due to decreased physical activity. However, because BMI variation also reflects early-life conditions, interpreting BMI variation is more problematic than interpreting other biological markers (Ravelli et al., Reference Ravelli, Stein and Susser1976; Thompson & Gordon-Larsen, Reference Thompson, Gordon-Larsen and Cawley2011, p. 72). For example, if an individual is poorly nourished as a youth, their statures may be short, their frames may be smaller and their basal metabolic needs will be relatively low. Improved nutrition in later life, therefore, results in greater BMI values. Alternatively, well-nourished youths may have larger frames, and their basal metabolic needs will be higher, resulting in lower BMIs in later life (Herbert et al., Reference Herbert, Richards-Edwards, Manson, Ridker, Cook and O'Conner1993, p. 1368; Costa, Reference Costa2004, p. 4).
It is against this backdrop that this study considers three paths of inquiry into the early 20th century black and white BMI variation in Nebraska. First, what was the relationship between complexion and BMIs on the Central Plains? The question is important because individuals in the late 19th and early 20th centuries who had fairer complexions were taller than individuals with darker complexions (Steckel, Reference Steckel1979, pp. 373; Margo & Steckel, Reference Margo and Steckel1982, pp. 520–521 and 525; Carson, Reference Carson2009b). However, African-Americans with darker complexions on the northern Central Plains had greater BMI values than whites and mulattos; therefore, there is no evidence BMIs for individuals with darker complexions were lower than for fairer complexioned whites or mulattos. Second, how did black and white BMIs vary over time in the late 19th and early 20th centuries? Unlike Nebraska statures, black and white BMIs declined and remained constant throughout the late 19th and early 20th centuries. Third, what was the relationship between Nebraska BMIs and socioeconomic status? Reflecting better net current rural health and mild disease environments, 19th century black and white farmer BMIs were consistently greater than for workers in other occupations.
Nineteenth century Nebraska
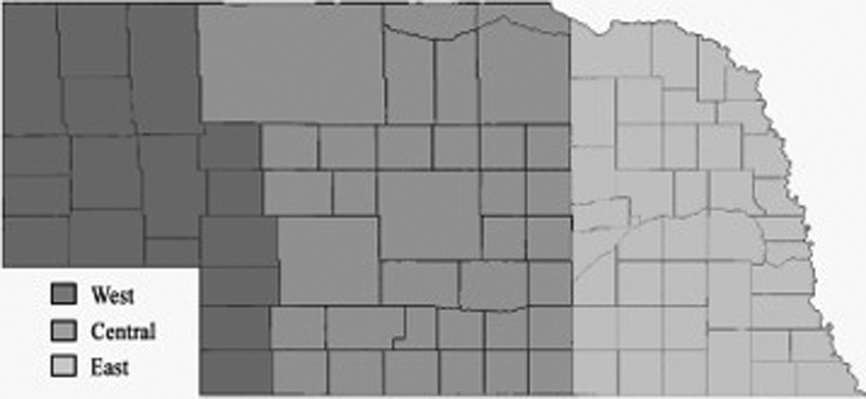
Body mass index represents an important measure for how health varies by ethnicity, time and socioeconomic status during the earliest stages of economic development. A vital part of US geography, Nebraska is comprised of three distinct prairie grasslands (Fig. 1), and Nebraska is unique because it is one of the few Plains states that had each of the tall, mixed and short grass prairies common to the region. Nebraska is also noteworthy because its precipitation varied considerably across the state. On Nebraska's eastern boarder are tall grass prairies, which receive an average 40 inches of rainfall per year. These tall grass prairies have rich plant cover and once had grasses that reached two metres in height. To the west and in central Nebraska are mixed grass prairies, which receive 20–25 inches of rainfall per year and have productive farmland that supports corn and wheat production and produces other grains. To Nebraska's far west are short grass prairies, which receive less than 20 inches of rainfall per year and are dominated by short grasses used as range land for buffalo that supported various indigenous cultures and later domesticated cattle. These three Nebraska grasslands create a unique ecological environment to contrast tall grass prairies that specialized in corn production with short grass prairies that specialized in beef production and diverse crops.
Nineteenth century Nebraska regions. Nebraska's eastern counties include Knox, Cedar, Dixon, Dakota, Antelope, Peirce, Wayne, Thurston, Madison, Stanton, Cuming, Burt, Platte, Colfax, Dodge, Washington, Nance, Merrick, Polk, Butler, Saunders, Douglas, Sarpy, Cass, Lincoln, Seward, York, Hamilton, Clay, Filmore, Saline, Boone, Lancaster, Otoe, Nemaha, Johnson, Richardson, Pawnee, Gage, Jefferson, Thayer and Nucholls. Central counties include Boyd, Holt, Rock, Keya Paha, Brown, Cherry, Hooker, Thomas, Blaine, Loup, Garfield, Wheeler, McPherson, Logan, Custer, Valley, Greeley, Sherman, Howard, Lincoln, Dawson, Buffalo, Hall, Hayes, Frontier, Gosper, Phelps, Kearney, Adams, Hitchcock, Red Willow, Furnas, Harlan, Franklin and Webster counties. Western states include Sioux, Dawes, Sheridan, Box Butte, Scotts Bluff, Morrill, Garden, Banner, Kimball, Cheyenne, Deuel, Arthur, Keith, Perkins, Chase and Dundy.

The Missouri River borders the eastern edge of Nebraska and is the longest river in the US, draining nearly one-sixth of the water from the North American continent. Originating in Montana's western Rockies, the river flows east across Montana, Wyoming, Colorado, the Dakotas and Nebraska before draining into the Mississippi River near Saint Louis, Missouri. These states and territories relied heavily on the Missouri River and its tributaries to first support Native American cultures and vast buffalo herds before European settlement and later supported domesticated agriculture, livestock and irrigation systems after European settlement. Its three grass prairies, varying precipitation and proximity to the Missouri River, therefore, shaped Nebraska's economic development with low-cost access to transportation and trade.
Nebraska's most distinctive late 19th and early 20th century political and economic developments were its central location within the US, military expeditions, land distributions, rise of its agricultural sector and construction of the transcontinental railroads. Given its central location within the US, Nebraska was an important location in the early fur trade, and early French-Canadian trappers used the Missouri River as a low-cost transportation route to transport their furs to eastern states and European markets. The Missouri River was also an early means by which the US government explored its newly acquired Louisiana Purchase. Between 1804 and 1806, Thomas Jefferson sent explorers Meriwether Lewis and William Clark to navigate the Missouri River as part of their voyage to the Pacific. During this expedition, Lewis and Clark explored the Missouri River's western border with Nebraska.
The 1862 Homestead Act made Nebraska and other parts of the Midwest accessible to immigrants from the eastern US and Europe. As Nebraska's public domain was transferred from public ownership to the private sector, wealth and agricultural productivity increased (Cochrane, Reference Cochrane1979, pp. 81–85). With increased population from Eastern states and Europe, Nebraska's agricultural sector expanded, and previously unoccupied prairies were brought into cultivation (Cochrane, Reference Cochrane1979; Atack et al., Reference Atack, Bateman, Parker, Engerman and Gallman2000, pp. 254–258). The reaper, steel plough, barbed wire and refrigeration simultaneously came into use (Cummings, Reference Cummings1940, p. 36–40; Cochrane, Reference Cochrane1979, pp. 190–199; Craig et al., Reference Craig, Goodwin and Grennes2004). However, this agricultural boom was short-lived, and between 1874 and 1877 large insect infestations devoured much of Nebraska's agricultural output (Cochrane, Reference Cochrane1979, p. 93). Many jubilant settlers abandoned their Nebraska homesteads and returned east to more stable, familiar surroundings (Cochrane, Reference Cochrane1979, pp. 85–86; Stewart, Reference Stewart2009, p. 238–239). Nevertheless, by the 1880s, Nebraska's agricultural sector rebounded and began a series of boom-and-bust cycles that lasted throughout the late 19th and early 20th centuries.
After the Civil War, Nebraska's central proximity within the US also made it a vital link in the 19th century US transportation revolution. In 1865, the Union Pacific Railroad started west from Omaha to unite with the Central Pacific Railroad that started east from Sacramento, and construction brought Irish immigrants and Confederate veterans to Nebraska by way of the transcontinental railway. To increase profits, the railroads actively recruited passengers to the Midwest from the northern US and Europe by selling them railroad land grants from between $2 and $10 per acre (Cochrane, Reference Cochrane1979, pp. 84–85). Therefore, Nebraska's 19th century economic development was related to early US exploration, the Missouri River, land distribution, rise of US agriculture and the development of the transcontinental rail system, which were related to health and biological conditions on the Central Plains.
The nineteenth century Nebraska county prison
Throughout the 19th century, there were two penal reform approaches that were prominent in the US: the New York and Pennsylvania systems. On the one hand, the New York system maintained that prisoners were most effectively rehabilitated when they were set to hard manual labour. On the other side of the prison debate was the Pennsylvania system, which maintained that prisoner rehabilitation was most effectively accomplished with solitary confinement, when prisoners were given time to reflect on their offences. The 19th century Nebraska prison followed the New York system, and early prison inmates were set to hard manual labour and constructed much of the Nebraska prison. After prison ward blocks were completed, Nebraska prisoners were put to work constructing other prison facilities.
The Nebraska Territory's first legislated act in 1856 was a statute to construct a state penitentiary. However, it was not until 1869 that the Nebraska state penitentiary came into operation. Between 1856 and 1869, space in surrounding state prisons was rented to house Nebraska prisoners, and the Nebraska state government paid 50 cents per day to room and board each prisoner. During this 15-year interlude, Nebraska territorial representatives lobbied the US congress to construct a state prison in Nebraska. However, with strained national resources after the Civil War, it was not until 1869 that inmates were housed in a permanent Nebraska correctional facility.
All historical height and weight data have selection biases, and the two most common sources of historical height and weight data are military and prison records. One common problem with military records is a truncation bias imposed by minimum stature requirements, and BMIs may have been related to this stature truncation. By arbitrarily truncating shorter individuals in military records, their statures are downwardly biased because only taller individuals with lower BMIs remain in military samples (Floud et al., Reference Floud, Fogel, Harris and Sok2011, p. 85; Sokoloff & Vilaflor, Reference Sokoloff and Villaflor1982, p. 457, Fig. 1; Carson, Reference Carson2012). Because BMIs are inversely related to height, taller military statures are associated with low BMIs (Herbert et al., Reference Herbert, Richards-Edwards, Manson, Ridker, Cook and O'Conner1993, p. 1438; Cuff, Reference Cuff1993; Aloia, et al., Reference Aloia, Vaswani, Ma and Flaster1997). Fortunately, prison records do not suffer from this truncation bias. The prison data probably selected many of the materially poorest individuals, although there are skilled and agricultural workers in the sample. While prison records are not random, the selectivity they represent has its own advantages in BMI studies, such as being drawn from lower socioeconomic groups, that segment of society most vulnerable to economic change (Bogin, Reference Bogin1991, p. 288). Data used to study black and white anthropometrics are a subset of a much larger 19th century prison sample. All available records from American state repositories have been acquired and entered into a master file. These records include Arizona, California, Colorado, Idaho, Illinois, Kansas, Kentucky, Missouri, New Mexico, Ohio, Oregon, Pennsylvania, Texas, Utah and Washington. Together, over 10,496 male inmates from the Nebraska prison were incarcerated between 1869 and 1944 (birth years from 1832 to 1926). Prison guards routinely recorded the dates inmates were received, age at incarceration, complexion, nativity, height, weight, pre-incarceration occupation and crimes. Because there are too few females in the sample for comparison, females are excluded from the analysis; however, female BMIs within other US prison height and weight are considered elsewhere (Carson, Reference Carson2011, Reference Carson2013).
Fortunately, prison enumerators were quite thorough when recording inmate complexion and occupation. For instance, enumerators recorded white inmate complexions as light, fair, dark and sallow. The white inmate complexion classification is also supported by the complexion of European immigrants, who were of fair complexion and were also recorded as light, medium and dark. Enumerators recorded African-American complexions as black, copper and various shades of mulatto, from which race and ethnicity are inferred (Carson, Reference Carson2009b). While mulatto inmates possessed genetic traits from both black and white ancestry, throughout the 19th century mulattos were treated as blacks, and when appropriate, are grouped here with black inmates.
Prison officials recorded a broad continuum of occupations, and defined them narrowly, recording over 100 different occupations from the developing Nebraska economy. These occupations are classified here into six categories. General day labourers are classified as unskilled workers, and ranch and farm labourers are classified as farm labourers. Farmers produced a diverse array of agricultural outputs, which may have translated into taller farmer statures. Ranchers' agricultural production was more specialized in beef production. Carpenters, cabinet makers and various other craftsmen are classified as skilled workers. High-skilled workers and merchants are classified as white-collar workers.
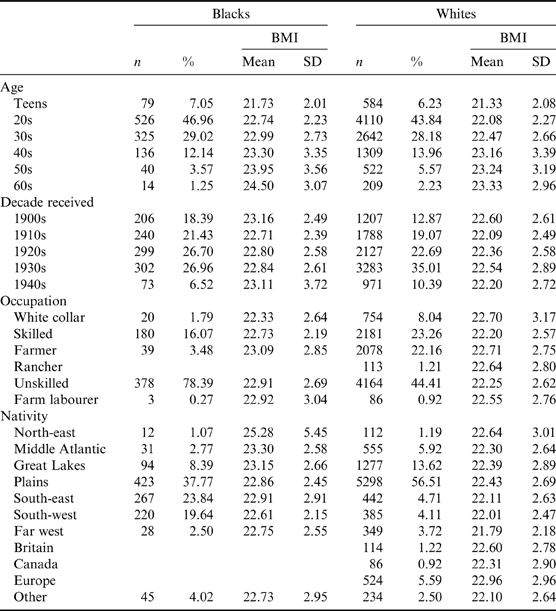
Table 1 presents average BMIs for black and white males incarcerated in the 19th century Nebraska prison by birth year, occupations and nativity. Whites were a larger proportion of the prison sample than blacks; 89% of the Nebraska prison population was white. Occupations reflect socioeconomic status, and while prison inmates typically come from the lower working classes, there was a sizeable share of inmates from white-collar and skilled occupations. White inmates were 349% and 45% more likely than blacks to occupy white-collar and skilled occupations, respectively. In agriculture, whites were 537% more likely than blacks to work in planting and stock-raising occupations. Blacks were 77% more likely than whites to occupy unskilled occupations. Nativity within the prison was mostly from Plains states, which includes Nebraska (see Carlino & Sill, 2000 for a regional breakdown).
Nineteenth century black and white Nebraska prisoner BMIs by birth year, occupation and nativity
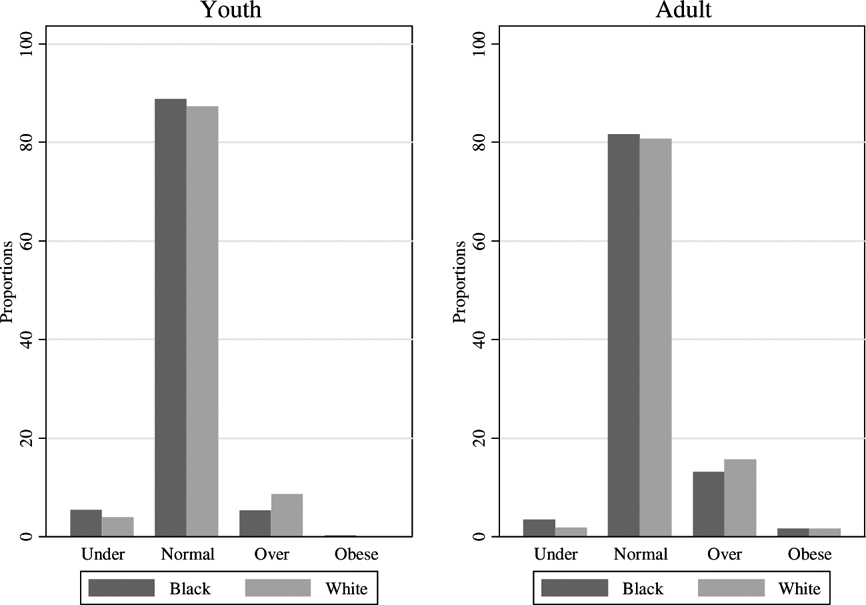
Nineteenth century Nebraska black and white BMI distributions
The shape of the BMI distribution tells us much about the net current biological conditions facing a population. On the one hand, late 19th and early 20th century BMIs in Plains states may have been low because of meager diets relative to work expenditures, which continued into the 19th century. On the other hand, BMIs may have increased as Plains states settlement produced more nutritious diets relative to calories devoted for work and to fend off disease. Given similar means, if the BMI distribution is positively skewed, there is a disproportionate number of underweight individuals, and if the BMI distribution is negatively skewed, there is a disproportionate number of overweight individuals.
Using the World Health Organization (WHO) BMI classification coding system for modern standards, individuals in the Nebraska sample with BMIs greater than 30.00 are obese; BMIs between 24.99 and 29.99 are classified as overweight; BMIs between 18.50 and 24.99 are classified as normal; and BMIs less than 18.50 are classified as underweight. Because BMIs are sensitive to age, two groupings are considered: youths and adults. Figure 2 illustrates that the majority of late 19th and early 20th century black and white BMIs in Nebraska fell within the normal BMI category, and neither starvation nor obesity were the historical precedent in Nebraska. Average black youth and adult BMIs were 22.23 and 22.99, respectively. Average white youth and adult BMIs were 21.62 and 22.52, respectively, indicating that average black BMIs were between 2 and 6 percentage points higher than for whites (Costa, Reference Costa2004, p. 4; Flegal et al., Reference Flegal, Carroll and Ogden2010, p. 240). However, heavier 19th century black BMIs are not necessarily a sign of more robust health, because blacks were shorter than whites, and shorter statures are associated with heavier BMIs (Herbert et al., Reference Herbert, Richards-Edwards, Manson, Ridker, Cook and O'Conner1993, p. 1438). Moreover, it is striking that proportionally so many whites relative to blacks fell into the underweight category. Morbid obesity is a BMI>40, and is linked to greater risks of cardiovascular disease, diabetes mellitus and certain cancers (Pi-Sunyer, Reference Pi-Sunyer1991, p. 1599s; Kenchaiah, Reference Kenchaiah, Evans, Levy, Wilson and Benjamin2002, pp. 306–312; Calle et al., Reference Calle, Rodriguez, Walker-Thurmond and Thun2003, pp. 1628–1630). Cases of 19th century black and white morbid obesity in the Nebraska sample were nearly non-existent. Only 0.18% of blacks and 0.03% of whites in the Nebraska prison were morbidly obese. These historical BMIs are compared with modern standards, where approximately 73.9% of modern adult American men are overweight, and 35.5% obese (Sturm & Wells, Reference Sturm and Wells2001, p. 231; Calle et al., Reference Calle, Thun, Petrelli, Roriguez and Meath1999, p. 1103). Therefore, compared with a modern developed economy, blacks and whites in Nebraska were in moderate weight ranges, obesity was uncommon and morbid obesity among the working class was nearly unheard of.
Nineteenth century Nebraska prison BMIs by age and ethnicity. Under- and over-represent underweight and overweight BMI categories, respectively. Youth ages are from 16 to 21. Adult ages are 22 and older.
Black and white demographics, occupations and BMIs: a qualitative response model
The underweight, normal, overweight and obese categories give a natural ranking for late 19th and early 20th century BMI classifications, and multinomial logit models are used here to illustrate how black and white BMIs were related to personal characteristics. To start, the BMI of the ith individual at time t is classified as underweight, overweight and obese relative to the normal category, where pj is the probability of falling into the jth BMI category.
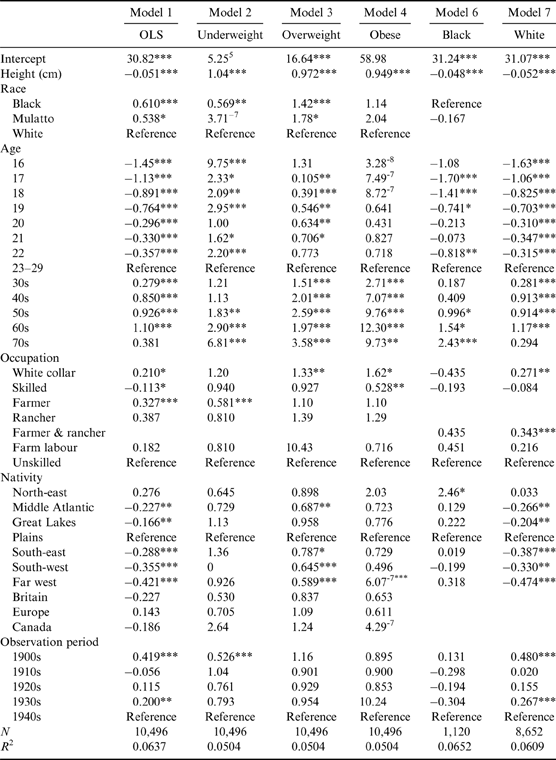
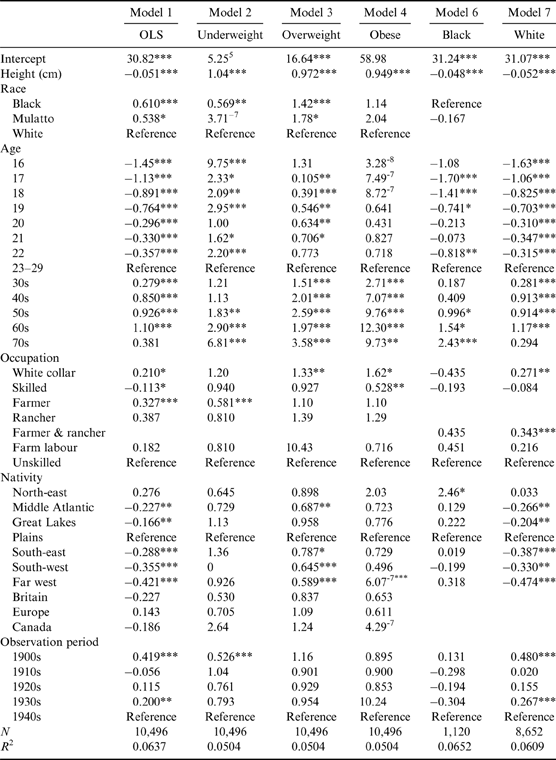
$$log\left(p_j\over p_{Normal}\right)={\alpha}+{\beta}_cCentimetres_i+\sum^2_{r=1}{\beta}_rRace_i+\sum^{15}_{a=1}{\beta}_aAge_i+\sum^4_{i=1}{\beta}_lOccupations_i+\sum^{22}_{n=1}{\beta}_nNativity_i+\sum^{1890}_{t=1770}{\beta}_tDecadereceived_i+{\epsilon}_i$$‘Centimetres’ are included to account for the inverse relationship between BMI and stature (Herbert et al., Reference Herbert, Richards-Edwards, Manson, Ridker, Cook and O'Conner1993; Carson, Reference Carson2009a, Reference Carson2012). Black and mulatto complexion dummy variables account for skin complexion. Dummy variables are included for individual youth ages 16 to 22; adult age dummies are in 10-year age intervals from the 30s to the 60s. Occupation dummy variables are for unskilled, farm labourers, farmers, ranchers and skilled and white-collar workers. Nativity dummy variables are included for national and international nativities. ‘Year received’ dummy variables are in 10-year intervals from 1900 to 1944. Coefficients are reported in odds ratios, which represent the probability of being in a given BMI classification relative to the normal category. For example, in Model 7 in Table 2, the odds ratio for 50-year-olds of 1.62 indicates that 50-year-olds were 62% more likely than the 20-year-old control group to be in the overweight BMI category. Black and white least-squares estimates are also presented and used in the next section's black and white BMI Oaxaca decompositions.
Nineteenth century black and white Nebraska OLS and multinomial regression models
Residence variables within Nebraska were added to the model but are statistically insignificant.
***p<0.01; **p<0.05; *p<0.10.
Three general patterns emerge when comparing 19th century black and white BMIs. First, 19th century whites were taller than mulattos and darker complexioned blacks, and the difference is typically attributed to social preferences that disproportionately favoured fairer complexioned mulattos (Steckel, Reference Steckel1979, p. 373; Margo & Steckel, Reference Margo and Steckel1982, p. 525). However, if mulattos received better biological treatment because of social preferences, fairer complexioned mulattos should have greater BMIs than darker complexioned blacks the farther north they were located (Carson & Hodges, Reference Carson and Hodges2012). Nineteenth century black BMIs in Nebraska were greater than white BMI values (Carson, Reference Carson2009a, p. 126; Carson, Reference Carson2012, p. 382), indicating a mulatto BMI advantage did not exist on the high Central Plains. However, BMIs for darker complexioned blacks were greater after controlling for heights, and blacks also had greater BMIs, in part because muscle is heavier than fat, and blacks are leaner and have lower percentage body fat than whites (Aloia et al., Reference Aloia, Vaswani, Ma and Flaster1997, p. 116; Fernandez et al., Reference Fernandez, Heo, Heymsfield, Pierson, Pi-Sunyer and Wang2003; Evans et al., Reference Evans, Rowe, Racette, Ross and Mcauley2006; Flegal et al., Reference Flegal, Shepherd, Looker, Graubard, Borrud and Ogden2009, p. 507; Flegal et al., Reference Flegal, Carroll and Ogden2010, p. 240). During the early 20th century, US black incomes probably increased, and blacks devoted a higher share of their incomes than whites to food acquisition, which may have been associated with heavier black BMIs (Higgs, Reference Higgs1977; p. 107; Komlos & Lauderdale, Reference Komlos and Lauderdale2005).
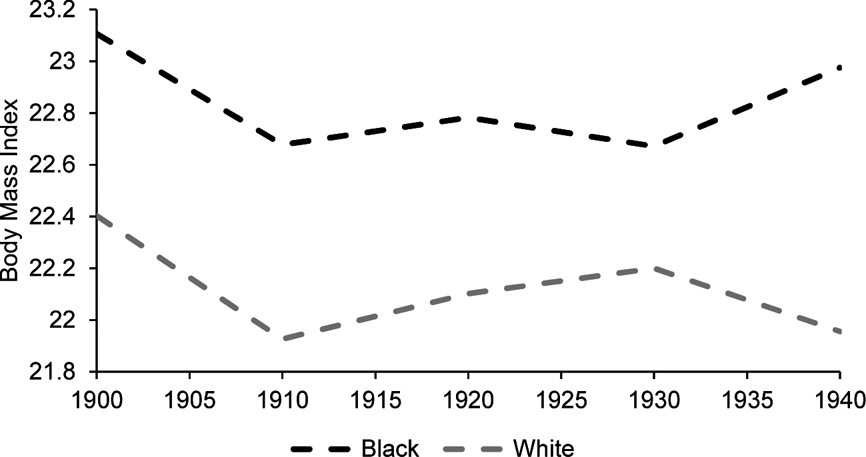
Second, to the degree that BMI represents net current access to calories relative to energy expended for work and to fend off disease, Nebraska BMIs during the early 1900s suggest a period of decreasing or stagnant net nutrition. Floud et al. (Reference Floud, Fogel, Harris and Sok2011, p. 314) and Putnam (Reference Putnam2000) demonstrated that 19th century US calories decreased between 1900 and 1950, which is similar to BMI variation in Nebraska, which was probably the result of industrialization and the separation of food consumption from food production (Komlos, Reference Komlos1987; Carson, Reference Carson2008, p. 368). Moreover, the likelihood that blacks and whites were overweight increased, while the likelihood of underweight blacks and whites decreased, indicating that black and white BMIs on the Central Plains decreased mildly in the early 20th century (Fig. 3; Coclanis & Komlos, Reference Coclanis and Komlos1995, pp. 103 and 108). Unlike modern samples, black and white BMIs in Nebraska show little evidence of a trend towards obesity on the Central Plains, and the increase in the 20th century US obesity trend did not have its origins in the 19th century.
Late 19th and early 20th century Nebraska black and white BMIs over time.
Third, black and white BMIs varied by socioeconomic status, and farmer BMIs were greater than those for workers in other occupations by about 3 percentage points, indicating that rural diets and less exposure to virulent and infectious diseases accrued to farmers, but the difference was small. Nebraska farmer BMIs may have been greater than those of workers in other occupations because BMI represents an individual's composition between muscle and fat. Part of farmers' heavier BMIs was related to physical activity, which is related to occupation. Physically more active occupations decreased fat and increase muscle, and for the same tissue volume muscle is heavier than fat (Carson, Reference Carson2009a, p. 126). Rural farmers were also in close proximity to nutritious diets and removed from disease environments (Komlos, Reference Komlos1985, Reference Komlos1987). White-collar and skilled workers were physically less active, were removed from food production and had lower BMI values.
Other patterns are consistent with expectations. BMI varied considerably by Nebraska, US and international nativities, and BMIs on the Central Plains were greater than for individuals born elsewhere. If BMI represents the net current difference between diets, work expenditures and disease, BMIs in industrialized cities were lower than elsewhere within the US because urban white-collar and skilled workers were physically less active than farmers, had lower muscle content and were removed from rural diets and nutrition (Komlos, Reference Komlos1985). Nineteenth century Nebraska was close to agricultural and beef-producing regions, and animal proteins and amino acids are vital in maintaining muscle mass and health, especially in agricultural regions, indicating the relative price of acquiring dairy production and nutrition was low in Nebraska.
Explaining the Nebraska black–white BMI differential
To more fully account for the source of the black–white BMI differential, a Blinder–Oaxaca BMI decomposition is calculated. A Blinder–Oaxaca decomposition is a statistical technique used to detect discrimination but is also used to explain differences between dependent variables that are due to returns to characteristics and average characteristics. Let BMIw and BMIb represent the BMIs of whites and blacks, respectively; α b and α w are the autonomous BMI components that accrue to blacks and whites; β b and β w are the black and white BMI returns associated with specific stature-enhancing characteristics, such as age and occupation; X b and X w are black and white characteristic matrices, and black BMIs are assumed to be the base structure (Oaxaca, Reference Oaxaca1973, pp. 693–709).
Black BMI function: BMIb=αb+βbX b
White BMI function: BMIw=αw+βwX w
The black and white stature gap is the difference between white and black statures.
ΔBMI=BMIb−BMIw=αb+βbX b−αw−βwX w
Adding and subtracting β wX b to the right-hand side of the equation and collecting like terms leads to: ΔBMI=BMIb−BMIw=(αb−αw)+(βb−βw)X b+βw(X b−X w)
The first right-hand element (α b−α w) is the portion of the BMI differential due to non-identifiable sources, such as greater bone mineral density and greater percentage muscle mass that favoured blacks. The second right-hand-side element, (β b−β w)X b, is that component of the BMI differential due to characteristics. The third right-hand-side element, β w(X b−X w), is the part of the BMI differential due to differences in characteristics and is undetermined because whites probably had characteristics associated with greater BMI values, but blacks were shorter.
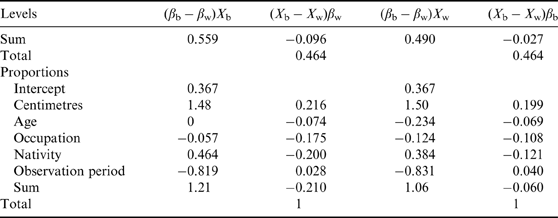
Using coefficients from the BMI regressions (Tables 1 and 2, Model 5 and 6), BMI decompositions indicate that the majority of heavier black BMIs were from non-identifiable characteristics in the intercept, such as greater bone mineral density and lean muscle mass that favoured blacks (Table 3; Barondess et al., Reference Barondess, Nelson and Schlaen1997; Wagner & Hayward, Reference Wagner and Heyward2000). However, the majority of the BMI differential was due to observable characteristics that were associated with stature, indicating 19th century net current biological conditions were related to net cumulative biological conditions. Measured in proportions, whites had greater BMI returns associated with age, occupations and decade received. Blacks had greater BMI returns associated with nativity, and north-eastern blacks had significantly greater BMI returns than their white counterparts. Blacks had greater BMI returns associated with nativity. Therefore, at North American latitudes, the greatest share of the black–white BMI differential was due to black stature returns; however, much of the black–white BMI differential is explained by non-identifiable characteristics, such as differences in lean muscle mass and greater bone mineral density (Barondess et al., Reference Barondess, Nelson and Schlaen1997, pp. 967–971; Flegal et al., Reference Flegal, Carroll and Ogden2010, p. 240).
Discussion
For 19th century blacks and whites in Nebraska, the underclass was reasonably well nourished because of access to agricultural production. Unlike modern BMIs, 19th century Nebraska black and white BMIs were symmetrically distributed and widespread wasting was not common. Rather, black and white BMIs in Nebraska were in normal, healthy BMI categories; therefore, 19th century health on the Central Plains that was poor by modern standards was not related to BMIs. Unlike stature studies, there was no 19th century mulatto BMI advantage, and fairer complexioned individual BMIs were lower than for individuals with darker complexions. Farmers, who were physically active and obtained abundant calories, had greater BMI values than workers in other occupations. Nutrition relative to work expenditures was predictably good in agricultural producing states such as Nebraska, even among the working class, as it was throughout US history because of abundant agricultural resources and access to animal proteins. Therefore, 19th century BMIs in the US were the result of a complex set of demographic and socioeconomic characteristics, and relationships between BMI and observable characteristics reflect economic development.
Acknowledgments
The author appreciates comments from John Komlos, Gary Taubes, Shawna Buckley and Paul Hodges. Shahil Sharma and Brandon Hayes provided excellent research assistance.