



%20--%3e%3c!DOCTYPE%20svg%20PUBLIC%20'-//W3C//DTD%20SVG%201.0//EN'%20'http://www.w3.org/TR/2001/REC-SVG-20010904/DTD/svg10.dtd'%3e%3csvg%20version='1.0'%20id='Layer_1'%20xmlns='http://www.w3.org/2000/svg'%20xmlns:xlink='http://www.w3.org/1999/xlink'%20x='0px'%20y='0px'%20width='64px'%20height='64px'%20viewBox='5.5%20-3.5%2064%2064'%20enable-background='new%205.5%20-3.5%2064%2064'%20xml:space='preserve'%3e%3cg%3e%3ccircle%20fill='%23FFFFFF'%20fill-opacity='0'%20cx='37.785'%20cy='28.501'%20r='28.836'/%3e%3cpath%20fill='%23595959'%20d='M37.441-3.5c8.951,0,16.572,3.125,22.857,9.372c3.008,3.009,5.295,6.448,6.857,10.314%20c1.561,3.867,2.344,7.971,2.344,12.314c0,4.381-0.773,8.486-2.314,12.313c-1.543,3.828-3.82,7.21-6.828,10.143%20c-3.123,3.085-6.666,5.448-10.629,7.086c-3.961,1.638-8.057,2.457-12.285,2.457s-8.276-0.808-12.143-2.429%20c-3.866-1.618-7.333-3.961-10.4-7.027c-3.067-3.066-5.4-6.524-7-10.372S5.5,32.767,5.5,28.5c0-4.229,0.809-8.295,2.428-12.2%20c1.619-3.905,3.972-7.4,7.057-10.486C21.08-0.394,28.565-3.5,37.441-3.5z%20M37.557,2.272c-7.314,0-13.467,2.553-18.458,7.657%20c-2.515,2.553-4.448,5.419-5.8,8.6c-1.354,3.181-2.029,6.505-2.029,9.972c0,3.429,0.675,6.734,2.029,9.913%20c1.353,3.183,3.285,6.021,5.8,8.516c2.514,2.496,5.351,4.399,8.515,5.715c3.161,1.314,6.476,1.971,9.943,1.971%20c3.428,0,6.75-0.665,9.973-1.999c3.219-1.335,6.121-3.257,8.713-5.771c4.99-4.876,7.484-10.99,7.484-18.344%20c0-3.543-0.648-6.895-1.943-10.057c-1.293-3.162-3.18-5.98-5.654-8.458C50.984,4.844,44.795,2.272,37.557,2.272z%20M37.156,23.187%20l-4.287,2.229c-0.458-0.951-1.019-1.619-1.685-2c-0.667-0.38-1.286-0.571-1.858-0.571c-2.856,0-4.286,1.885-4.286,5.657%20c0,1.714,0.362,3.084,1.085,4.113c0.724,1.029,1.791,1.544,3.201,1.544c1.867,0,3.181-0.915,3.944-2.743l3.942,2%20c-0.838,1.563-2,2.791-3.486,3.686c-1.484,0.896-3.123,1.343-4.914,1.343c-2.857,0-5.163-0.875-6.915-2.629%20c-1.752-1.752-2.628-4.19-2.628-7.313c0-3.048,0.886-5.466,2.657-7.257c1.771-1.79,4.009-2.686,6.715-2.686%20C32.604,18.558,35.441,20.101,37.156,23.187z%20M55.613,23.187l-4.229,2.229c-0.457-0.951-1.02-1.619-1.686-2%20c-0.668-0.38-1.307-0.571-1.914-0.571c-2.857,0-4.287,1.885-4.287,5.657c0,1.714,0.363,3.084,1.086,4.113%20c0.723,1.029,1.789,1.544,3.201,1.544c1.865,0,3.18-0.915,3.941-2.743l4,2c-0.875,1.563-2.057,2.791-3.541,3.686%20c-1.486,0.896-3.105,1.343-4.857,1.343c-2.896,0-5.209-0.875-6.941-2.629c-1.736-1.752-2.602-4.19-2.602-7.313%20c0-3.048,0.885-5.466,2.658-7.257c1.77-1.79,4.008-2.686,6.713-2.686C51.117,18.558,53.938,20.101,55.613,23.187z'/%3e%3c/g%3e%3c/svg%3e)
%20--%3e%3c!DOCTYPE%20svg%20PUBLIC%20'-//W3C//DTD%20SVG%201.0//EN'%20'http://www.w3.org/TR/2001/REC-SVG-20010904/DTD/svg10.dtd'%3e%3csvg%20version='1.0'%20id='Layer_1'%20xmlns='http://www.w3.org/2000/svg'%20xmlns:xlink='http://www.w3.org/1999/xlink'%20x='0px'%20y='0px'%20width='64px'%20height='64px'%20viewBox='5.5%20-3.5%2064%2064'%20enable-background='new%205.5%20-3.5%2064%2064'%20xml:space='preserve'%3e%3cg%3e%3ccircle%20fill='%23FFFFFF'%20fill-opacity='0'%20cx='37.637'%20cy='28.806'%20r='28.276'/%3e%3cg%3e%3cpath%20fill='%23595959'%20d='M37.443-3.5c8.988,0,16.57,3.085,22.742,9.257C66.393,11.967,69.5,19.548,69.5,28.5c0,8.991-3.049,16.476-9.145,22.456%20C53.879,57.319,46.242,60.5,37.443,60.5c-8.649,0-16.153-3.144-22.514-9.43C8.644,44.784,5.5,37.262,5.5,28.5%20c0-8.761,3.144-16.342,9.429-22.742C21.101-0.415,28.604-3.5,37.443-3.5z%20M37.557,2.272c-7.276,0-13.428,2.553-18.457,7.657%20c-5.22,5.334-7.829,11.525-7.829,18.572c0,7.086,2.59,13.22,7.77,18.398c5.181,5.182,11.352,7.771,18.514,7.771%20c7.123,0,13.334-2.607,18.629-7.828c5.029-4.838,7.543-10.952,7.543-18.343c0-7.276-2.553-13.465-7.656-18.571%20C50.967,4.824,44.795,2.272,37.557,2.272z%20M46.129,20.557v13.085h-3.656v15.542h-9.944V33.643h-3.656V20.557%20c0-0.572,0.2-1.057,0.599-1.457c0.401-0.399,0.887-0.6,1.457-0.6h13.144c0.533,0,1.01,0.2,1.428,0.6%20C45.918,19.5,46.129,19.986,46.129,20.557z%20M33.042,12.329c0-3.008,1.485-4.514,4.458-4.514s4.457,1.504,4.457,4.514%20c0,2.971-1.486,4.457-4.457,4.457S33.042,15.3,33.042,12.329z'/%3e%3c/g%3e%3c/g%3e%3c/svg%3e)
1. Introduction
Differential melt exerts a powerful control on the topographic evolution of debris-covered glaciers. Caused by contrasts in debris thickness, differential melt produces topographic relief because debris cover insulates the underlying ice from melt (Östrem, Reference Östrem1959). Although it is widely understood that differential melt helps produce an irregular, hummocky surface (Nicholson and Benn, Reference Nicholson and Benn2006), we lack a quantitative understanding of relief production from differential melt.
Glacier dirt cones are intriguing examples of topographic features that develop from differential melt (Fig. 1). Dirt cones are debris-mantled cones of ice that form on some glaciers (Agassiz and Bettannier, Reference Agassiz and Bettannier1840; Swithinbank, Reference Swithinbank1950). Due to their resemblance to ant mounds, dirt cones are colloquially known in Alaska as ‘anthills’ (A. Sayer, pers. comm., 6 February 2023). The cones are typically elliptical at the base and their heights range from a few centimeters to tens of meters (Agassiz and Bettannier, Reference Agassiz and Bettannier1840; Swithinbank, Reference Swithinbank1950; Drewry, Reference Drewry1972). Glaciologists have noted the presence of dirt cones for at least 170 years (Agassiz and Bettannier, Reference Agassiz and Bettannier1840), and dirt cones have been documented in scientific literature on glaciers in Alaska (Whitney, Reference Whitney1932), the European Alps (Agassiz and Bettannier, Reference Agassiz and Bettannier1840; Goodsell and others, Reference Goodsell, Hambrey and Glasser2005; Hénot and others, Reference Hénot, Langlois, Plihon and Taberlet2023), Greenland (Drewry, Reference Drewry1972), New Zealand (Krenek, Reference Krenek1958; Reference Krenek1959) and Antarctica (Campbell and Claridge, Reference Campbell and Claridge1975).
Dirt cones on the Kuskulana Glacier in Wrangell-St. Elias National Park, AK. (a) This dirt cone (DC-7) was ∼3 m tall and was covered in a thin layer of sediment. Boulders surrounded the base. (b) The largest dirt cone we observed (DC-4) was ∼5 m tall and formed adjacent to a crevasse/moulin (partially visible in lower left). The cobbles and boulders atop this dirt cone were substantially more rounded and lighter in color than nearby debris. (c) This small dirt cone was <0.5 m tall and covered with a mixture of coarse sand, silt and gravel.

Agassiz and Bettannier Reference Agassiz and Bettannier(1840) presented the first conceptual model of dirt cone formation (see also Swithinbank Reference Swithinbank(1950)), hypothesizing that dirt cones develop from thick sediment deposits within crevasses. In this model, supraglacial streams transport and deposit sediment within a crevasse. Then, differential melt between the debris-filled crevasse and the surrounding bare ice leads to topographic inversion of the crevasse and the formation of a debris-mantled cone of ice. Several similar conceptual models were later proposed. These attributed the dirt cones to debris deposits within abandoned supraglacial channels (Sharp, Reference Sharp1949) or drained supraglacial ponds (Campbell and Claridge, Reference Campbell and Claridge1975). Krenek Reference Krenek(1959) suggested an alternative mechanism where cones develop from debris-covered ‘islands’ left by braided supraglacial channels. In all of these models, meltwater drainage creates the concentrations of debris necessary to produce the cones.
Physical experiments examined the development of small dirt cones (<0.5 m) from thin, man-made patches of debris (≤0.125 m thick) in effort to better understand how melt rates and debris thickness influence cone height (Drewry, Reference Drewry1972; Hénot and others, Reference Hénot, Langlois, Plihon and Taberlet2023). However, the quantitative findings from Drewry Reference Drewry(1972) and Hénot and others Reference Hénot, Langlois, Plihon and Taberlet(2023) experiments disagree on the limits of cone growth. The ratio of cone height to total melt at the base is called the growth factor. Drewry Reference Drewry(1972) found growth factors in physical experiments to be no  $ \gt \sim$0.5, and all but one growth factor was <0.36. In contrast, experiments by Hénot and others Reference Hénot, Langlois, Plihon and Taberlet(2023) produced cones with growth factors 0.5–1. These conflicting results suggest that the bare ice melt rate, initial debris thickness and the debris diffusion rate influence cone development in ways not accounted for by Hénot and others Reference Hénot, Langlois, Plihon and Taberlet(2023) and Drewry Reference Drewry(1972). Hénot and others Reference Hénot, Langlois, Plihon and Taberlet(2023) also developed a 2-D numerical dirt cone model that simulated the granular mechanics of debris flux and thermal fluxes within the debris layer. The model successfully simulated the development of dirt cones from patches of surface debris. However, these experiments did not test a range of bare ice melt rates or debris diffusivities (Hénot and others, Reference Hénot, Langlois, Plihon and Taberlet2023).
Our goal in this study is to examine the formation of glacier dirt cones to better understand the production of topographic relief from differential melt. First, we report observations and measurements of dirt cones on the debris-covered Kuskulana Glacier, in Wrangell-St. Elias National Park, Alaska (Fig. 2). Then, we develop a 2-D numerical model that simulates the development of dirt cones from debris-filled pits in the ice surface. In contrast to previous topographic evolution models of debris-covered glaciers (e.g. Moore, Reference Moore2021), our implementation allows for sharp gradients in debris thickness, such as those created by debris-filled pits. We use the model to examine how varying the debris volume, the bare ice melt rate and the debris diffusivity influence cone development. We qualitatively compare these model results to our field observations of dirt cones that formed on the Kuskulana Glacier. These results improve quantitative understanding of how differential melt and debris diffusion produce relief on debris-covered glaciers.
A map of the Kuskulana Glacier and (inset) Wrangell-St. Elias National Park, Alaska. Dirt cone locations are marked with white triangles and moulin locations are marked with cyan dots. Glacier flow speeds in this region of the glacier range from 0 to 50 m/y and are denoted with the bold contours at 10 m/y intervals. The thin, white elevation contour interval is 300 m.

2. Study site
The debris-covered Kuskulana Glacier (61.64∘ N, 143.62∘ W, 790–4900 m elevation) is located in the Wrangell Mountains of Alaska, within Wrangell-St. Elias National Park (Fig. 2). The main trunk of the Kuskulana Glacier flows west and is predominantly debris-covered below 1700 m elevation. Flow speeds along the debris-covered trunk are ∼50 m/y near the center of flow but decrease rapidly toward the margins and terminus. Two prominent bands of clean ice extend parallel to flow in this region of lateral shear down to 1100 m elevation.
2.1. Dirt cones on the Kuskulana Glacier
Our survey of the Kuskulana Glacier explored the region above ∼900 m elevation along the main glacier trunk. The upper extent of our survey region reached ∼1400 m elevation. As stated previously, two prominent clean-ice bands extended down-glacier before becoming completely debris-covered by ∼1100 m elevation. The northern ice band formed an elevated ridge with a large supraglacial stream on its southern side. The southern clean-ice band, however, formed a shallow trough. The trough began at the confluence of a northwest-flowing tributary glacier at 1400 m elevation and extended west for ∼4 km before becoming completely debris-covered. In the ice trough, the glacier undergoes lateral shear in flow. We noted the presence of marginal (chevron) crevasses and little topographic relief within the ice trough relative to the hummocky, debris-covered topography tens-of-meters to the north. Numerous supraglacial streams flowed down and across the trough. These streams terminated into crevasses and moulins.
We recorded the GPS locations of 9 dirt cones on the southern ice trough of the Kuskulana Glacier and 15 large moulins (∼1–4 m diameter at glacier surface) within and adjacent to the trough (Fig. 2). All positions were recorded with a Garmin inReach handheld GPS. These GPS coordinates were used to approximate the elevations of each dirt cone using the 5 Meter Alaska Digital Elevation Model, published with the USGS 3DEP Data Collection. Glacier surface velocities at each dirt cone were generated using auto-RIFT and approximated using the NASA MEaSUREs ITS_LIVE project (Gardner and others, Reference Gardner, Fahnestock and Scambos2024).
2.2. Surveys and observations
We undertook detailed surveys of five dirt cones and recorded observations of four additional cones. For each survey, we photographed the cones from all sides to document the cone geometry. We then excavated a narrow trench parallel to the cone slope to document debris properties and to measure debris thickness. The purpose of the debris thickness measurements was to quantify the range of debris thicknesses found on dirt cones for the purpose of comparing to model output. When possible, debris thickness measurements were made at the top, middle and base of the cone. However, thick debris often made it impossible for us to measure debris thickness at more than a single point. Debris layer thickness was measured using a centimeter graded ruler printed in a field notebook cover. The distributions of debris grain sizes on each dirt cone were visually approximated in the field using a Wentworth grain size chart.
We measured the cone slopes to determine if/when the debris surface slope approximates the underlying ice surface slope. Ice surface slopes were measured directly by removing the surface debris and placing the flat edge of a Suunto PM5/360PC Clinometer against the ice. At least one direct measurement of ice surface slope was recorded for each cone we surveyed. These measurements showed that ice surface slopes are approximately equal to the debris surface slope. However, measuring the ice surface slope was only possible in places where the debris layer was thin enough that we could remove the debris from ice surface without it immediately becoming re-buried by debris up-slope. The debris surface slopes were measured from photographs in ImageJ. For each image, the cone slope angles were measured relative to the horizontal orientation of the images on both sides of the cone profile. To reduce biases in these measurements, between 7 and 14 slope angles were measured for each cone using at least five different photographs captured from different aspects of each cone. Only images of cones completely within the center of the field of view were used to limit the influence of lens distortion.
2.2.1. DC-1a and DC-1b
Dirt cones DC-1a and DC-1b formed adjacent to one another. The pair were located at an elevation of ∼1290 m in a region flowing ∼10 m/y at the confluence of the Kuskulana Glacier with a north-flowing tributary glacier. DC-1a was ∼2 m tall and DC-1b was ∼1 m tall. Both were nearly circular cones. The area surrounding the cones was covered with a thin layer of debris cobbles and small boulders. The ice surface was visible between clasts at the base of the cone. The sediment covering both cones was composed of fine-grained and rounded clasts. The debris grain sizes generally increased down slope on each cone, with the largest clasts clustered around the bases.
The debris on DC-1a was composed primarily of coarse sand, with intermixed rounded pebbles and cobbles. The sediment was finer on the upper half of the cone slope compared to the lower half. Debris depths on the northern aspect of DC-1a increased from 0.05 m at the apex to 0.1 m at the base. Debris depths were ∼2× greater on the southern aspect of cone DC-1a than the northern aspect. The ice surface slope was 35∘ and the median debris slope angle was 33.1∘.
The debris on DC-1b was composed primarily of fine and coarse sand, with fewer rounded cobbles and pebbles than observed on DC-1a. Debris depth was ∼0.1 m and uniform thickness from apex to the base. The ice surface slope was 40∘ near the apex and increased to 45∘ near the base. The median debris slope angle on DC-1b was 35.4∘.
2.2.2. DC-4
DC-4 was the largest dirt cone (∼6 m tall) we observed on the Kuskulana Glacier (Fig. 3). It was located at an elevation of 1200 m, where the glacier flows ∼10 m/y. DC-4 was much longer than it was wide, forming an elevated ridge. The dirt cone ridge ran parallel to a nearby marginal crevasse with an actively draining moulin. The region surrounding DC-4 was generally debris covered; however, there were patches of bare ice with drainage runnels on the northern and southern sides. The debris covering DC-4 was notably lighter in color and the clasts significantly more rounded than the surrounding debris. Boulders surrounded the base and lower slopes of DC-4.
The largest dirt cone we observed on the Kuskulana Glacier (DC-4). A long, low ridge of debris connected to the cone (from lower right to center). This debris ridge was parallel to nearby crevasses. The debris covering this cone was lighter in color and more rounded than surface debris nearby.

The debris covering DC-4 was much thicker at the apex than the base. Debris at the cone apex exceeded 0.5 m, and we were not able to excavate deep enough to reach the ice surface at these points before the trenches re-filled with debris. The debris at the base of the south face of this dirt cone was 0.15 m. The debris covering the cone was composed of coarse sand and rounded cobbles and pebbles. The ice surface slope at the base was 25∘ and the median debris surface slope was 28.4∘.
2.2.3. DC-6
DC-6 was located on a debris-covered hillslope ∼20 m north of the clean-ice band. The cone was located at 1180 m elevation and in a region flowing ∼25 m/y. DC-6 was between 1 and 2 m tall and the sediment covering it was more fine-grained and lighter in color than the debris surrounding the cone. Large cobbles and a few boulders surrounded the base of the cone. Several large crevasses and moulins were observed nearby.
Sediment covering DC-6 was primarily a coarse sand with rounded pebbles and cobbles intermixed. More angular cobbles and small boulders were present atop the finer sediment. The fine sediment on DC-6 was ∼0.1 m thick. The ice surface slope ranged from 30∘ to 35∘. The median debris surface slope was 33.9∘.
2.2.4. DC-7
Cone DC-7 formed along the border between the clean-ice band and debris cover, ∼35 m southwest of DC-6, at 1170 m elevation. The glacier velocity in this area is ∼25 m/y. DC-7 was between 2 and 3 m tall and was covered with dark-colored sediment. Large cobbles and boulders surrounded the base of the cone.
The sediment on DC-7 was composed of coarse sand, rounded pebbles and cobbles, and silt. Debris thickness varied along the cone slopes from 0.08 to 0.15 m. However, bare ice was visible on the steepest slopes. The ice surface slopes were 40∘–45∘ and the median debris surface slope was 39.6∘.
2.2.5. Other observations
DC-2 formed at 1240 m elevation in a region with three small debris cones ranging from 0.1 to 1 m in height. These cones formed in a sparsely debris-covered area with many small meltwater channels. These cones were covered with thin layers of sand and rounded pebbles. Glacier velocity in this area is ∼20 m/y.
DC-3 was a pair of cones ∼1 m tall that formed on a debris-covered hillside near a meltwater drainage channel at an elevation of 1220 m. Fine sediment and silt ∼0.02 m thick covered these cones. Bare ice was exposed on the west-facing aspects of these cones. Glacier velocity in this area is ∼20 m/y.
DC-5 formed at 1195 m elevation. The cone was ∼0.1 m in height surrounded by a ring of rounded cobbles. Sand and rounded pebbles covered the cone. The rounded clasts atop and surrounding DC-5 were lighter in color than clasts nearby. This cone formed in a region with several open crevasses and moulins. Glacier velocity in this area is ∼15 m/y.
DC-8 was a large cone 3–4 m tall that formed adjacent to a meltwater stream at 1115 m elevation. The cone was covered with a thin layer of fine, dark-colored sediment and a few large boulders surrounded the base of the cone. A steep section of bare ice was exposed on the south facing aspect of DC-8. Glacier velocity in this area is ∼15 m/y.
2.3. Summary of observations
The dirt cones on the Kuskulana Glacier developed along and adjacent to a band of clean ice. Crevasses and moulins were observed in close proximity to the dirt cones. The cones ranged in height from <0.1 m to more than 3 m in height and formed pointed apexes or sharp ridges. In contrast to the angular clasts and unsorted sediment that surrounded the dirt cones, the sediment atop and at the bases of dirt cones was rounded and stratified by grain size. The median debris slopes ranged from 28∘ to 40∘ and ice slopes ranged from 25∘ to 45∘ (Fig. 4). Debris thicknesses on the cones varied significantly between cones, ranging from 0.01 m to thicknesses >0.5 m.
Mean slopes of dirt cones on the Kuskulana Glacier. Slopes were measured from photographs of each cone using ImageJ.

3. Modeling dirt cone development
3.1. Conceptual model
Based on our observations, we infer that the dirt cones on the Kuskulana Glacier developed from fluvially deposited debris in crevasses and moulins, as described by Agassiz and Bettannier Reference Agassiz and Bettannier(1840). Figure 5 illustrates this process. We speculate plunge pools form via vertical drilling when supraglacial streams drain into crevasse/moulins (Covington and others, Reference Covington, Gulley, Trunz, Mejia and Gadd2020). Glacier advection and the opening of new crevasses causes some of these moulins to be abandoned, leaving a sediment deposit within the ice. Melt progressively lowers the glacier surface, eventually transforming the relict plunge pool into a debris-filled pit at the glacier surface. Finally, as Agassiz and Bettannier Reference Agassiz and Bettannier(1840) described, cone development commences as differential melt causes the debris-filled pit to gain relief relative to the surrounding bare ice. The rounded clasts and sediment sorting we observed atop the cones strongly suggest fluvial debris transport. However, the only strict requirement for this conceptual model is a concentration of sediment within a pit or crevasse surrounded by faster-melting ice.
The Agassiz model of dirt cone development, extended to encompass debris deposition in moulins. As supraglacial streams flow into moulins/crevasses, they create plunge pools that trap sediment. Moulins become abandoned as the glacier advects, leaving a debris-filled pit within the ice. Melt eventually lowers ice surface to the debris pit. Differential melt leads to the development of a dirt cone.

In the field, we observed moulin/crevasse depths to be on the order of ∼10–30 m. Glacier speeds where the dirt cones were present are ∼20 m/y (Fig. 2). Although there are no reported surface lowering rates on the Kuskulana Glacier, surface lowering at similar elevations on the nearby Kennicott Glacier are ∼1–3 m/y (Anderson and others, Reference Anderson, Armstrong, Anderson and Buri2021). Therefore, we infer that the abandoned moulins likely advected ∼60–600 m before dirt cone emergence. The time required for a dirt cone to fully develop after emergence depends on the initial volume of sediment, the melt rate and the debris diffusion rate. Quantitatively examining the development of dirt cones from a debris-filled pit at the ice surface is the focus of the remaining sections.
3.2. Mathematical model
We developed a mathematical model to explore the dynamics of dirt cone growth and controls on cone geometry. In the following section, the relevant equations are presented and a dimensionless model is derived. The numerical implementation of this model incorporates two advancements in modeling topographic evolution on debris-covered glaciers: (1) it simulates topographic evolution in two dimensions and (2) it removes a simplifying assumption used in other models that requires gradients in debris thickness to be small (e.g. Moore, Reference Moore2021). With the model, we examine the influence of bare ice melt rate, debris diffusivity and sediment volume on the development of dirt cones. The results help guide understanding of how glacier dirt cones and, more generally, topographic relief develops through differential melt.
Debris thickness, h, controls the ice ablation rate,  $\partial s/\partial t$, on debris-covered glaciers. Although a very thin debris layer (
 $ \lt \sim3$ cm) increases melt rates relative to bare ice (Östrem, Reference Östrem1959), it is common to approximate sub-debris melt with a hyperbolic model (Anderson and Anderson, Reference Anderson and Anderson2016; Reference Anderson and Anderson2018; Mölg and others, Reference Mölg, Ferguson, Bolch and Vieli2020; Moore, Reference Moore2021):
 \begin{equation}
\frac{\partial s}{\partial t} = -b_0 \frac{h_\mathrm{c}}{h_\mathrm{c} + h} \;,
\end{equation}
where b 0 is the bare-ice melt rate, s is the ice surface elevation and  $h_\mathrm{c}$ is an empirically derived characteristic debris thickness that scales how rapidly melt rates decrease as debris thickness increases (Anderson, Reference Anderson2000).
Sediment flux on debris-mantled glacier hillslopes depends on slope and the debris thickness. Terrestrial landscape evolution models simulate hillslope debris flux as a diffusion process that can depend either linearly (Gilbert, Reference Gilbert1909; Perron and others, Reference Perron, Dietrich and Kirchner2008) or nonlinearly (Andrews and Bucknam, Reference Andrews and Bucknam1987; Roering and others, Reference Roering, Kirchner and Dietrich2001; Perron, Reference Perron2011) on topographic slope. Nonlinear models force a rapid increase in flux as hillslopes approach a critical slope,  $S_\mathrm{c}$. Slope-stability models (Moore, Reference Moore2018) and observations (Nicholson and others, Reference Nicholson, McCarthy, Pritchard and Willis2018) showed that slopes on debris covered glaciers become increasingly unstable and prone to failure as hillslopes steepen. Furthermore, the widespread development of ice cliffs on debris-covered glaciers exemplifies a threshold steepness where ice slopes can no longer support a debris layer. This supports the use of a nonlinear debris flux model for debris-covered glaciers.
Similar to Moore Reference Moore(2021), we employ an expression for nonlinear debris flux (Andrews and Bucknam, Reference Andrews and Bucknam1987; Roering and others, Reference Roering, Kirchner and Dietrich2001) and modify it to account for a finite-thickness debris layer:
 \begin{equation}
Q = -D(1-\mathrm{e}^{-h/h_\mathrm{D}})\frac{\nabla z}{1-\left(\frac{|\nabla z|}{S_\mathrm{c}}\right)^2} \;,
\end{equation}
where D is the debris diffusivity. The topographic surface, z, is defined as the sum of debris thickness and ice elevation. In the dirt cone model, nonlinear flux keeps the cone slopes from becoming unrealistically steep. Here,  $h_\mathrm{D}$ is a characteristic thickness for debris diffusion, where diffusion rates rapidly decline when debris thins below this depth. When
 $h\gg h_\mathrm{D}$, debris thickness does not substantially influence debris flux. The critical debris thickness in Eqn (2) should be small enough to ensure diffusion rates are not too low when debris is thick, while still allowing flux to go to zero as the debris layer thins. We follow Moore Reference Moore(2021) and assume that both critical debris thicknesses are approximately the same. In all model runs explored here, and in the equations below, we set
 $h_\mathrm{D}=h_\mathrm{c}$.
From conservation of mass, the time rate of change in debris thickness along a hillslope is
 \begin{equation}
\frac{\partial h}{\partial t} = D\nabla \cdot \left[(1-\mathrm{e}^{-h/h_\mathrm{c}})\frac{\nabla z}{1-\left(\frac{|\nabla z|}{S_\mathrm{c}}\right)^2}\right] \;.
\end{equation}
When evaluating the divergence, previous models on debris-covered glaciers assumed that debris flux is dominated by topographic slope (Anderson, Reference Anderson2000; Moore, Reference Moore2021). Although this assumption is reasonable for relatively uniform debris layers, it does not account for steep gradients in debris thickness that do not follow the topographic slope, such as debris-filled pits in the ice surface. In our implementation of this model, we allow for spatial gradients in debris thickness to influence debris flux, keeping  $1-\mathrm{e}^{-h/h_\mathrm{c}}$ within the divergence operation.
The sum of Eqns (1) and (3) gives the time rate of change in topographic elevation:
 \begin{equation}
\frac{\partial z}{\partial t} = -b_0 \left(\frac{h_\mathrm{c}}{h_\mathrm{c} + h}\right) + D \nabla \cdot \left[(1-\mathrm{e}^{-h/h_\mathrm{c}})\frac{\nabla z}{1-\left(\frac{|\nabla z|}{S_\mathrm{c}}\right)^2} \right] \;.
\end{equation}
We scale this equation using the characteristic debris depth,  $h_\mathrm{c}$, and an initially undefined characteristic length scale,
 $\ell$:
 \begin{equation*}
h = h_\mathrm{c}h^*\quad
\nabla = \frac{\nabla^*}{\ell}\quad
z = \ell z^*\quad
t = \frac{\ell}{b_0} t^* \;.
\end{equation*}
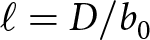
After scaling, it becomes natural to define the length scale as  $\ell = D/b_0$. This length scale is similar to the characteristic hillslope length utilized in landscape evolution models (Roering and others, Reference Roering, Kirchner and Dietrich2001; Perron, Reference Perron2011). In our case,
 $\ell$ approximates the distance at which horizontal debris diffusion rates are matched by vertical lowering rates from melt. At distances greater than
 $\ell$ from the debris source, melt processes will dominate. Putting it all together, we have the dimensionless model
 \begin{equation}
\frac{\partial z^*}{\partial t^*} = -\frac{1}{1 + h^*} + \nabla^* \cdot \left[(1-\mathrm{e}^{-h^*}) \frac{\nabla^* z^*}{1-\left(\frac{|\nabla^* z^*|}{S_\mathrm{c}}\right)^2} \right]\; .
\end{equation}
When  $h\gg h_\mathrm{c}$, sub-debris melt is negligible (
 $(1+h^*)^{-1}\rightarrow 0$). Thus, if debris is thick, the debris diffusion term dominates changes in surface elevation. As the debris thins (
 $h^*\rightarrow 0$), diffusion rates slow because
 $1-\mathrm{e}^{-h^*}\rightarrow 0$, thus sub-debris melt plays an increasingly important role in changes in elevation.
Since Eqn (5) is a function of both  $z^*$ and
 $h^*$, we need a second equation to specify the system. To obtain this, we convert Eqn (1) into dimensionless form, using
 $s=\ell s^*$ and
 $s=z-h$, which leads to
 \begin{equation}
\frac{\partial z^*}{\partial t^*} - \frac{h_c b_0}{D} \frac{\partial h^*}{\partial t^*} = -\frac{1}{1+h^*}.
\end{equation}
4. Numerical experiments
Based on the mathematical model, we developed a 2-D numerical model using the Python-based Landlab modeling library to examine the development of dirt cones. The model space consists of a square grid of evenly spaced nodes connected by links. Ice elevation, debris thickness and topographic elevation were stored on the nodes. Debris flux was stored on the links. Ice melt (Eqn (1)) and debris flux (Eqn (3)) were solved explicitly with time step length  $\Delta t = 0.1$ day and horizontal node spacing
 $\Delta x = 0.025$ m. The von Neumann stability criterion, r, for for our chosen time step length and spatial resolution was r < 0.07 for all diffusivities examined.
Each simulation began with a circular, debris-filled pit in the ice surface and was allowed to develop into a cone. The simulations were stopped when the debris thickness at the cone apex became <0.01 m. Debris below the lip of the pit cannot be transported. Therefore, properly calculating debris flux requires calculating the thickness of debris above the edge of the pit, referred to as the transportable debris ( $h_\mathrm{T}$). We used a sink-filling algorithm to calculate the transportable debris thickness. The transportable debris thickness is the difference between the debris surface elevation and the elevation of the ice at the edge of the pit. Outside of a pit, and after the pit undergoes topographic inversion, the transportable debris thickness is equivalent to the debris thickness.
Figure 6 shows a dirt cone with key variables labeled. Table 1 lists the range of values, units and description of each parameter and variable used in the simulations. The range of bare ice melt rates encompasses the values measured on the nearby Kennicott Glacier, AK by Anderson and others Reference Anderson, Armstrong, Anderson and Buri(2021) that correspond with the elevations of dirt cones on the Kuskulana Glacier. Based on measurements by Fyffe and others Reference Fyffe, Woodget, Kirkbride, Deline, Westoby and Brock(2020), we calculated that debris diffusion rates likely range from ∼0.001 to 0.05 m2 d−1 for grains <1 m in diameter. We set  $h_\mathrm{c} = 0.08$ m, the best-fit calculated from measurements on the Kennicott Glacier, AK (Anderson and others, Reference Anderson, Armstrong, Anderson and Buri2021). The critical slope,
 $S_\mathrm{c}$, describes the steepness at which debris flux is infinite. We assumed this threshold to be equivalent to the mean slope of ice cliffs. Anderson and others Reference Anderson, Armstrong, Anderson and Buri(2021) reported that the mean ice cliff steepness was 1.15 m m−1, thus
 $S_\mathrm{c} \sim 1.15$. The range of values we examine in these simulations encompass the range of ice cliff slopes reported in Anderson and others Reference Anderson, Armstrong, Anderson and Buri(2021).
A diagram of a dirt cone with key variables labeled. Only the debris thickness above the edge of the pit ( $h_\mathrm{T}$) is transportable. In regions outside of the pit, and after the pit inverts,
 $h_\mathrm{T} = h$. Cone heights (z ’) are the sum of the ice height at the apex (s ’) and the apex debris thickness (h ’). The mean cone slope (
 $\overline{\theta}$) is the ratio of twice the cone height and the cone width.

The range of values, units and description of each parameter/variable used in the model simulations

4.1. Time-dependent behavior
First, we examine cone development through time. These experiments demonstrate the ability of the model to produce dirt cones from debris-filled pits and allow us to examine cone development through time. Each simulation begins with a debris-filled pit with diameter 0.5 m and we examine the cones that develop from pits with three different depths: 0.25, 0.5 and 1.0 m. We track the ice surface elevation (s), debris thickness (h), topographic elevation (z) and mean cone slope to better understand how a debris-filled pit undergoes topographic inversion as it evolves into a dirt cone. For these experiments, all parameter values are held constant to demonstrate the basic model behavior ( $b_0 = 0.04$ m d−1, D = 0.005 m2 d−1,
 $h_\mathrm{c} = 0.08$ m and
 $S_\mathrm{c} = 1.15$). In this and all subsequent experiments, cone height (z ’) refers to the height of the cone apex relative to the bare ice surrounding the base of the cone. Ice height (s ’) refers to the height of the ice surface at the cone apex relative to the bare ice near the base of the cone.
4.2. Debris volume and cone height
In the second set of experiments, we investigate how debris volume influences cone height. We vary both the pit depths and radii. We allow the cones to grow until the debris thickness at the apex  $h' \lt 0.01$ m. All parameter values are held constant (
 $b_0 = 0.04$ m d−1, D = 0.005 m d−1,
 $h_\mathrm{c} = 0.08$ m and
 $S_\mathrm{c} = 1.15$) to focus on the relationship between debris volume and cone height.
4.3. Controls on cone geometry
In the third set of experiments, we investigate how the length scale  $\ell= D/b_0$ and the critical slope
 $S_\mathrm{c}$ influence cone development. We vary
 $\ell$ by varying the diffusion constant (D) and the bare ice melt rate (b 0) across the range of reasonable values (Table 1). Twenty-five simulations, each with a unique value for
 $\ell$, were run for three values of the critical slope
 $S_\mathrm{c} =$ 0.9, 1.15 and 1.4. All simulations begin with a circular, debris-filled pit 0.5 m wide and 0.5 m deep, with
 $h_\mathrm{c} = 0.8$ m. These experiments allow us to derive empirical equations that relate
 $\ell$ to the cone height and mean slope.
These simulations demonstrate that cone geometry is controlled by  $\ell = D/b_0$, not the specific value of D or b 0. To more clearly illustrate this and to show why
 $\ell$ controls cone geometry, we simulate cone development from ‘infinitely’ deep pits of debris. The deep pits eliminate the influence of decreasing debris supply on cone development and render sub-debris melt at the cone apex negligible. The infinite pit experiments begin with debris-filled pits 100 m deep and with 0.5 m diameters. We examined three characteristic lengths in two sets of three simulations. In the first set, we set the melt rate at
 $b_0 = 0.04$ m d−1, calculate diffusion rates to give the characteristic lengths
 $\ell = 0.0025, 0.0125, 0.025$ m and run the simulations for 30 days (equivalent to 1.2 m of bare ice melt at the cone base). In the second set of simulations, we set the melt rate at
 $b_0 = 0.03$ m d−1 and calculate new diffusion rates to again give the characteristic lengths
 $\ell = 0.0025, 0.0125, 0.025$ m. We run these simulations for 40 days to again allow 1.2 m of bare ice melt. In both sets of simulations, a quasi-steady-state cone form emerges. From this, we gain a better understanding of how
 $\ell$ controls cone geometry.
5. Model results
5.1. Time-dependent behavior
Figure 7 shows the development of a dirt cone from a debris-filled pit 0.5 m in diameter and 0.5 m deep after 0, 18 and 36 days. As melt lowered the ice surface surrounding the debris-filled pit, debris diffused away from the pit and onto the surrounding ice, forming the slopes of the emerging cone. The cone grew in width and height until the debris supply at the apex was exhausted (Fig. 7).
An example simulation of cone development from a debris-filled pit 0.5 m wide and 0.5 m deep. The shade of gray corresponds to the debris thickness. Black indicates debris thicker than  $h_\mathrm{c} = 0.08$ m. (a) The simulation begins with a circular pit of debris. (b) After 18 days, a cone has formed with the debris-filled pit at the cone apex. (c) After 36 days, the pit has exhausted its debris supply, inverted, and the cone is covered in a thin layer of debris.

Figure 8a shows cone and ice surface transects for the simulation as shown in Figure 7. The transects illustrate how differential melt and debris diffusion from the pit produced a cone nearly 0.5 m tall and more than 2 m wide. In this experiment, the bottom of the pit inverts (i.e. has a greater elevation than the pit edge) after 27 days of cone development. Figure 8b illustrates the change in debris thickness on the cone slope through time. On the slope outside of the pit, debris thickness decreased down slope in the early stages of cone growth. As debris thickness at the apex continued to decrease, debris thickness at the base of slope eventually becomes greater than at the cone apex. Debris thickness on the cone slopes, outside of the pit, never exceeded ∼0.08 m during this simulation. Figure 8c shows how cone slope changed during development. The cone slope steepened quickly above the pit and became steepest at the edge of the pit. Cone slope then decreased with distance from the edge of pit.
Time slice transects depicting cone development from a debris-filled pit 0.5 m wide and 0.5 m deep (b 0 = 0.04 m d−1, D = 0.009 m d−1,  $h_\mathrm{c}$ = 0.08 m,
 $S_\mathrm{c}$ = 1.15). (a) Time slices of the ice surface elevation (blue) and the debris surface (black) every 12 days. The bare-ice surface surrounding the pit melts more rapidly than the debris-filled pit, causing the cone to emerge. As cone height increases, the debris diffuses down-slope and widens the cone. (b) Time slices of debris thickness at 12 day intervals. Debris is exhumed from the pit and transported down slope as it undergoes topographic inversion. (c) Time slices of the cone slopes at 12 day intervals. The slope magnitude is greatest across the edge of the pit. For (a), (b) and (c), the cone apex is at the 0.0 m position.

Figure 9 illustrates cone development from a 0.5 m diameter pit and three debris depths: 0.25 m (Fig. 9a,d,g), 0.5 m (Fig. 9b,e,h) and 1.0 m (Fig. 9c,f,i). The first row of plots (Fig. 9a,b,c) shows cone height (z ’), ice height (s ’) and debris thickness (h ’) at the apex. Deeper debris-filled pits produced taller dirt cones. Debris thickness at the apex decreased as the cone heights increased until the simulations were stopped when  $h'=0.01$ m. Figure 9d, e and f show the rates of change of ice height, debris thickness and cone height at the apex, relative to the surrounding bare ice. A thin vertical line marks the time of pit inversion. For the 0.25 m deep pit (Fig. 9a,d,g), pit inversion occurred 15 days after the simulation began. For the 0.5 m (Fig. 9b,e,h) and 1.0 m (Fig. 9c,f,i) deep pits, pit inversion occurred after 27 and 48.5 days, respectively.
The initial pit depth controls the melt rate at the cone apexes (Fig. 9d,e,f, solid blue lines). Deeper pits, with correspondingly greater debris depths, resulted in faster cone growth because of the lower melt rate at the cone apex. When debris thickness at the apex  $h' \lt 0.2$ m, the rate of change in ice height decreased rapidly. This debris thickness corresponds to a melt rate between one-half and one-third of the bare ice melt rate. Finally, the cone growth rates approached zero as debris thicknesses at the apex approached zero.
Cone development from three pit geometries. Each column corresponds to a single pit depth. Pit depths increase left to right: 0.25 m, 0.5 m and 1.0 m. The pit radius was 0.25 m. Each column shares the same horizontal axis. Plots (a), (b) and (c) depict the debris thickness at the cone apex (h ’, gray dash-dot line), cone height (z ’, black dashed line) and ice height at the cone apex (s ’, blue line). The left axes are cone/ice height and the right axis is debris depth. Simulations were stopped when the debris depth at the cone apex  $h' \lt 0.01$ m. Plots (d), (e) and (f) show the rate of change in ice height, debris thickness and cone height at the apex as a functions of time. The time when the debris pit inverts is marked with a thin vertical line. Plots (g), (h) and (i) show the mean cone slopes (2× height/width). Cone slope decreased when the debris thickness at the cone apex was less than the debris thickness on the slopes.

The rate of change in debris thinning rate ( $\partial h'/\partial t$) at the cone apex begins at zero and becomes increasingly negative as the cone emerged (Fig. 9d,e,f, dash-dot orange lines). The more negative the debris thinning rate at the apex, the faster debris moves away from the cone apex. After the initial decrease, the pit depth influenced the debris thinning rate as the cones develop. For the shallowest 0.25 m deep pit (Fig. 9d), the debris thinning rate decreased until the pit inverted, then increased slowly and approached zero as the simulation ends. For the 0.5 m (Fig. 9e) and 1.0 m (Fig. 9f) pits, after the initial sharp decrease in the thinning rate, the debris thinning rate at the cone apexes was approximately constant until the pits inverted. After inversion, debris thinning rates increased and approached zero.
The cone growth rate ( $\partial z'/\partial t$) is the sum of the debris thinning rate and the ice growth rate (Fig. 9d,e,f, dashed green lines). For all three pit depths, the cone growth rates were greatest as the cones emerged and sharply decreased during the first few days of development. As with the debris thinning rates, the pit depths influenced cone growth rates. The cone growth rate for the 0.25 m and 0.5 m deep pit (Fig. 9d,e) decreased steadily to zero when the simulation ended. For the 1.0 m deep pit (Fig. 9f), after the initial, sharp decrease in growth rates during cone emergence, growth rates decreased more slowly. Once debris thickness at the apexes decreased below
 $\sim0.2$ m (
 $h' \lt 0.2$ m), the cone growth rates decreased more rapidly and approach zero.
Figure 9g, h and i examine the time evolution of mean cone slopes (2× height/width). Deeper pits produced cones with steeper mean slopes throughout development. For all three simulations, the cone slopes steepened rapidly as the cones emerged. Then, the cone slopes continued to steepen, but more slowly than during the initial period. Cone slopes reached a maximum steepness when the magnitude of the debris thinning rate was greatest. After reaching maximum steepness, cone slopes decreased until the simulations ended.
We also examined the relationships between cone heights (z ’) and total ice melt at the base of the cone ( $\Delta s_0 = b_0 \Delta t$). The cone growth factor (
 $z'/\Delta s_0$) decreased throughout cone development (Fig. 10). The growth factor did not decrease linearly and did not approach a constant value. Pit geometry also influenced the cone growth factor. Deeper pits had larger growth factors than shallow pits for a given amount of ice melt at the base of the cone.
The fraction of cone height to bare ice melt vs bare ice melt for the 0.25, 0.5 and 1.0 m deep pits. The fraction of cone height to bare ice melt was greatest as the cones first emerged, then decreased throughout cone development.

5.2. Debris volume and cone height
These experiments illustrate how debris volume influences cone height. We varied the volumes of the debris filled pits from 0.01 to 2 m3 by varying the radii and depths of the pits. Figure 11 shows that cone heights increased as debris volume increased. Cone height follows a power law scaling relationship with debris volume,  $z' \sim V^{0.5}$. Differing pit dimensions containing the same debris volume produce cones with slight differences in height (Fig. 11). However, pit geometry influenced cone height to a lesser extent than changes in debris volume.
Increasing the debris volume increases the cone height. Cone height and debris volume follow a power law scaling relationship  $z' \sim V^{0.5}$. Point sizes correspond to the pit radii and point colors correspond to the pit depths.

5.3. Controls on cone geometry
Here, we examine the influence of the characteristic length,  $\ell = D/b_0$, on cone geometry. These experiments began with debris-filled pits 0.5 m deep and 0.5 m in diameter. Both D and b 0 were varied to produce a range of values for
 $\ell$. This allowed us to demonstrate that the characteristic length controls cone heights and slopes when pit geometry is held constant
 \begin{gather*}
z' = 10^{-(0.04S_c+0.56)}\ell^{-(0.11S_c + 0.21)}.\\
\overline{\theta} = 10^{-(0.06S_c+0.76)}\ell^{-(0.16S_c+0.25)}.
\end{gather*}
We compared the modeled cone heights and slopes with the values predicted by the empirical scaling relationships (Fig. 12b,d). The mean residual errors of the cone heights is  $\sigma_{z'} = 0.015$ m and the mean residual error of the predicted cone slopes is
 $\sigma_{\theta} = 0.021$ m m−1. The greatest residual errors in the predicted cone heights and slopes occurred with the shortest characteristic lengths. The residual errors are smaller for the middle range of
 $\ell$ values we examined.
Simulated cone height (a) and mean slope (c) as functions of the length scale,  $\ell = D/b_0$ for three critical slope thresholds (
 $S_\mathrm{c}$). All simulations began with a debris-filled pit 0.5 m deep and 0.5 m in diameter. The values for bare ice melt rate and diffusion rate were varied across the range of reasonable values presented in Table 1. Smaller values of
 $\ell$ produced (a) taller and (c) steeper cones for all critical slopes. The simulated cone heights and slopes followed power law functions of
 $\ell$ and
 $S_\mathrm{c}$. (b) The residual errors in predicted cone heights using the power law function shown in (a). (d) The residual errors in predicted cone slopes using the power law function shown in (c). The mean residual errors in cone heights and slopes decreased with increasing
 $S_\mathrm{c}$.

The characteristic length is the ratio  $\ell = D/b_0$. Figure 12a and c show that the value of
 $\ell$ (and to a lesser extent,
 $S_\mathrm{c}$) controls cone geometry, not the individual values of D or b 0. To further illustrate this point and to understand why the characteristic length influences cone geometry, we examined cones that developed from ‘infinite’ pits of debris. All of the simulations began with a 100 m deep pit of radius 0.25 m. In the first set of three simulations, the melt rate was
 $b_0 = 0.04$ m d−1 and the diffusion constants were
 $D = 0.001, 0.005, 0.01$ m2 d−1. We ran these simulations for 30 days, causing 1.2 m of bare ice melt at the base of the cones. For the second set of simulations, the melt rate was
 $b_0 = 0.03$ m d−1 and the diffusion constants were
 $D = 0.00075, 0.00375, 0.0075$ m2 d−1. These simulations were run for 40 days to also produce 1.2 m of bare ice melt at the base of the cones. The combinations of D and b 0 use in these two sets of simulations result in the same three characteristic lengths,
 $\ell = 0.025, 0.125, 0.25$ m, making it possible to explicitly show that
 $\ell$ controls cone geometry. Figures 13 and 14 illustrate the results of these experiments.
For a given value of  $\ell$, the cone heights and widths were identical. Figure 13a shows cross sections of two cones with
 $\ell = 0.025, 0.25$ m after 30 days of growth with
 $b_0 = 0.04$ m d−1 (the cross section for
 $\ell = 0.0125$ m was omitted from this plot for clarity). As expected from previous results, the shorter characteristic length (
 $\ell = 0.025$ m) produced a taller, steeper cone than the longer characteristic length (
 $\ell = 0.25$ m). Figure 13c shows cross sections of two cones with
 $\ell = 0.025, 0.25$ m after 40 days of growth with
 $b_0 = 0.03$ m d−1 (as before, cross section for
 $\ell = 0.0125$ m was omitted from this plot for clarity). For each value of
 $\ell$, the cones produced in these two sets of experiments (Fig. 13a,c) grow to the exact same heights and widths after 1.2 m of bare ice melt occurred.
For a given value of  $\ell$, the cone slopes are also identical. Figure 13b shows the slopes along the transects for each of the three characteristic lengths at
 $b_0 = 0.04$ m d−1. Slopes reached a maximum magnitude at the edge of the pit, then decrease from the edge of the pit toward the base of the cone. Figure 13d shows the slopes along the transects for each of the three characteristic lengths at
 $b_0 = 0.03$ m d−1. The slope transects for these three simulations (Fig. 13d) are identical to the three simulations shown in Figure 13b.
The characteristic length  $\ell = D/b_0$, rather than the specific values of D or b 0, controls cone geometry. All simulations began with the same pit radius (R = 0.25 m). (a) Topographic and ice surface transects for two cones after 30 days of development with
 $b_0 = 0.04$ m d−1 (1.2 m of bare ice melt). (b) Slope transects after 30 days of development for the two cones shown in (a), with an additional slope transect from the simulation with
 $\ell = 0.125$ m. Increasing the length scale decreases cone slopes. (c) Topographic and ice surface transects for two cones after 40 days of development with
 $b_0 = 0.03$ m d−1 (1.2 m of bare ice melt). The characteristic lengths in these simulations are the same as shown in (a), but the diffusion constants (D) and bare ice melt rate (b 0) are different. The cone heights and widths are identical to those shown in (a). (d) Slope transects after 40 days of development for the two cones shown in (c), with an additional slope transect from a simulation with
 $\ell = 0.125$ m. Even though the diffusion constants (D) and bare ice melt rate (b 0) differ from the simulations shown in (b), the characteristic lengths and slopes are identical. In summary, these plots illustrate that the characteristic length controls cone geometry for an equal amount of ice melt at the base.

Finally, we examined how the characteristic length influenced the mean debris flux ( $\overline{Q}$) and the debris thickness (h) on the outer edge of the pit. Figure 14a and c show the infinite pit results for
 $b_0 = 0.04$ m d−1 and Figure 14b and d show the results for
 $b_0 = 0.03$. For a set value of b 0, decreasing
 $\ell$ decreased debris flux over the edge of the pit (Fig. 14a,b). Comparing the results shown in Figure 14a and b shows how the diffusion constant influences debris flux over the edge of the pit. Even though the characteristic lengths used in these two sets experiments are the same, greater diffusion constants results in higher debris flux out of the pit (Fig. 14a,b). Debris thickness on the outer edge of the pit, however, depends only on
 $\ell$. Figure 14c and d show that the debris thickness on the outer edge of the pit is the same for each value of
 $\ell$. Therefore, debris thickness does not depend on the specific value for D or b 0; only the ratio
 $D/b_0$ matters.
6. Discussion
6.1. Time-dependent behavior
The model demonstrated that debris-filled pits in the ice develop into dirt cones similar to those observed on the Kuskulana Glacier. Meter-scale cones can develop in <60 days when subjected to realistic bare ice melt rates, which is well within the duration of a single melt season. Only two conditions are necessary to produce dirt cones: (1) a contrast in melt rates caused by a debris-filled pit and (2) hillslope transport of that debris as relief develops.
Deeper pits produced taller cones with steeper slopes (Fig. 9). As pit depth increased, the contrast in melt rate and the total volume of debris increased. Greater contrasts in melt rates also allowed steeper slopes to develop, and the greater debris volume held within the deeper pits allowed the cones to grow for longer, producing taller cones.
We infer three stages of cone growth based on the results from the time-dependent experiments (Fig. 9): emergence, flux-controlled growth and melt-controlled growth. The characteristics of each stage are described below.
6.1.1. Emergence
The emergence stage of cone growth is characterized by a rapid increase in cone slope, rapidly accelerating rate of debris thinning at the cone apex, and negligible melt at the cone apex during the first few days of development (Fig. 9b). As the cone first emerges, debris within the pit is thick enough to make sub-debris melt negligible ( $h'\gg h_\mathrm{c}$). Initially, the topographic slope at the center of the pit and the transportable debris thickness are zero. Ice melt around the outside of the pit increases the thickness of transportable debris layer and increases the slope between the debris and the bare ice surface. In response, debris flux away from the cone apex rapidly increases. The rate of change in debris thickness at the apex (
 $\partial h'/\partial t$) quickly becomes negative as debris diffuses away from the apex of the emerging cone and onto the ice outside of the pit.
6.1.2. Flux-controlled growth
Debris flux out of the pit depends, in part, on the transportable debris thickness. During flux-controlled growth, the rate at which new debris becomes transportable depends on the contrast in melt rates between the cone apex and the outside edge of the pit. Cone slope and transportable debris thickness increase as the cone peak develops. This allows debris transport to the outside edge of the pit. However, as debris accumulates on the outside edge of the pit, the melt rate on the outer, debris-covered edge slows, which decreases the rate at which new debris becomes transportable. In this way, debris transport over the edge of the pit acts as a negative feedback on the exposure of new transportable debris. This is why the infinite pit simulations with thicker debris at the pit edge actually have lower debris fluxes, despite having a deeper cross-section for transporting debris (Fig. 14).
Mean debris flux ( $\overline{Q}$) and debris thickness (h) on the outer edge of the pit for the six simulations shown in Figure 13. The line colors and line styles match those used for the simulations in Figure 13. The horizontal time axes are normalized by the total simulation time. Plots (a) and (c) correspond to the diffusion constants and bare ice melt rate used in Figure 13b. Plots (b) and (d) correspond to the diffusion constants and bare ice melt rate used in Figure 13d. (a) The mean debris flux across the edge of the pit increases as D increases. (b) Debris flux at the outer edge of the pit is less than in (a) for a given characteristic length because the diffusion constants (D) are smaller than those in (a). (c) Longer characteristic lengths result in thinner debris at the edge of the pit. (d) Debris thicknesses at the outer edge of the pit are identical to those shown in (c), despite these simulations having different values for D and b 0. In summary, varying the diffusion constant and/or the bare ice melt rate will vary debris flux rates. However, debris thickness on the slope is controlled solely by the characteristic length.

The development of the cone slope outside of the pit depends on the contrast in melt rates between the bare ice at the base of the cone and the debris-covered slope outside of the pit. Thicker debris on the slope increases the contrast in melt rates. This increases the slope at the base of the cone and consequently increases debris flux toward the base of the cone. Therefore, if debris thickness increases on the upper slope this increases debris flux toward the base of the slope, while simultaneously having a negative influence on debris supply from the pit. Conversely, if debris thins on the slope, then this reduces flux toward the base and increases flux from the pit.
During flux-controlled growth, the balance between these contrasting influences of slope debris thickness on debris fluxes at the top and bottom of the slope produces a quasi-steady-state configuration (Fig. 15). To explore this concept, we developed a simplified model of the cone slope, where we assume the debris thickness on the slope is constant in space and time (Fig. S1). This steady-state analytical model provides a close approximation to the cone slopes and debris thicknesses produced by the numerical model (Figs S3 and S4). Sediment flux from the top of the cone is a decreasing function of debris thickness (Eqn (S9)), and sediment flux at the cone base is an increasing function of debris thickness (Eqn (S10)). If debris is too thin on the slope, then the flux from the top (Q top) will be greater than the flux leaving the slope at the bottom (Q base). In this case, the debris on the slope will thicken. If the debris on the slope is too thick, then  $Q_{\rm base} \gt Q_{\rm top}$, and the debris will thin. Consequently, the debris on the slope is driven toward a steady-state thickness, h ss, where the flux onto the slope from the top and off of the slope at the bottom are approximately equal. This is reflected by the nearly constant debris flux, thickness and melt rate obtained in the infinite pit simulations after the initial emergence stage (Fig. 14b,c). The slow increase in debris flux and decrease in debris thickness during this period may result from the radial growth of the cone and increasing slope area, an effect that is ignored by our simplified model. Flux-controlled cone growth continues until the sub-debris melt at the cone apex becomes significant, i.e.
 $h'\sim h_c$.
A conceptual model illustrating how debris thickness on the cone slope influences debris flux at the top and base of the cone slope. The cone reaches a quasi-steady-state geometry when debris flux at the top and base of the cone are equal ( $Q_\mathrm{base} = Q_\mathrm{top} = Q_\mathrm{ss}$) and debris thickness on the slope is
 $h_\mathrm{ss}$. The blue arrows and solid line illustrate how debris flux at the base of the cone responds when debris thickness deviates from
 $h_\mathrm{ss}$. The red arrows and dashed line illustrate how debris flux at the top of the cone slope responds when debris thickness deviates from
 $h_\mathrm{ss}$. At the top of the slope, an increase in debris thickness decreases
 $Q_\mathrm{top}$ because it decreases the melt rate at the edge of the pit, which decreases the rate new debris within the pit becomes transportable. Thicker debris at the base of the slope increases
 $Q_\mathrm{base}$ because of the greater contrast in melt rates at the base of the slope and the bare ice. If
 $h \lt h_\mathrm{ss}$: debris flux at the top of the slope is greater than the base of the slope (
 $Q_\mathrm{top} \gt Q_\mathrm{base}$). This increases debris thickness on the slope, which causes
 $Q_\mathrm{top}$ to decrease and
 $Q_\mathrm{base}$ to increase. If
 $h \gt h_\mathrm{ss}$: debris flux at the top of the slope is less than at the base of the slope (
 $Q_\mathrm{top} \lt Q_\mathrm{base}$). This decreases debris thickness on the slope, which causes
 $Q_\mathrm{top}$ to increase and
 $Q_\mathrm{base}$ to decrease. In both cases, the system is driven toward the quasi-steady-state at
 $h_\mathrm{ss}$, as indicated by the arrows.

6.1.3. Melt-controlled growth
Melt-controlled growth commences when debris thickness at the apex is small enough that sub-debris melt at the apex poses a significant limit on the cone growth rate. At the same time, the thinner debris at the apex limits the debris diffusion rate (Eqn (3)). In our model, the increasing melt and decreasing flux at the apex occur simultaneously because we used the same critical debris thickness,  $h_\mathrm{c}$, to scale both the melt rate and the debris diffusion rate. Although this assumption was made to simplify the model, it is likely that the critical debris thicknesses for the decay in the melt rate and debris diffusivity are comparable in magnitude. As debris at the apex continues to thin, the contrast in melt rates decreases,
 $\partial h'/\partial t$ approaches zero, and the cone reaches its maximum height.
6.1.4. Steady-state cones and cone decay
Near the end of our simulations, dirt cones approach a final steady-state form, where debris becomes very thin and melt rates are approximately equal to the bare ice melt everywhere. However, our criteria for stopping the simulations, a debris depth of 0.01 m, is still slightly short of this steady state, since the cones are still slowly growing. For thinner debris, the numerical solution eventually becomes unstable. However, we would not expect this steady state to occur in nature. When the debris supply at the cone apex is exhausted, real dirt cones will decay, because debris thinner than a few centimeters enhances the melt rate relative to bare ice (Östrem, Reference Östrem1959).
6.1.5. Inferring bare ice melt from cone height
It has been suggested that the heights of dirt cones could yield an estimate of bare ice melt during cone growth (Drewry, Reference Drewry1972). However, physical experiments (Drewry, Reference Drewry1972; Hénot and others, Reference Hénot, Langlois, Plihon and Taberlet2023) and a numerical model (Hénot and others, Reference Hénot, Langlois, Plihon and Taberlet2023) produced conflicting results on the possible relationship between cone height and total ice melt at the base. Drewry Reference Drewry(1972) found that cone growth factors ( $z'/b_0\Delta t$) were generally <0.5. From this, Drewry Reference Drewry(1972) concluded that cones never exceed heights greater than half the total melt at the base. In contrast, the numerical and physical experiments by Hénot and others Reference Hénot, Langlois, Plihon and Taberlet(2023) produced cones with growth factors >0.5 and reported no clear relationship between cone height and bare ice melt.
We found that cone growth factors varied in time and were often significantly >0.5, depending on the initial conditions (Fig. 10). Importantly, our experiments showed that it is the ratio of debris diffusivity to the melt rate that controls cone height. We speculate that the conclusion Drewry Reference Drewry(1972) made resulted from their physical experiments only using relatively thin patches of debris. Thus, these cones only underwent ‘melt-controlled’ growth. Based on our model results, we find it unlikely that cone height can be used to accurately approximate the total bare ice melt in the field.
6.2. Debris volume and cone height
Increasing the volume of debris increased the height of the cones (Fig. 11). This qualitatively makes sense because a greater volume of debris can cover a larger cone and can produce a greater contrast in melt rates. Cone height followed a power law scaling relationship with debris volume with exponent 0.5. To better understand this relationship, we examine the geometry of a cone.
We begin with the formula for the volume of a right circular cone:
 \begin{equation}
V = \frac{\pi r^2z}{3}\;,
\end{equation}
where r is the radius of the cone and z is the height of the cone. If we cover the cone with a uniform layer of debris (h), when  $h\ll z$, we can approximate the volume of debris (
 $V_\mathrm{d}$) needed to cover the cone:
 \begin{equation}
V_\mathrm{d} = \frac{\pi(r+h)^2z}{3} - \frac{\pi r^2z}{3}\;.
\end{equation}
The cone slope is  $S = z/r$. By substituting
 $r = z/S$ and approximating for a thin debris layer, where
 $h\ll r$, we get an equation for the debris volume as a function of cone height:
 \begin{equation}
V_\mathrm{d} = \frac{2\pi h}{3S} z^2\;.
\end{equation}
From this, we find the expected scaling relationship between debris volume and cone height for a cone covered with a uniform debris layer:
 \begin{equation}
z \propto V_\mathrm{d}^{1/2}\;.
\end{equation}
Our experiments demonstrate that the maximum dirt cone heights ( $z \propto
V_\mathrm{d}^{0.5}$) follow this expected geometric scaling relationship. Therefore, the initial debris volume needed to create a cone can be inferred by the height of the cone, provided the debris thickness is approximately uniform. For example, dirt cone DC-7 was ∼2.5 m tall, was covered with a debris layer ∼0.1 m thick and had an approximate slope of 0.8 m m−1. Using Eqn (9), we find that ∼1.6 m3 was needed to produce this cone.
6.3. Broader implications
Complex, hummocky topography on debris-covered glaciers increases melt rates by changing surface meltwater drainage patterns and enabling pond formation. While contrasts in debris thickness are essential for relief production via differential melt, the magnitude of relief also depends on the characteristic length  $\ell = D/b_0$. Conceptually, the characteristic length is a measure of competition between differential melt and debris transport on cone development. At distances greater than
 $\ell$ from the debris source, melt becomes more effective at generating relief than diffusion is at smoothing it. Therefore, we might expect debris properties that influence mobility, such as clast size or water saturation, to influence the development hummocky topography. Further exploration will require parameterizing supraglacial debris diffusivity, as well as measuring melt rates and changes in debris thickness over a few years.
Several earlier models examined the influence of supraglacial debris on the topographic evolution of debris-covered glaciers (Anderson, Reference Anderson2000; Anderson and Anderson, Reference Anderson and Anderson2016; Reference Anderson and Anderson2018; Mölg and others, Reference Mölg, Ferguson, Bolch and Vieli2020; Ferguson and Vieli, Reference Ferguson and Vieli2021; Moore, Reference Moore2021). However, these models assumed a relatively smooth ice surface and small gradients in debris thickness. Simulating the development of dirt cones required an approach that accounted for an irregular ice surface with sharp contrasts in debris thickness. We used a sink-filling algorithm to calculate the thickness of ‘transportable’ debris above the edges of debris-filled pits. This approach works irregular ice surfaces, such as debris-filled crevasses and pits. It could be applied at larger scale to model surface debris transport in cases where the ice surface and debris thickness are known.
Although ice cliffs are important drivers of melt and topographic evolution on debris-covered glaciers, the model we implemented cannot simulate ice cliffs. Without a mechanism to remove debris from the base of the cliff, debris accumulates and slopes decrease. Including debris transport in supraglacial streams could make it possible to simulate ice cliffs with this debris flux model. The hyperbolic melt model (Eqn (1)) also influences cliff development because it does not account for the melt-enhancing effect of very thin debris. Thus, thin debris on a steep slope reduces the melt rate compared to bare ice. Additionally, radiation and turbulent heat fluxes not included in our model further increase melt on the cliff face and are essential to existing models of ice cliff development (Han and others, Reference Han, Wang, Wei and Liu2010; Steiner and others, Reference Steiner, Pellicciotti, Buri, Miles, Immerzeel and Reid2015; Buri and others, Reference Buri, Pellicciotti, Steiner, Miles and Immerzeel2016).
Finally, we note that dirt cones bear some resemblance to ice sails, another feature that develops on debris-covered glaciers (Evatt and others, Reference Evatt, Mayer, Mallinson, Abrahams, Heil and Nicholson2017; Fowler and Mayer, Reference Fowler and Mayer2017). Fowler and Mayer Reference Fowler and Mayer(2017) argued that ice sails grow from an instability that results from the positive relationship between debris thickness and melt rate for very small debris thickness. While the model for ice sail development involves unstable positive feedback, the development of dirt cones involves negative feedback that produces a quasi-steady-state form before the debris supply is exhausted.
7. Conclusion
Glacier dirt cones are unique topographic features that develop from differential melt. We constructed a model of cone development from debris-filled pits in the ice surface and compared the results to observations of dirt cones on the Kuskulana Glacier in Alaska. The model demonstrated that dirt cones comparable in height and slope to the cones we observed can develop from debris-filled pits in the ice surface within a few weeks. The characteristic length  $\ell = D/b_0$ derived from the dimensionless model captures the relative influence of melt rate contrasts and debris diffusion on cone development. This characteristic length controls the heights and slopes of the cones for a known debris volume. Short characteristic lengths produce taller, steeper cones because debris diffusion is slow relative to the rate at which differential melt produces relief. Long characteristic lengths produce shorter, less-steep cones because of rapid debris diffusion away from the cone apex as relief develops. Importantly, the characteristic length predicts that increasing melt rates increase relief, hillslope steepness and debris thickness on hillslopes of the hummocky topography on debris-covered glaciers. Thus, changes in the characteristic length via a change in melt rate or debris mobility influence the morphology of hummocky topography. Finally, this model successfully demonstrated a method for handling supraglacial debris diffusion over an irregular ice surface. This approach can serve as a building block for constructing more all-encompassing, process-based topographic evolution models of debris-covered glaciers.
Supplementary material
The supplementary material for this article can be found at https://doi.org/10.1017/jog.2025.32.
Acknowledgements
This work was funded by a 2020 Geological Society of America Graduate Student Research Grant. Work in Wrangell-St. Elias National Park was conducted under the permit WRST-2021-SCI-0017. The authors wish to thank the Scientific Editor, Ian Hewitt, and two anonymous reviewers for thoughtful feedback that improved the content and clarity of this work. Finally, the authors wish to thank the residents of Chitina, AK for helping with transportation and for providing pleasant company at the beginning and end of our expedition.
Data availability statement
The data, model scripts and figure generation code used in our analyses are archived by Zenodo (https://doi.org/10.5281/zenodo.10936344).
Conflict of Interest
The authors declare no competing interests.


 Open access

