


Introduction
Maize (Zea mays L.) which is currently the leading cereal crop in terms of production (FAO, 2019) originated from teosinte approximately 9000 years ago in the Balsas region of southwestern Mexico (Bennetzen et al., Reference Bennetzen, Buckler, Chandler, Doebley, Dorweiler, Gaut, Freeling, Hake, Kellogg, Poethig and Walbot2001; Stitzer and Ross-Ibarra, Reference Stitzer and Ross-Ibarra2018; Bruggeman et al., Reference Bruggeman, Horvath, Fennell, Gonzalez-Hernandez and Clay2020). Following its diversification through combined interventions of man and nature in the Mesoamerican region, maize spread to the other continents chiefly via trade routes. Today abundant genetic diversity exists for maize – the primary reason being its unique reproductive structure which allows extensive outcrossing in natural settings (Hallauer and Carena, Reference Hallauer, Carena and Carena2009). Thus, secondary centres of crop diversity have emerged globally in different agro-climatic zones generating even higher levels of variability especially in the form of maize landraces (Matsuoka et al., Reference Matsuoka, Vigouroux, Goodman, Sanchez, Buckler and Doebley2002; Flint-Garcia, Reference Flint-Garcia2013; Andorf et al., Reference Andorf, Beavis, Hufford, Smith, Suza, Wang, Woodhouse, Yu and Lubberstedt2019).
In India, the North Eastern Hill Region (NEHR) a recognized Asiatic centre of maize diversity (Sharma and Brahmi, Reference Sharma, Brahmi, Frison, López and Esquinas Alcazar2011) is home to various races of maize (Singh, Reference Singh1977), including the distinct primitive popcorn ‘Sikkim Primitive’. Based on morphological, cytogenetic and isozyme comparisons between the Sikkim Primitive and the ancient indigenous maize variety ‘Nal-tel’ of Mexico (Dhawan, Reference Dhawan1964; Singh, Reference Singh1977; Sachan and Sarkar, Reference Sachan and Sarkar1982; Bhat et al., Reference Bhat, Chandel, Shivakumar and Sachan1998), it has been suggested that corn cultivation in the NEHR could have pre-dated the Columbian era. Variants of the Sikkim Primitive having evolved over time due to both natural and human-driven selection are presently distributed across the foothills of North Eastern Himalayan region (Sachan and Sarkar, Reference Sachan and Sarkar1986; Prasanna, Reference Prasanna2012). The hill regions of these foothills dominated by different indigenous tribal population have for generations ensured the conservation of these maize landraces as part of their cultural tradition (Singh et al., Reference Singh, Singh, Dutta, Boopathi, Lungmuana, Saha, Devi and Singh2016).
This extensive collection of diverse maize finds recognition as a valuable source of desirable genes (Sharma et al., Reference Sharma, Prasanna and Ramesh2010; Prasanna, Reference Prasanna2012; Sanjenbam et al., Reference Sanjenbam, Sen, Tyagi and Chand2018; Rathod et al., Reference Rathod, Kumari, Hossain, Chhabra, Roy, Harish, Bhardwaj, Gadag and Misra2019) and the pigmented landraces are particularly important from a nutritional perspective.
Pigmented kernels get their colour from synthesis of secondary metabolites such as anthocyanin and phlobaphene. Kernels with anthocyanin deposition in the pericarp and/or aleurone layers have high antioxidant and antiradical properties and the health benefits include anti-mutagenic, anti-carcinogenic and oestrogenic effects (Adom and Liu, Reference Adom and Liu2002; de Pascual-Teresa and Sanchez-Ballesta, Reference de Pascual-Teresa and Sanchez-Ballesta2008; Zilic et al., Reference Zilic, Serpen, Akillioglu, Gökmen and Vancetovic2012) to name a few. Phlobaphene deposition has also been reported to prevent mycotoxin contamination of maize kernels post kernel development (Pilu et al., Reference Pilu, Cassani, Sirizzotti, Petroni and Tonelli2011). Additionally, since majority of anthocyanin found in maize kernels are acylated, they are more stable as natural food colourants (Chatham et al., Reference Chatham, Paulsmeyer and Juvik2019; Paulsmeyer and Juvik, Reference Paulsmeyer and Juvik2021).
A growing public focus on healthy eating reshaping the purchasing behaviour of the general consumer (Petrescu et al., Reference Petrescu, Vermeir and Petrescu-Mag2020) therefore aligns well with the nutritional potential of pigmented maize cultivars (hereafter also referred to as coloured maize). However, previous studies (Ryu et al., Reference Ryu, Werth, Nelson, Scheerens and Pratt2013; Lago et al., Reference Lago, Landoni, Cassani, Cantaluppi, Doria, Nielsen, Giorgi and Pilu2015; Paauw et al., Reference Paauw, Koes and Quattrocchio2019) have shown that majority of the coloured maize are landraces that have remained underutilized confined to their areas of origin. If we were to exploit this resource and benefit from its diversity, it is essential to have first a preliminary understanding of it. This is because, direct evaluation of maize landraces is a more effective method of incorporating favourable alleles into commercial breeding programmes (Gorjanc et al., Reference Gorjanc, Jenko, Hearne and Hickey2016) and organizing this information along scientific lines leads to better planning and execution (Andorf et al., Reference Andorf, Beavis, Hufford, Smith, Suza, Wang, Woodhouse, Yu and Lubberstedt2019).
When characterizing local germplasm besides phenotyping of visible morphological differences, molecular studies provide insights into the underlying genetic variation and associations of the material under study. With maize, the expectation is that landraces are out-crossers and therefore in Hardy Weinberg equilibrium. However often, deviation from random mating is observed and therefore an understanding of the population dynamics becomes necessary (Lia et al., Reference Lia, Poggio and Confalonieri2009). In plant breeding, because of their codominant behaviour, SSR markers have been commonly used for both model as well as distance-based population structuring studies (Kalia et al., Reference Kalia, Rai, Kalia, Singh and Dhawan2011; Ilyas et al., Reference Ilyas, Park, Jang, Cho, Sa and Lee2023)., The current study was therefore planned to characterize the genetic diversity in a collection of coloured maize landraces adapted to the NEHR at the phenotypic and genotypic level to develop nutritionally rich maize.
Materials and methods
Plant material
The maize landraces used in this study comprised of eighty-three maize accessions of which seventy-three bore pigmented ears while four and six were white and yellow respectively (online Supplementary Fig. S1). Fifty-two of these landraces (online Supplementary Table S1) were collected from different districts of the states of Arunachal Pradesh, Nagaland, Manipur, Mizoram, Mizoram, Tripura, Meghalaya and Sikkim in India during 2019 and 2020 and thirty-one landraces were obtained from ICAR-NBPGR Regional Station, Umiam -793103, Meghalaya (online Supplementary Table S2). The accessions were assigned alphanumerical numbers.
Methodology
Field design and agronomy
The experimental trial was carried out in spring 2021 at the College of Post Graduate Studies in Agricultural Sciences, Umiam located at an elevation of 950 m above mean sea level and at geographical coordinates of 25°34′32″N latitude and 91°52′23″E longitude. The experiment was set in an alpha lattice design over two replications and four blocks. The rows were spaced 0.60 m apart and the spacing between plants within rows was maintained at 0.30 m. Routine inter-culture operations were taken up to ensure a healthy crop stand. An additional trial was done to confirm the observations of the previous year in spring of 2022.
Morphological observations
In all fourteen quantitative, eight colour related and nine qualitative traits were studied. The quantitative traits included days to tasselling (DT, days), days to silking (DS, days), Anthesis Silking Interval (ASI, days), plant height (PH, cm), tassel length (TL, cm), ear height (EH, cm), total number of cobs (TNC, number), ear weight (EW, g), seed index (SI, g), total grain weight (TGW, g), total number of kernels (TNK, number), ear length (EL, cm), ear diameter (ED, cm) and number of grain kernel rows (NGKR, number). From the data of plant and ear height, the EH/PH ratio was worked out for principal component analysis (PCA) analysis. In 2021, observations with respect to presence of pigmentation in leaf sheath, pigmentation in brace root, pigmentation in base of glume of tassel, pigmentation in glume excluding base, pigmentation in anther on the day of emergence, pigmentation in silk on the day of emergence and pigmentation in glume of the cob were also taken. The qualitative traits included observation for angle between leaf and stem, attitude of leaf blade, density of tassel spikelets, angle between main axis of tassel and lateral branches, attitude of lateral branches of tassel, cob shape, kernel row arrangement, kernel shape and type of kernels. The data were recorded on five random plants for each of the two replications using standard descriptors outlined by the Protection of Plant Varieties and Farmers' Rights authority, New Delhi (Anonymous, 2007).
Biochemical studies
Pigment characterization studies included spectrophotometric determination of anthocyanin (Pilu et al., Reference Pilu, Cassani, Sirizzotti, Petroni and Tonelli2011) and phlobaphene (Das et al., Reference Das, Morales and Messing1994; Pilu et al., Reference Pilu, Cassani, Sirizzotti, Petroni and Tonelli2011) content, bleaching test and histological analysis of kernel tissues (Cassani et al., Reference Cassani, Puglisi, Cantaluppi, Landoni, Giupponi, Giorgi and Pilu2017). For variegated maize, the pigmented kernels were used.
For anthocyanin estimation, 1 g of maize flour was added to 25 ml of acidified ethanol (96% ethanol and 1 N HCl 85:15 v/v) and incubated for 30 min at 50°C followed by centrifugation at 12,000 rpm for 15 min at 4°C. Absorbance (A) of the supernatant was measured at 530 nm and the amount of anthocyanin calculated as cyanidin 3-glucoside equivalents (molar extinction coefficient (e) 26,900 lm-1 mol-1, M.W. 484.82). The results were expressed as mg of cyanidin 3-glucoside equivalents (CGE) per g of dry weight. Phlobaphene was extracted from individual seeds using one volume of concentrated hydrochloric acid (HCl) and four volumes of dimethyl sulfoxide (DMSO) added sequentially followed by centrifugation. The clear supernatant obtained was diluted with methanol (20% final concentration) and the concentration of phlobaphene in the sample expressed as absorbance value at λ max (510 nm) per g of dry weight. For both experiments, samples were handled in triplicate. Additionally, for the pholobaphene estimation white kernels devoid of pigmentation were also used as control. The spectrophotometric analysis of anthocyanin and phlobaphene content were also repeated for the top twenty performers in the cropping seasons of 2022 and 2023.
For bleaching studies, a representative sample of seeds from all the accessions were bleached by immersing the seeds in 7% sodium hypochlorite solution for 3 h. The seeds were then thoroughly rinsed with tap water and pericarp tissue discolouration was studied. For the histological studies of kernel tissues, the seeds were soaked in water for 12 h and fixed in freshly prepared 4% paraformaldehyde in phosphate buffer solution (PBS) (130 mM NaCl, 7 mM Na2HPO4, 3 mM NaH2PO4.H2O) at 4°C overnight. They were then rinsed in 0.85% NaCl and transferred to 70% ethanol at 4°C. Thin cross sections made manually were mounted on slides using tert-butyl alcohol to preserve anthocyanin pigment in-situ and photographed using LEICA DM 750 microscope.
Molecular diversity studies
General diversity studies for the eighty-three accessions using thirty-four SSR (Simple Sequence Repeat) markers (Naveenkumar et al., Reference Naveenkumar, Sen, Vashum and Sanjenbam2020) was followed by a more detailed pigment diversity analysis using twenty-one pigmentation specific SSR markers (online Supplementary Table S3) on seventy-one accessions in 2021. Twelve accessions which had recorded more than 15% missing data were omitted from this analysis. Accessions with high percentage of missing data would lead to statistical inaccuracies, generate bias and misinterpretations. The marker details for the genotyping studies were obtained from the maize GDB database (Portwood et al., Reference Portwood, Woodhouse, Cannon, Gardiner, Harper, Schaeffer, Walsh, Sen, Cho, Schott and Braun2018). Leaf samples collected at seedling stage were used for extraction of genomic DNA using the modified CTAB extraction protocol (Doyle and Doyle, Reference Doyle and Doyle1990). The PCR amplification was carried out in 10 μl reaction volume using a programmable thermal cycler. An initial denaturation step at 94°C for 4 min was followed up by 35 cycles of denaturation, annealing and extension at defined temperatures. The final extension was performed at 72°C for 4 min. The amplified PCR products were then resolved in a 2% agarose gel photographed using a gel documentation unit (Alpha Imager Mini) and scored based on size relative to a standard 100 bp ladder (Gene Ruler, Fermentas).
Data analysis
Analysis of variance (ANOVA) and post hoc tests for anthocyanin and phlobaphene content were also worked out using XL-Stat software (Addinsoft, 2022). ANOVA for the adjusted means values of the morphological parameters was calculated using ‘PBIB’ function of ‘agricolae’ package (Felipe, Reference Felipe de Mendiburu2020) in R software (R Core Team, 1993). For the adjusted means, PCA to identify the most discriminatory traits was done in the R software package ggplot2 (Wickham, Reference Wickham2016). Pooled ANOVA of the two cropping seasons was done using ‘gamem’ of metan package (Olivoto and Lúcio, Reference Olivoto and Lúcio2020) in R software (R Core Team, 2020). The pooled data (seasons as random) BLUEs (Best Linear Unbiased Estimate) were generated using the META-R software (Alvarado et al., Reference Alvarado, López, Vargas, Pacheco-Gil, Rodríguez, Burgueño and Crossa2015) of CIMMYT.
The PIC values were calculated as per Nei (Reference Nei1973). STRUCTURE (Version 2.3.4) (Pritchard et al., Reference Pritchard, Stephens and Donnelly2000) was used to evaluate genetic relationship among individuals and the underlying population structure. A total of 20 independent runs were performed for each K, with K values ranging from 2 to 10 and a Markov chain Monte Carlo replication burn length of 10,000–100,000 (Evanno et al., Reference Evanno, Regnaut and Goudet2005). The results obtained were corroborated with the online web-based STRUCTURE HARVESTER program to calculate the optimal K value. Individuals with membership probability below 0.60 were grouped into a single admixture group.
The different parameters of genetic diversity were calculated using GenAlex software version 6.5 (Peakall and Smouse, Reference Peakall and Smouse2012). These included analysis of molecular variance (AMOVA) and Wright's fixation index (F ST) of the sub-groups obtained from population sub structuring studies. Besides, principal coordinate analysis (PCoA), observed vs expected heterozygosity, Fixation index, Shannon's Information Index, F- coefficients and G-statistics of contributing loci were also worked out. The phylogenetic tree for distance based unweighted neighbour-joining clustering method was computed using DARwin 6.0.21.
Results
Morphological and molecular characterization of general diversity studies
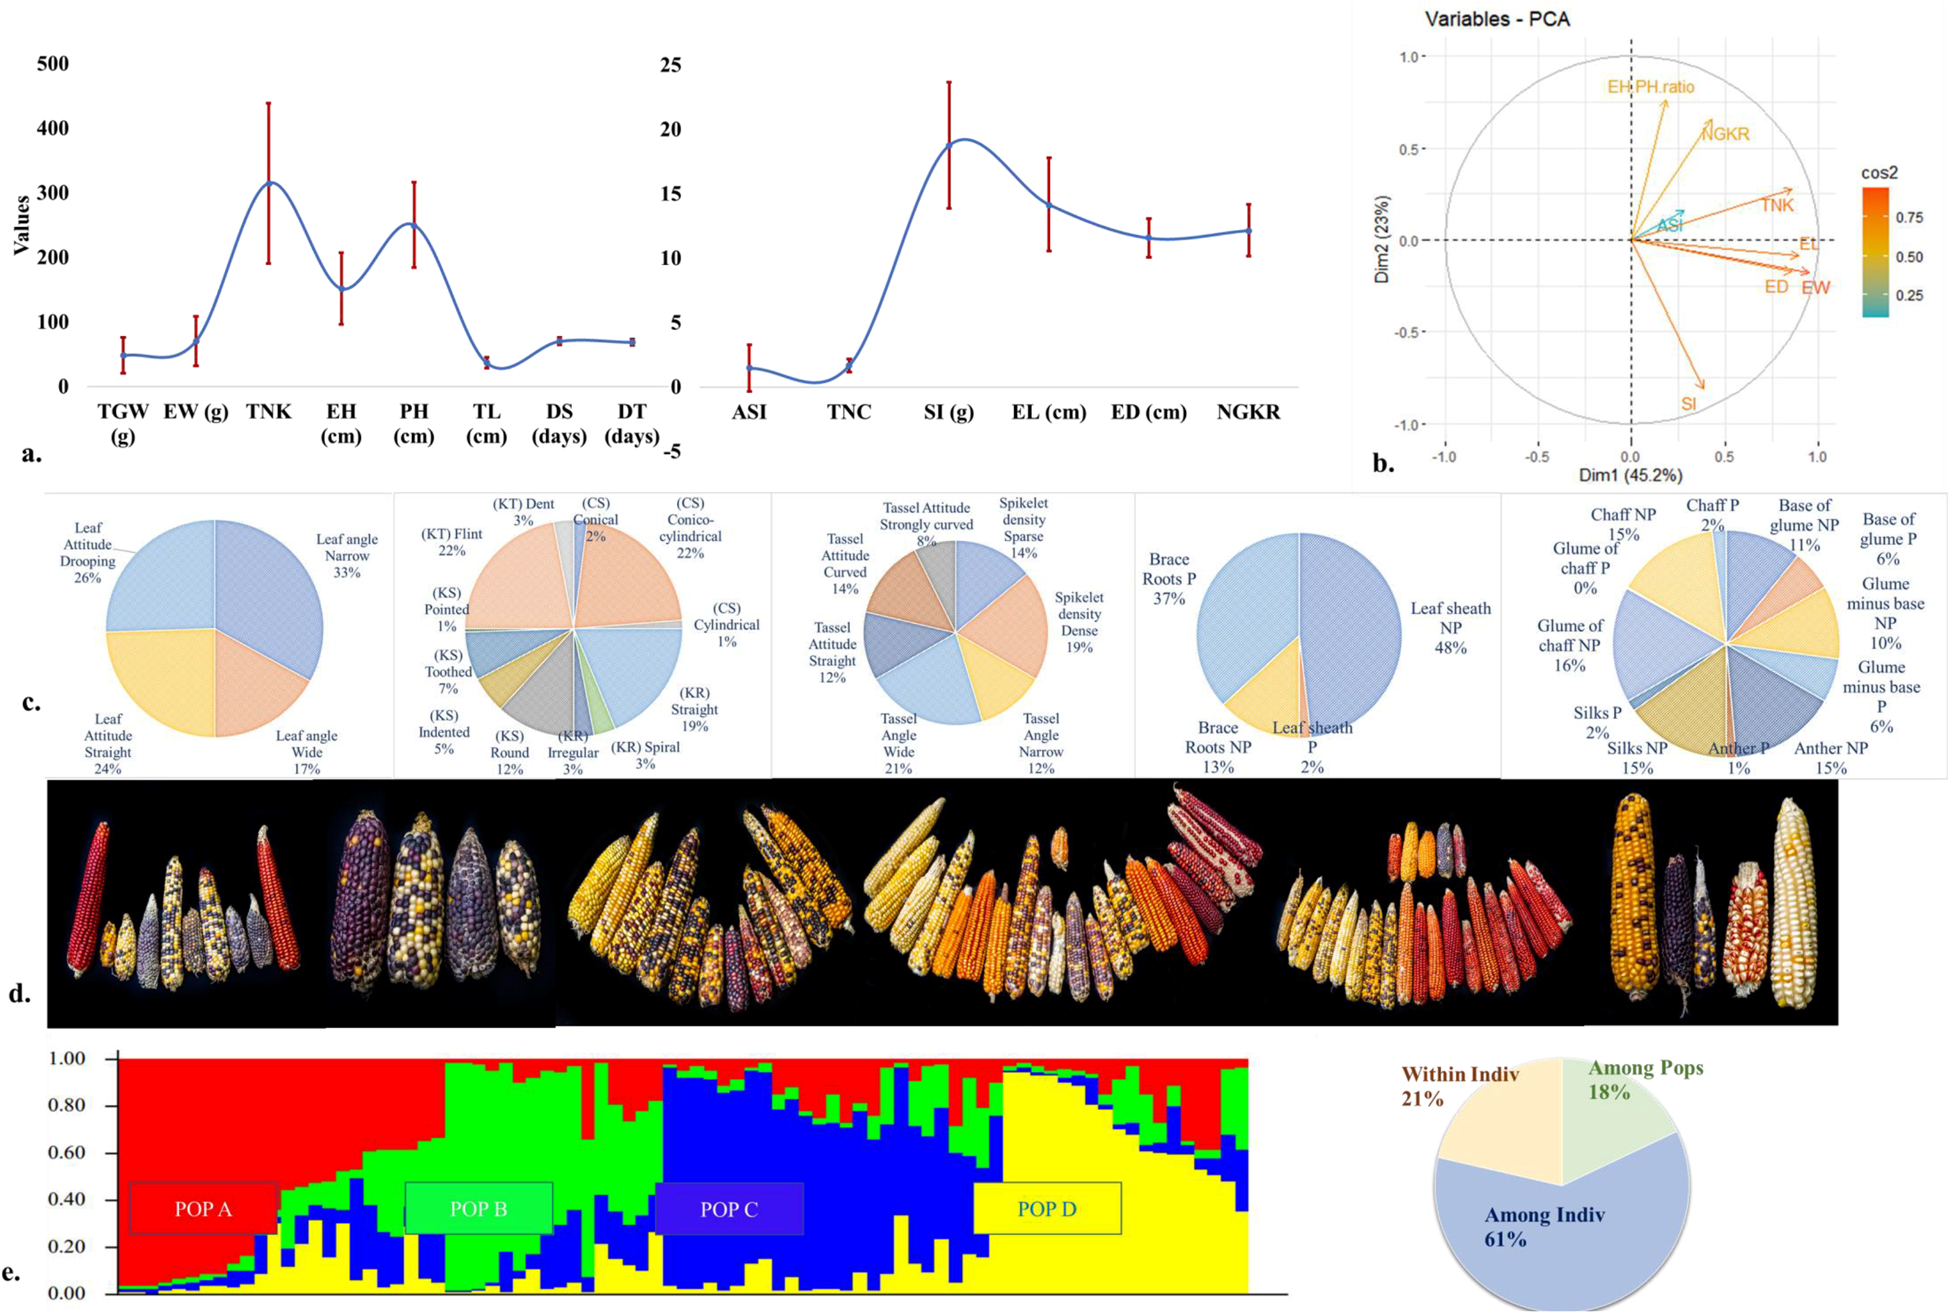
For the morphological studies (Fig. 1a), all the quantitative traits barring number of cobs exhibited high and significant variation (Table 1). A non-significant F value for number of cobs was because most accessions were highly prolific and as a result bore multiple cobs. Several protogynous accessions (P/AP 12, P/AP 14, P/N 3, P/N 4, P/N 6, P/MG 3, P/MG 4, P/MG 6, P/MG 8, P/MG 10, P/MG 11, W/MI 25, P/MA 3 and P/T 1) with negative ASI values were observed as opposed to protandry which is the norm. The PCA biplot (Fig. 1b) for eight highly variable traits indicated that PC1 and PC2 together could explain 68.18% of the total variation. Based on the cosine square results, PC1 had higher loadings of ear/kernel traits (EW, TNK, EL and ED) while PC2 recorded highest contribution from EH/PH ratio, SI and NGKR. Here, SI was found to be negatively correlated with EH/PH ratio and NGKR.
General diversity studies of eighty-three maize accessions studied. (a). Line diagram illustrating mean values and variation for the fourteen yield and yield attributing traits, with error bars indicating ± standard deviation from the mean (b). A biplot generated from principal component analysis for the eight most variable traits. Here, PC1 has a higher loading of ear/kernel traits, explaining 45.2% of the total variation while PC2 with higher loadings for EH/PH ratio, SI, and NGKR explains 23% of the variation observed (c). Pie diagrams representing per cent diversity and distribution of categorical traits related to leaf angle and attitude, tassel density, attitude and angle, kernel [Kernel row (KR), Kernel shape (KS), Kernel type (KT)] and cob [Cob shape (CS)] arrangement, and pigmentation for the studied maize accessions (d). Pictorial representation of the landraces collected from the northeastern states of Nagaland, Tripura, Meghalaya, Arunachal Pradesh, Mizoram, Manipur and Sikkim (left to right) (e). Four subgroups (POP A, POP B, POP C and POP D) obtained from population structuring studies in general diversity studies, along with a pie chart illustrating per cent variation as revealed by AMOVA.
Mean sum of squares based on ANOVA for the yield and pigmentation parameters under study

DT, Days to tasselling (days); DS, Days to silking (days); ASI, Anthesis Silking Interval (days); PH, Plant height (cm); TL, Tassel length (cm); EH, Ear height (cm); TNC, total number of cobs (number); EW, Ear weight (g); SI, Seed index (g); TGW, Total grain weight (g); TNK, Total number of kernels (number); EL, Ear length (cm); ED, Ear diameter (cm); NGKR, Number of grain kernel rows (number).
α ≤ 0.05, * α ≤ 0.01, ** α ≤ 0.001***.
Pooled analysis from two seasons data indicated that mean values observed were similar with respect to the major yield and yield attributing traits studied (online Supplementary Fig. S2). PCA based on adjusted mean values of the pooled data also assigned ear traits as the highest contributor to variation in the data. However, the variation assigned to PC1 and PC2 based on pooled analysis was slightly lower in comparison to that of cropping season 1 taken alone.
The qualitative traits (Fig. 1c) which included studies of leaf traits, pigmentation of floral structures, tassel traits, cob appearance, and kernel types also displayed considerable variation. Most accessions had a narrow leaf angle, and the leaf blade attitude was either straight or drooping. Pigmentation in leaf sheath tissues was limited, but pigmentation of brace roots was more common. Variability was observed in tassel pigmentation while ears of only a few accessions were pigmented. Dense tassels were a common feature, and the angle between the tassel and lateral branches were either straight, curved or strongly curved. The cobs were mostly conico-cylindrical in appearance with a straight kernel row arrangement. Exceptions were the anthocyanin-rich cobs, which were mostly conical with an irregular kernel row arrangement. Most accessions had flint-type kernels.
The STRUCTURE analysis of the eighty-three accessions revealed four subgroups (POP A, POP B, POP C, POP D) and one admixture group (Fig. 1d). AMOVA for the four subgroups indicated that while majority of the variation was present among individuals within a population, a sizeable portion (18%) was because of differences among the populations (Fig. 1e). An overall F ST value of 0.180 indicated presence of high population structuring.
Biochemical, histological and molecular characterization studies of kernel pigmentation
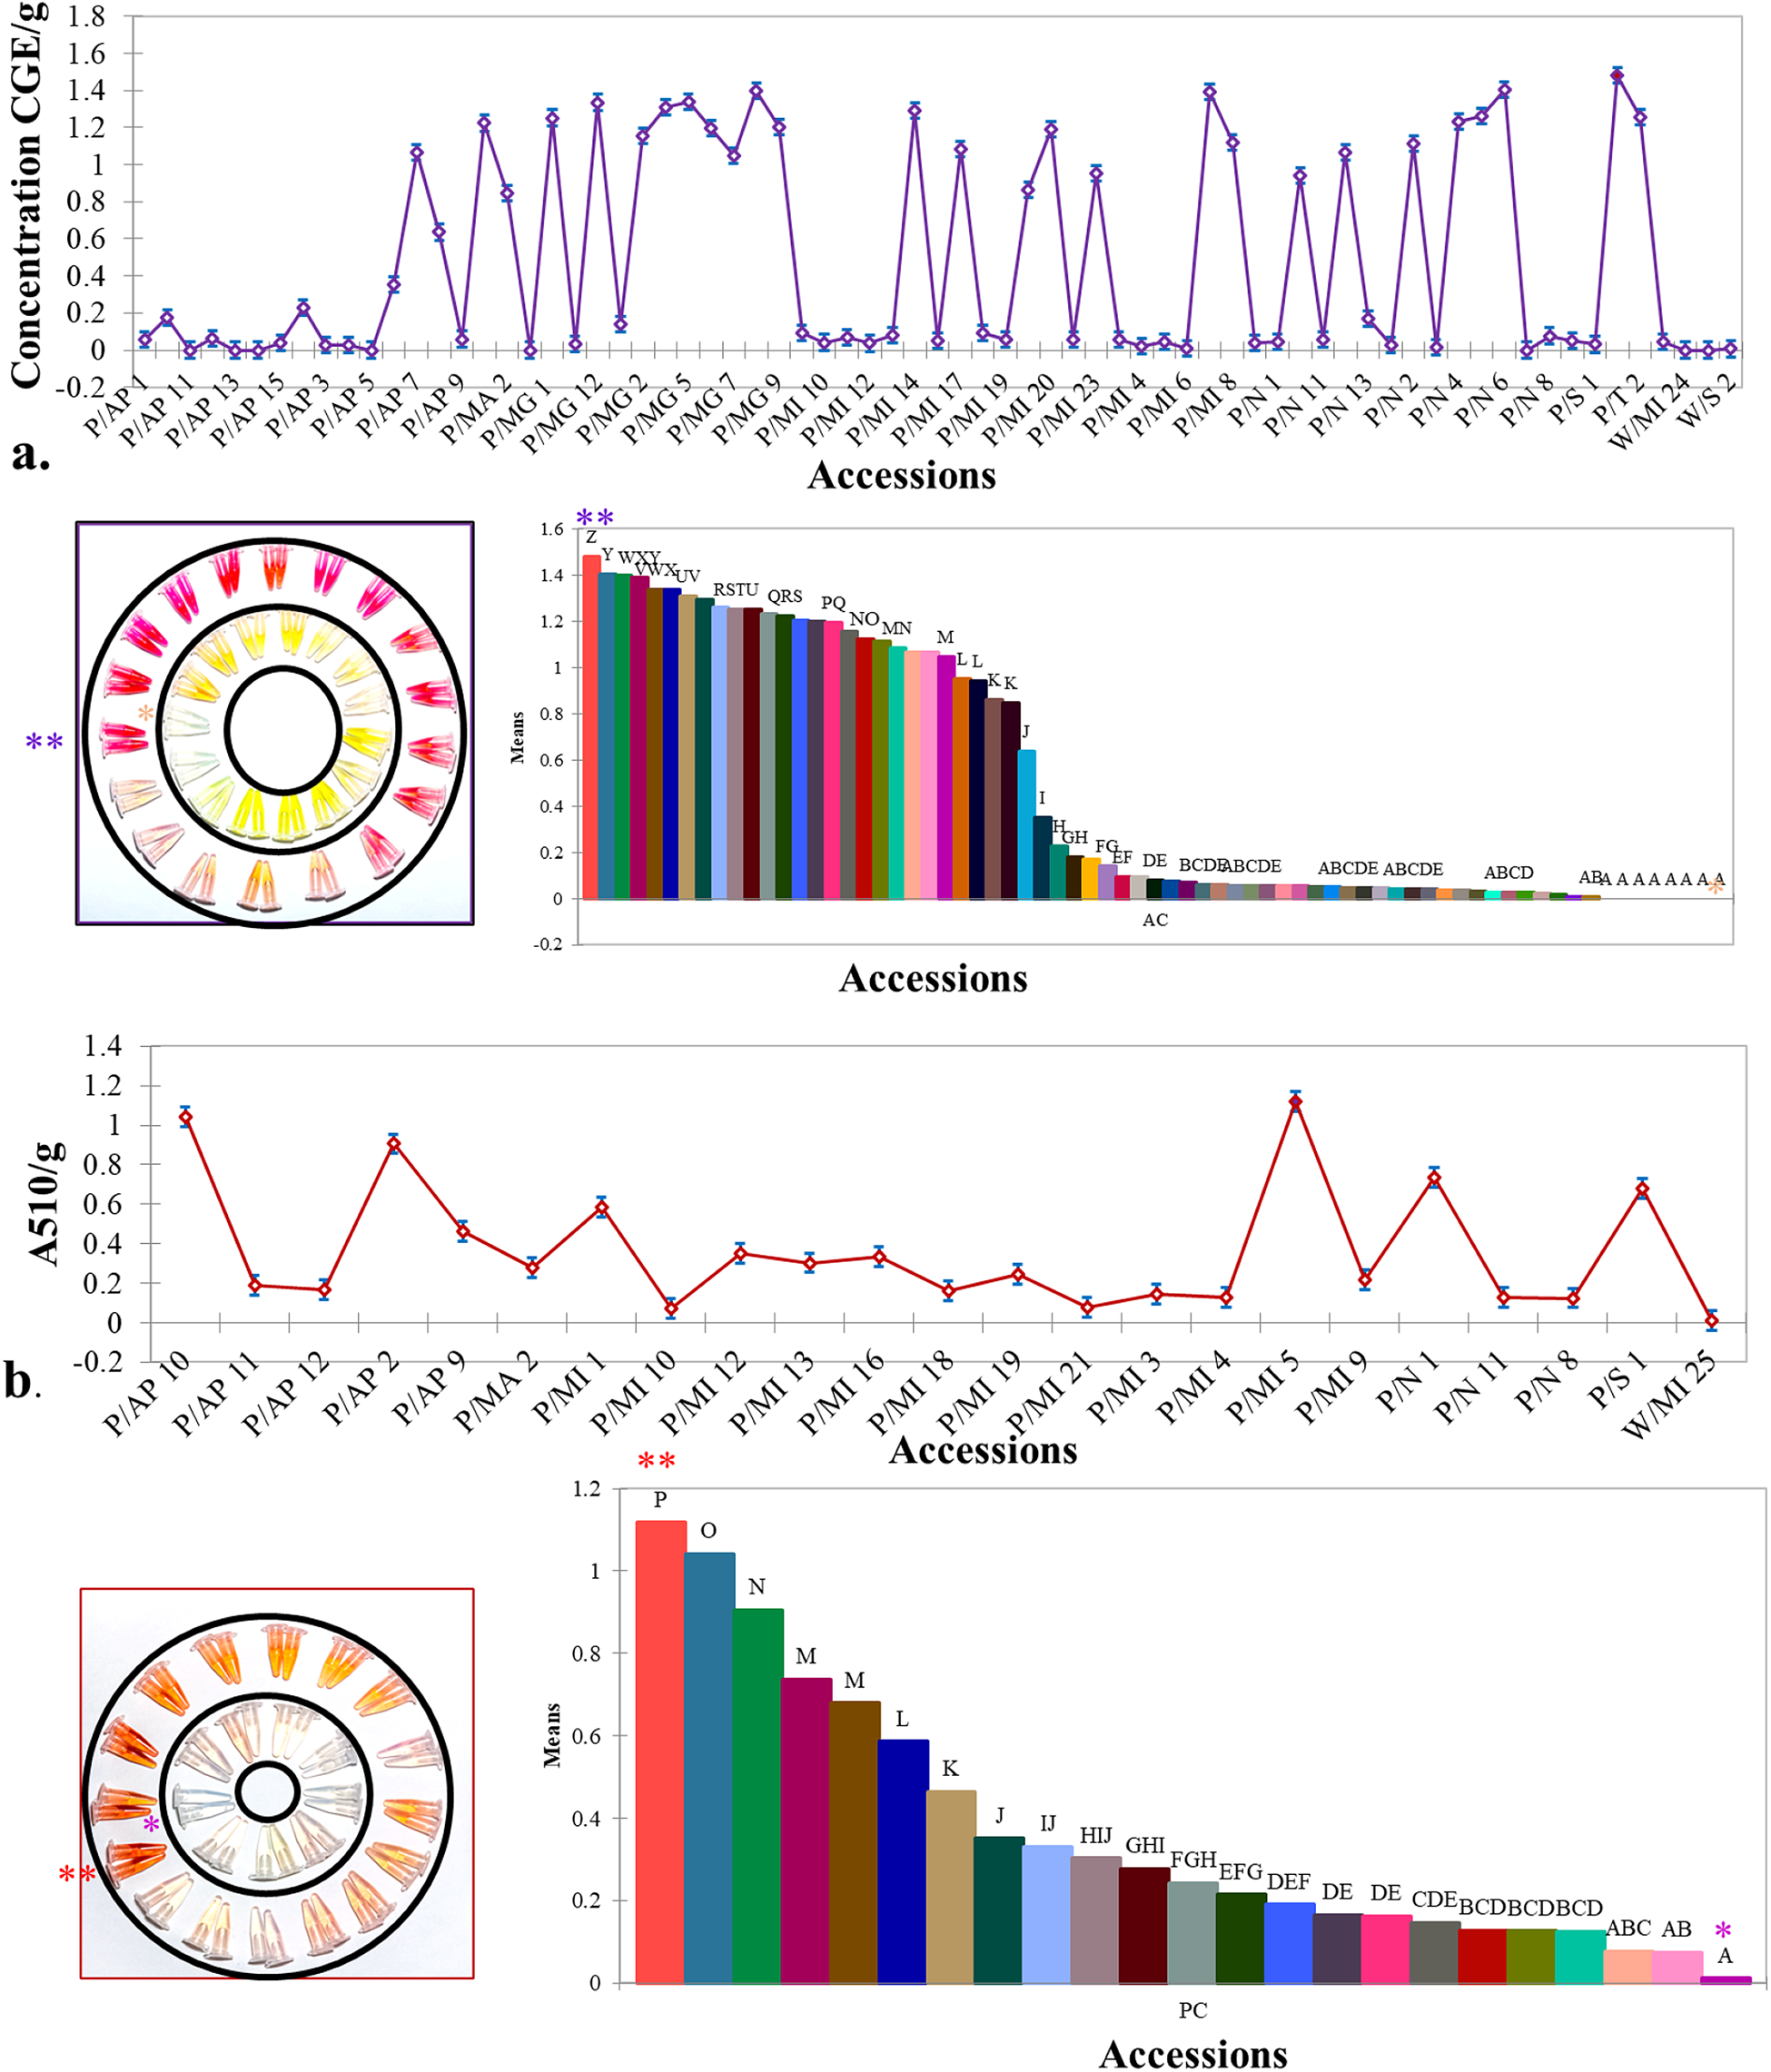
Kernel anthocyanin content ranged between 1.43 CGE mg/g for the coloured cobs to 0 CGE mg/g in the yellow/white cobs used as control. Twenty-eight accessions with a cumulative average of 1.17 CGE mg/g recorded values above the average of 0.49 CGE mg/g. While anthocyanin content was studied for all accessions, phlobaphene studies were limited to a subset of 22 accessions with varying degrees of red. The phlobaphene content was found to range between 1.12 and 0.01 with a mean value of 0.36 A510/g. Except for a single accession (P/MA2) with pigment deposition in both the pericarp and aleurone layers, the anthocyanin content in the remaining 21 accessions was negligible. The highly significant ANOVA implied presence of genetic variability for kernel pigmentation among the accessions. Post hoc pairwise comparisons using Fisher's LSD helped to identify accessions with high values (Fig. 2). A comparison (online Supplementary Fig. S3) of the performance of the kernel anthocyanin and phlobaphene content for the top twenty performers in the first year and pooled analysis of three cropping seasons also gave near consistent results.
Spectrophotometric results based on colorimetric assay for (a). anthocyanin (AC) expressed as CGE/g and (b). phlobaphene (PC) content expressed as A510/g depicting the variation among the different accessions under study. The tubes placed within the circles represent the different shades of the two pigments extracted from kernels of the accesions studied. The bar diagram depicts all pairwise comparisons based on Fisher's LSD Error bars indicate ± standard error.
When maize kernels were treated with 7% sodium hypochlorite, the pigments in the kernel pericarp discolourized because of oxidation, but the aleurone layer remained unaffected. Histological studies of the kernels in the first year further revealed that phlobaphene responsible for red pigmentation and anthocyanin, responsible for purple pigmentation, were restricted to the outer and inner layers of the kernels, respectively. Bleaching and histology studies (Fig. 3a) demonstrated six variations in kernel pigmentation
(1) Colourless Pericarp, Colourless Aleurone
(2) Orange Pericarp, Colourless Aleurone
(3) Colourless Pericarp, Purple Aleurone
(4) Red Pericarp, Colourless Aleurone
(5) Red Pericarp, Purple Aleurone and
(6) Striped Pericarp, Colourless Aleurone.
(a). Bleaching results before (B) and after (A) along with histological sections of the different types of pericarp/aleurone pigmentation seen among all the eighty-three accessions used in the study. Phlobaphene is confined to the pericarp while anthocyanin is limited to the aleurone layer (b). The pie chart depicts the per cent distribution of classes of pigmented kernels where of the eighty-three accessions under study, the highest numbers were of the colourless pericarp + purple aleurone type.
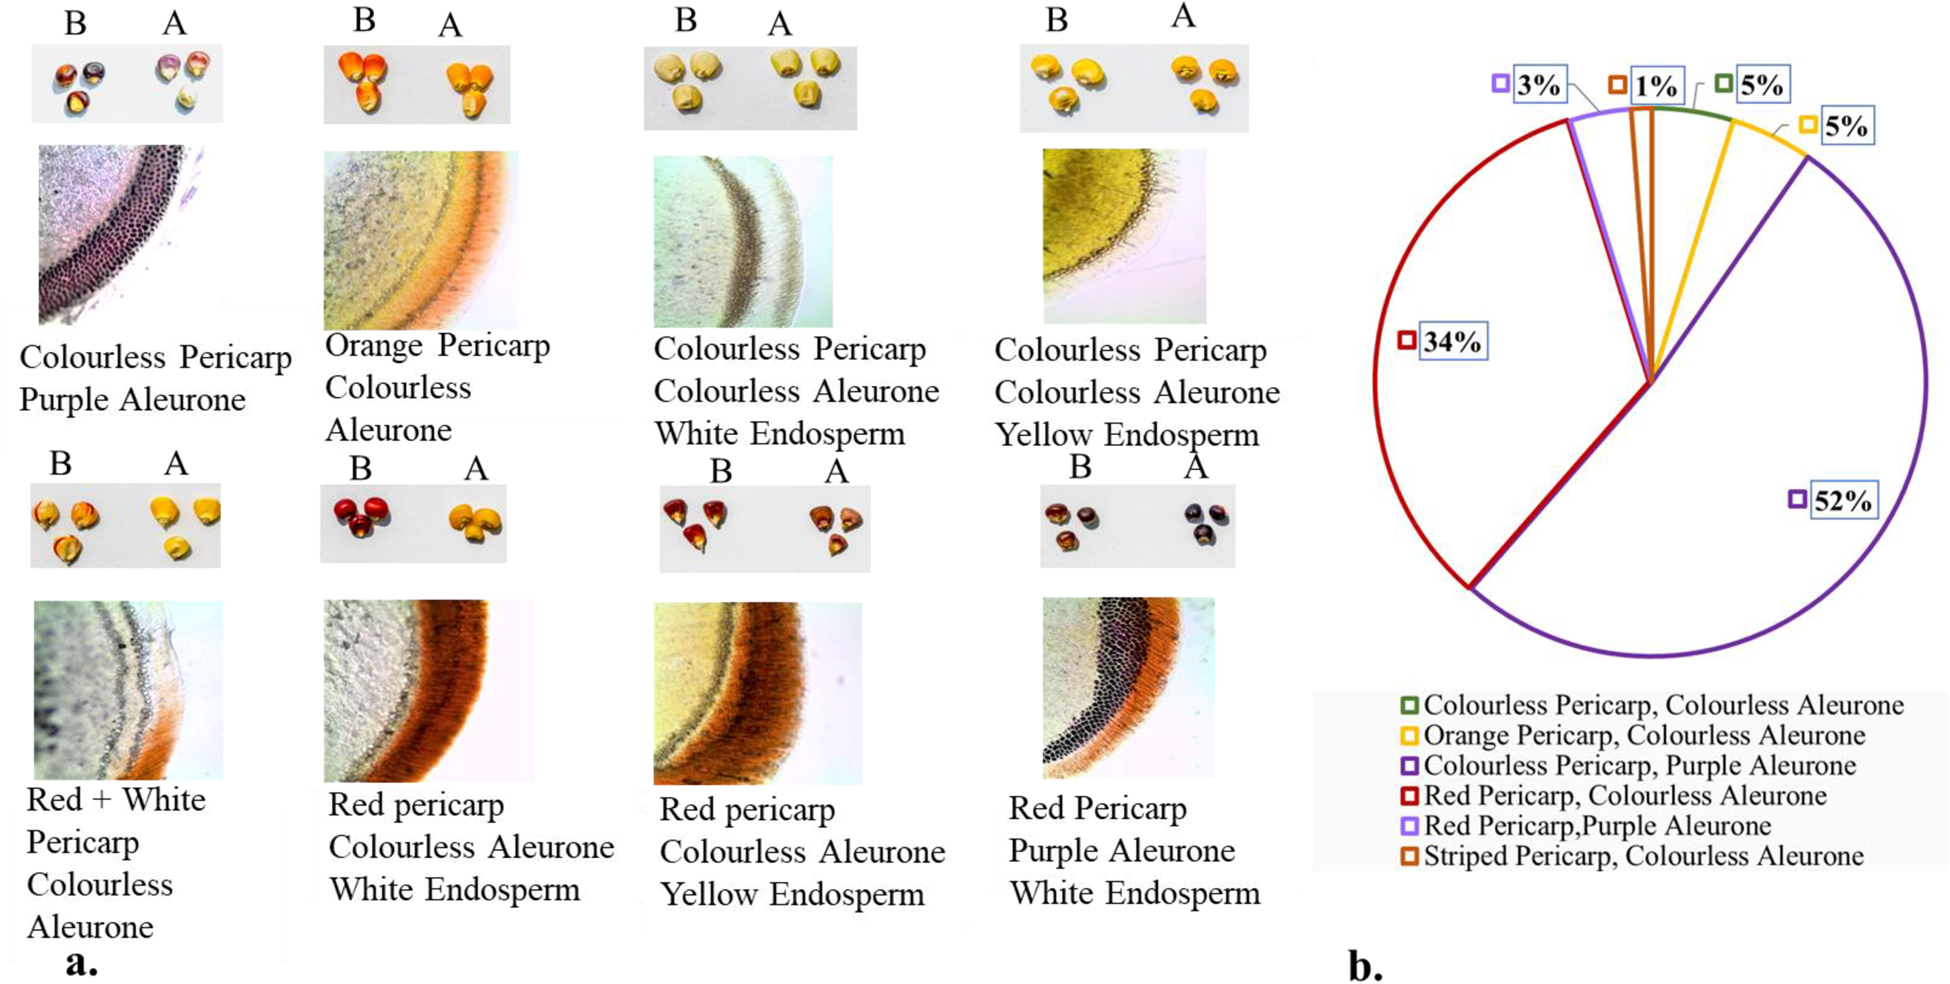
Accessions with purple kernels were more prevalent than those with red (Fig. 3b). The endosperm was either white or yellow.
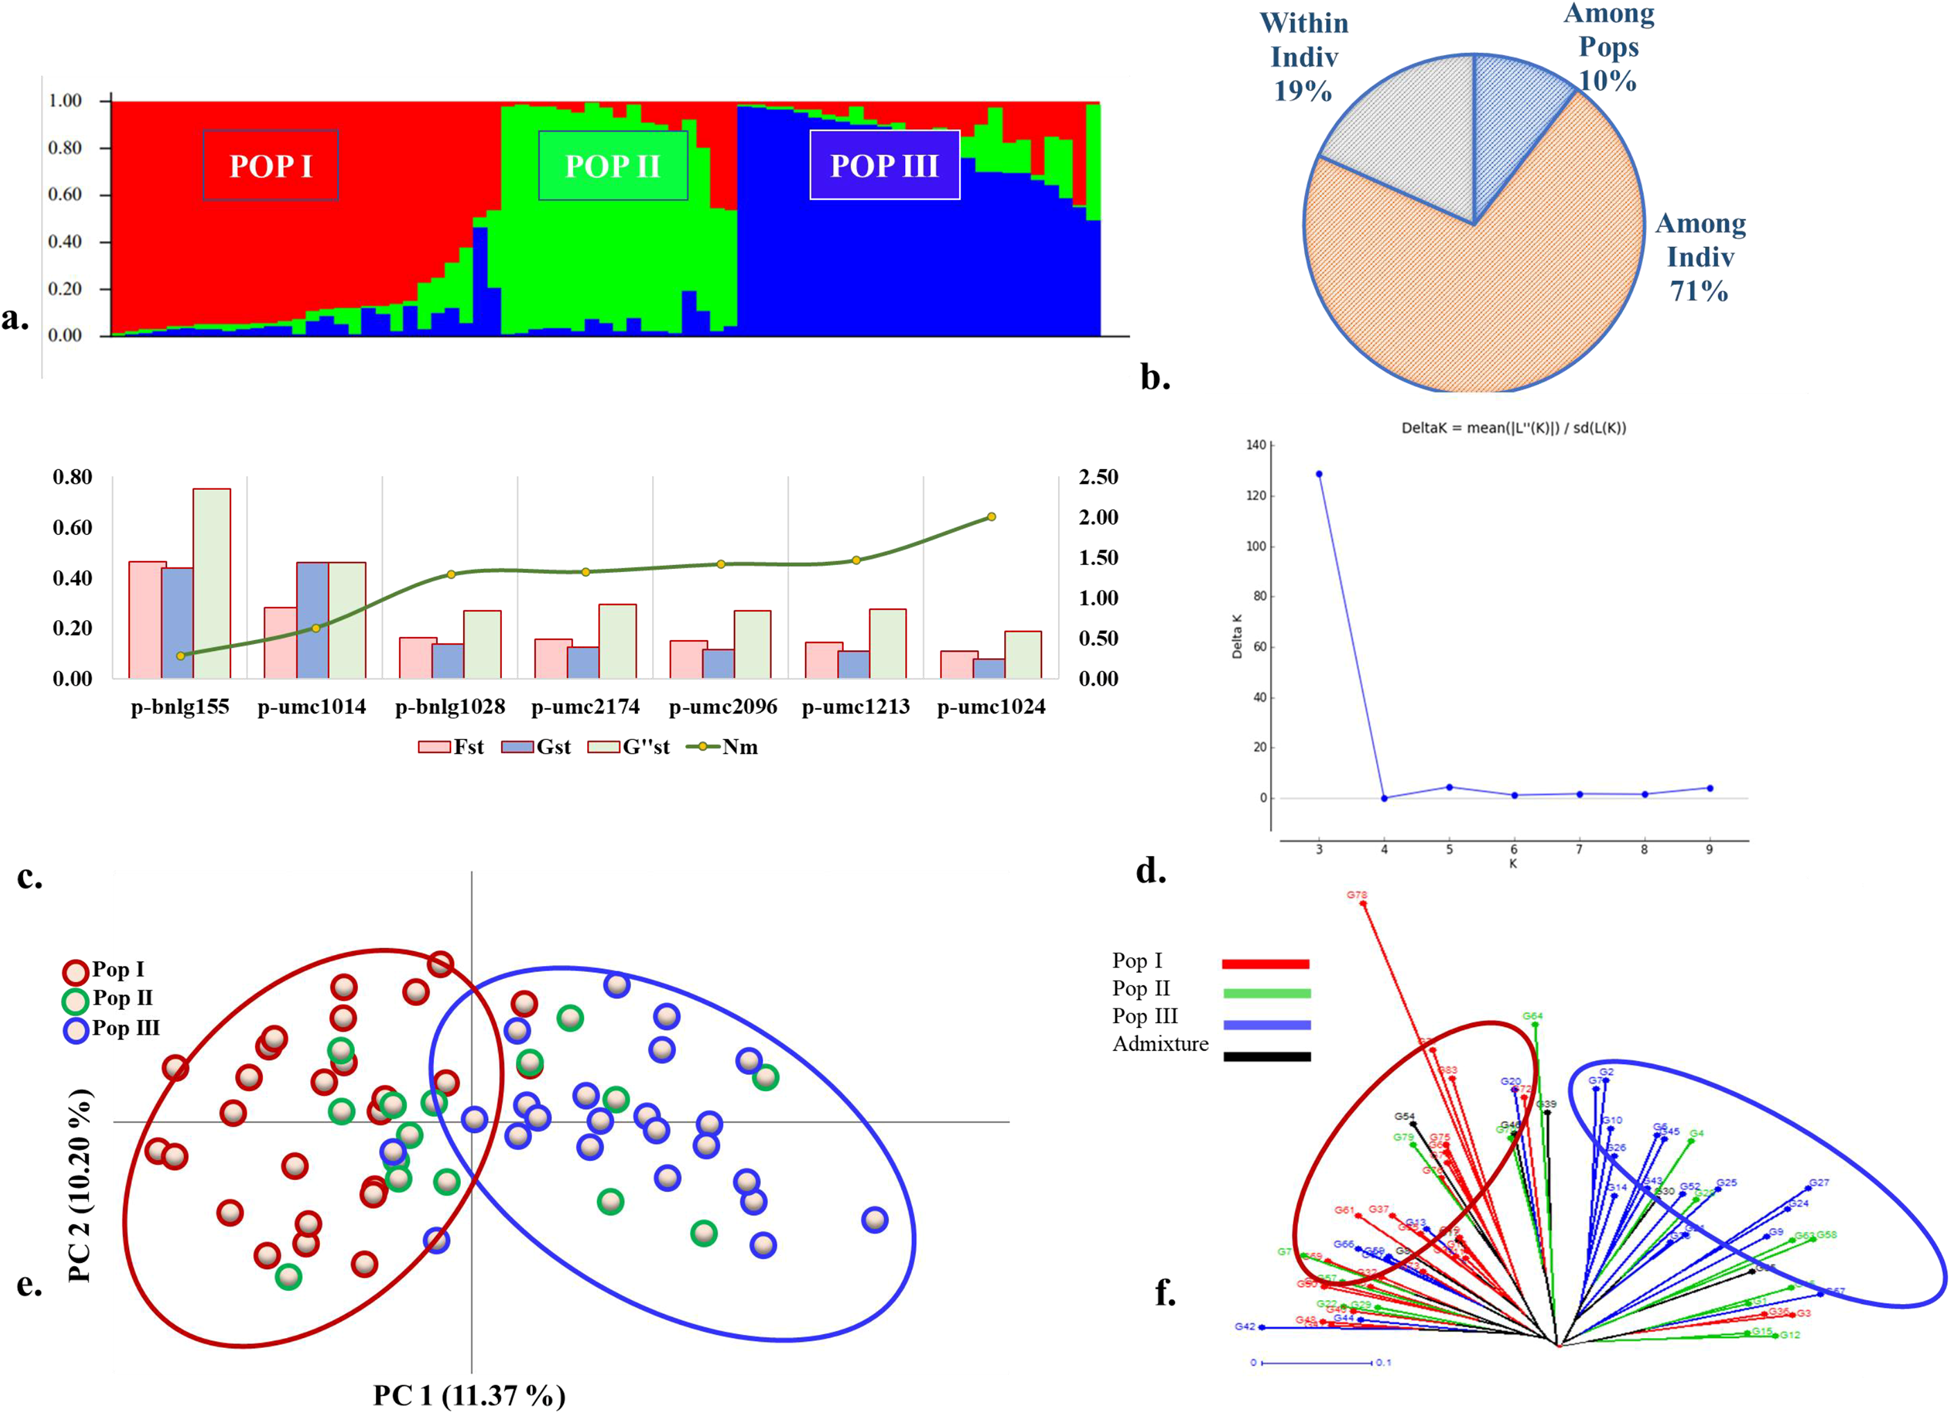
For the twenty-one pigment specific SSR markers used on the seventy-one accessions, marker p-Orp1 was monomorphic while SSR p-phi031 of bin 6.04 was the least informative with a PIC value of 0.11. For the remaining 19 SSRs the PIC content ranged between 0.35 and 0.37. STRUCTURE grouped the accessions (Fig. 4a) into three subgroups – POP I, POP II and POP III and one admixture group. The grouping pattern based on average anthocyanin and phlobaphene content of individuals accessions within the subgroups indicated that POP I had accessions with the highest anthocyanin values. POP II on the other hand had grouped individuals with high phlobaphene content. Analysis of Nei Genetic Distance and Pairwise Population F ST values however indicated that subgroups POP I and POP III were more divergent (Table 2) and that accessions with higher anthocyanin content were confined to subgroup POP I.
(a). Population subgroups POP I, POP II and POP III obtained using twenty-one SSR colour markers on seventy-one of the eighty-three accessions under study where k = 4. (b). Pie chart indicating per cent molecular variation based on AMOVA (c). Loci p-bnlg155, p-bnlg1028, p-umc2174, p-umc2096, p-umc1213 and p-umc1024 with the highest F ST, G ST and comparatively lower Nm values (d). The ‘k’ value, as computed by STRUCTURE HARVESTER, also suggests that the probable count of population subgroups present is three. (e). PCoA graph depicting distribution of the seventy-one accessions characterized for pigmentation (f). A radial phylogenetic tree constructed using distance-based clustering analysis for the same seventy-one accessions. Colours and the legend depict the population groups for the accessions as obtained by STRUCTURE analysis.
Phenotypic characterization based on pigmentation and genetic distance based on Nei's unbiased genetic distance (represented above the diagonal) and pairwise F ST values (represented below the diagonal)

DT, Days to tasselling (days); DS, Days to silking (days); ASI, Anthesis Silking Interval (days); PH, Plant height (cm); TL, Tassel length (cm); EH, Ear height (cm); TNC, total number of cobs (number); EW, Ear weight (g); SI, Seed index (g); TGW, Total grain weight (g); TNK, Total number of kernels (number); EL, Ear length (cm); ED, Ear diameter (cm); NGKR, Number of grain kernel rows (number).
Highest values are presented in bold.
AMOVA indicated significant genetic differences for the subgroups with much of the variance concentrated in the ‘Among Individuals’ component. An ‘Among Population’ molecular variance of 10% which translates to an F ST of 0.103 indicated presence of moderate genetic structuring for pigmentation between the sub groups identified (Fig. 4b). The first two axes of the principal co-ordinate analysis could explain 21.57% of the molecular variation detected with members of the divergent POP III and POP I loading heavily on PC 1 (11.37%) and PC 2 (10.20%) respectively. Individuals of POP II were scattered along either axis (Fig. 4c). The clustering pattern obtained from the distance-based un-weighted neighbour joining method (Fig. 4d) was comparable to the PCoA results obtained from STRUCTURE.
The observed heterozygosity was significantly lower than the expected heterozygosity as reflected by the high levels of fixation index in all the three subgroups. The fixation index was highest for subgroup POP III while comparatively lower values of Shannon's Information Index for POP I indicated that higher amounts of diversity among the members of this subgroup (online Supplementary Fig. S4). In all, twelve of the nineteen loci with very high to moderate F ST values contributed to the genetic differentiation of the three subgroups. Of these, seven SSR markers with F ST values between 0.465 and 0.111 were the highest contributors (Fig. 4e). The high F ST values for these loci were comparable with the estimated G′st and G″st values reaffirming the contribution of these loci in genetic structuring of the accessions under study. The Nm values which represent gene flow were lower for loci with higher F ST values.
Based on un-weighted neighbour joining analysis, the highest genetic distance of 0.93 was detected was between accessions P/MI 23 and P/AP 10. Accession P/MI 23 had recorded above average anthocyanin content (0.96 CGE mg/g) while the anthocyanin content (0.17 CGE mg/g) in P/AP 10 was negligible. The accessions with the highest anthocyanin (P/T 1) and phlobaphene content (P/MI 5) were placed at a genetic distance of 0.045. Accessions P/MI 23 and P/T 1 belong to POP I while P/AP 10 and P/MI 5 belong to POP II.
Discussion
From the current study, a common observation was that cobs with the highest anthocyanin content consistently recorded low ear weight in comparison to the other pigmented accessions. Additionally, anthocyanin content in the kernels was negatively but significantly correlated with seed index and ear length (data not shown). Most of these cobs also showed an irregular kernel row arrangement. These findings may explain why ears with high levels of anthocyanin are considered less productive and did not find preference during the course of domestication (Petroni et al., Reference Petroni, Pilu and Tonelli2014; Lago et al., Reference Lago, Landoni, Cassani, Cantaluppi, Doria, Nielsen, Giorgi and Pilu2015). In what appears to be a trade-off between quality and yield, the challenge will be to develop lines with anthocyanin rich kernels and acceptable ear/kernel traits such as ear length, diameter, and kernel weight since they are critical components influencing grain yield (Fan et al., Reference Fan, Chen, Tan, Xu, Zhang, Luo, Huang and Kang2008). Recurrent selection programmes for population improvement as suggested by Lago et al. (Reference Lago, Cassani, Zanzi, Landoni, Trovato and Pilu2014) and Chatham and Juvik (Reference Chatham and Juvik2021) to simultaneously accumulate desirable alleles for enhancing pigmentation and yield into a common gene pool is one such way forward.
Therefore, although the primary aim of this study was to identify accessions with high anthocyanin/phlobaphene content to initiate a breeding programme focused on nutritional parameters, general diversity studies were also simultaneously undertaken to assess the overall variation present in the studied accessions. The significant variation observed among the accessions for the yield attributing traits suggests that selection has a genetic basis and would be effective. PCA studies specifically indicated that ear weight was the most variable. Previous studies on genetic variability of maize landraces from the NEHR had also reported on the highly significant contribution of cob weight to the overall variation (Sanjenbam et al., Reference Sanjenbam, Sen, Tyagi and Chand2018; Naveenkumar et al., Reference Naveenkumar, Sen, Vashum and Sanjenbam2020).
Since knowledge of interrelationship between grain yield and its associated independent variables improve the efficiency of breeding programmes (Mohammadi and Prasanna, Reference Mohammadi and Prasanna2003), yield association with other traits besides ear weight were also explored. A negative relationship between seed index and the EH/PH ratio observed meant that selection of accessions with a lower EH/PH ratio would lead to higher seed index. Low EH/PH ratio are advantageous since they impart stalk resistance and reduce the risk of lodging (Sandhu and Dhillon, Reference Sandhu and Dhillon2021). Multi-cobbing – an expression of reproductive plasticity in combination with short ASI and protogyny observed for several of the accessions are key components for increasing yield under moisture stress conditions. Together, they are reported to promote synchronous pollination leading to higher kernel set (Uribelarrea et al., Reference Uribelarrea, Cárcova, Otegui and Westgate2002; Ngugi et al., Reference Ngugi, Collins and Muchira2013; Adhikari et al., Reference Adhikari, Joshi, Kumar and Singh2021). Narrow leaf architecture with a straight leaf orientation observed in the germplasm are reported to contribute to increased light absorption and higher dry matter accumulation/unit land area (Stewart et al., Reference Stewart, Costa, Dwyer, Smith, Hamilton and Ma2003; Araus et al., Reference Araus, Slafer and Serret2008; Ku et al., Reference Ku, Zhao, Zhang, Wu, Wang, Wang, Zhang and Chen2010). Accessions with sparse spikelet density allow higher portion of photo assimilate to be allocated for ear development and ensure light interception in high density populations (Gao et al., Reference Gao, Sun, Ren, Liang, Shen, Lin, Zhao, Chen, Wu and Zhou2020; Sandhu and Dhillon, Reference Sandhu and Dhillon2021).
Although significant in both, Wright's F ST and AMOVA was substantially higher for the general diversity studies as compared to pigment diversity studies. This is possibly because general diversity studies involve a wider set of traits and therefore may be subject to higher selection pressures, leading to greater genetic differentiation among the subgroups. In contrast, pigment diversity focuses specifically on genetic variation related to anthocyanin/phlobaphene content among other pigments which are governed by a comparatively smaller number of genes leading to lower population structuring. In either case, a significant F ST and AMOVA implied a deviation from random mating for the accessions under study (Excoffier et al., Reference Excoffier, Smouse and Quattro1992; Goudet, Reference Goudet1995; Meirmans, Reference Meirmans2006; Holsinger and Weir, Reference Holsinger and Weir2009). This is interesting since the accessions had been collected randomly from farmers across NEHR – kernel pigmentation being the only shared attribute.
Significant variation observed for kernel anthocyanin/phlobaphene content in the accessions indicated a genetic basis and meant that variation beyond what has been documented in the present accessions exists for landraces growing in the NEHR. Bleaching and histological examinations had confirmed that when present, anthocyanin was confined to the aleurone layer. Such maize are classified as blue maize (Chatham et al., Reference Chatham, Paulsmeyer and Juvik2019; Chatham and Juvik, Reference Chatham and Juvik2021; Paulsmeyer and Juvik Reference Paulsmeyer and Juvik2021) as opposed to purple maize characterized by anthocyanin deposition in the pericarp of the kernels. However, this is not to say that purple maize is not found in the NEHR. As reported by Chatham and Juvik (Reference Chatham and Juvik2021), purple maize comprises a very small portion of available pigmented germplasm. A moderate population structuring was associated with a significant reduction in observed to expected heterozygosity within the subgroups.
F ST values also assist in identifying areas of the genome that have been targets of selection (Holsinger and Weir, Reference Holsinger and Weir2009). For our studies, significant F ST values were detected for loci bnlg155, umc1014, bnlg1028, umc2174, umc2096, umc1213 and umc1024 associated with genes psy3, pl1, r1, a1, p2, in1 and b1 respectively. While gene psy3 fine tunes carotenoid flux in response to moisture stress in maize roots (Li et al., Reference Li, Vallabhaneni and Wurtzel2008, Reference Li, Tzfadia and Wurtzel2009), pl1 of the R2R3MYB gene family encodes transcription factors (Lago et al., Reference Lago, Cassani, Zanzi, Landoni, Trovato and Pilu2014) that regulate anthocyanin biosynthesis in vegetative tissues including the seed pericarp. The pl1 gene is also implicated in determining the response of the vegetative tissues to light (Piazza et al., Reference Piazza, Procissi, Jenkins and Tonelli2002) and a major QTL associated with root colour in maize has been reported to be located near the pl1 gene on chromosome 6 (Li et al., Reference Li, Fang and Lin2022).
For the r1 and b1 genes associated with loci bnlg1028 and umc1024, both are functionally equivalent having arisen because of duplication of an ancestral gene (Radicella et al., Reference Radicella, Brown, Tolar and Chandler1992). While r1 alleles are part of a complex of several tightly linked genes in chromosomal bin10.06 (Lago et al., Reference Lago, Cassani, Zanzi, Landoni, Trovato and Pilu2014), b1 alleles are encoded by a single gene in bin 2.04. The allelic diversity for the r1/b1 complex varies greatly ranging from vegetative tissue specific anthocyanin production to seed aleurone specific anthocyanin production and penetration (Selinger and Chandler, Reference Selinger and Chandler2001). The intensifier 1 gene (in1) which bears a homology with the r1/b1 multigene family is known to activate the production of anthocyanin pigments in the aleurone layer when in its recessive state (Burr et al., Reference Burr, Burr, Scheffler, Blewitt, Wienand and Matz1996; Selinger and Chandler, Reference Selinger and Chandler1999; Chatham et al., Reference Chatham, Paulsmeyer and Juvik2019). Gene a1 (anthocyaninless1) associated with locus umc2174 regulates changes (absence/reduction) in aleurone pigmentation caused by activation of both autonomous and non-autonomous transposons (Rhoades, Reference Rhoades1938; O'Reilly et al., Reference O'Reilly, Shepherd, Pereira, Schwarz-Sommer, Bertram, Robertson, Peterson and Saedler1985; Brown et al., Reference Brown, Mattes, O'Reilly and Shepherd1989; Peniche-Pavía et al., Reference Peniche-Pavía, Guzmán, Magaña-Cerino, Gurrola-Díaz and Tiessen2022) and possibly accounts for the high number of variegated cobs in the study. The gene p2 (Zhang et al., Reference Zhang, Chopra and Peterson2000; Zhang and Peterson, Reference Zhang and Peterson2005) codes for an MYB-related protein that regulates pigmentation in developing anthers and silks.
All in all, STRUCTURE and neighbour joining analyses produced near similar subgroupings for pigmentation diversity with no obvious geographical bias. Most of the molecular variation was ascribed to the ‘Among Individuals’ component which meant that the accessions within the subgroups were genetically diverse (Reif et al., Reference Reif, Melchinger, Xia, Warburton, Hoisington, Vasal, Srinivasan, Bohn and Frisch2003) creating opportunities for identifying potential parental lines for exploitation of heterosis (Springer and Stupar, Reference Springer and Stupar2007). Additionally, the prevalence of traits such as multi-cobbing, short ASI, and protogyny, along with the highly fixed psy3 gene, indicated that the accessions have adaptive advantages to deal with moisture stress. A possible explanation for this adaptation would be that maize landraces in the NEHR complete a good part of their life cycle under rainfed situations before the onset of monsoon. Taking all the findings together it appears that the maize landraces growing in the NEHR are diverse, come with adaptive advantages and amenable to genetic manipulation for developing high yielding coloured maize.
Conclusion
To the best of our knowledge, this is the first in-depth study of coloured maize landraces from the NEHR of India and is a starting point for crop improvement aimed at enhancing anthocyanin/phlobaphene content in maize. We also understand that the genetic variation observed among the studied accessions at the morphological, biochemical, and molecular levels can be extended to the larger population of coloured maize landraces of the NEHR. Since the genetic variability found is significant it will increase the chances of combining desirable traits for pigmentation and yield into a common gene pool. For our subset we could group the accessions based on model and distance-based clustering studies into distinct groups. These can subsequently be developed as heterotic groups. The initial step of assembling and identifying genetically diverse individuals has been completed in the present study. The accessions studied come with certain advantageous yield attributing traits such as adaptiveness to moisture stress, improved stalk strength to counter lodging especially in high density planting scenarios and leaf architecture which optimize photosynthesis and can be successfully harnessed. Promising lines can next be inbred and based on their performance with divergent testers can be classified into opposite heterotic pools for exploiting heterosis. Additionally, while our primary focus was on identifying promising accessions for anthocyanin/phlobaphene, other pigment variations such as accession with orange pericarp can also be explored.
Supplementary material
The supplementary material for this article can be found at https://doi.org/10.1017/S1479262124000182.
Acknowledgements
The authors are grateful to the farmers of the different districts of NEHR and to the ICAR-NBPGR Regional Station, Umiam for their willingness to provide the seed material used in the present study. We are also thankful to all those individuals who facilitated the germplasm collection by serving as contact points. Thanks, are also due to Dr Mayank Rai and Dr Wricha Tyagi for their valuable suggestions from time to time. The authors are also grateful to the Central Agricultural University (Imphal) for providing all necessary infrastructure for carrying out this research work.
Authors’ contributions
Dr Devyani Sen and Ms Sristishila Baruah contributed to the study conception, design, experimentation, data analysis and draft preparation. Ms Thounaojam Bharti phenotyped the second and third season crop data as part of her M.Sc. thesis work. Dr Duddukur Rajasekhar and Mr Harshavardhan Reddy supported the study with material preparation, field data collection and morphological data analysis. Ms Ernieca Lyngdoh Nongbri assisted with the molecular work.
Competing interests
None.



