When researchers refer to Early Intervention (EI), they are referring to a set of treatments suited to children 0 to 6 years of age, their family, and their environment whose objective is to respond as quickly as possible to the transitory or permanent needs of children suffering from some developmental disorder, or who are at-risk for developing one. Such interventions ought to address the whole child and be planned by an interdisciplinary team of professionals (Grupo de Atención Temprana, 2000). In an EI program, assessment objectives should focus on: (a) developing individual objectives to guide programming; (b) providing parents and professionals with information about the child’s progress; and (c) providing information that allows people to judge the intervention system’s value (Candel, Reference Candel2005).
Evaluation during early childhood poses numerous challenges, especially for smaller children, and particularly those with some type of impairment or alteration (Del Barrio, Reference Del Barrio2009). By the same token, more traditional assessment approaches have been criticized, among other reasons, because the testing situation is very artificial and therefore cannot capture the child’s true potential at any given moment.
Along those lines, various authors have highlighted the need to seek out assessment alternatives to traditional intelligence tests in order to capture the peculiarities of different impaired group and help plan useful interventions for them.
One such assessment covers specific curricular goals that encourage a better, closer relationship between assessment and education. It is especially pertinent to children in EI (Candel, Reference Candel2005; Lidz & Jepsen, Reference Lidz and Jepsen2000).
With that in mind, several authors have proposed Learning Potential Assessment as an alternative approach to either substitute for, or complement, traditional intelligence testing. We must emphasize that many authors see it as an important psychopedagogical tool and an opportunity to improve teaching-learning processes, yet even though it first appeared in the ’70s, it is still not being implemented in most educational contexts (Haywood & Lidz, Reference Haywood and Lidz2007; Lidz Reference Lidz2004; Lidz & Jepsen Reference Lidz and Jepsen2000). What is more, it remains virtually unknown to many psychologists and psychopedagogy authors, which has kept it from spreading into world-wide use (Elliott, Reference Elliott2003; Haywood & Tzuriel, Reference Haywood and Tzuriel2002).
Some authors believe psychologists have been slow to adopt it because of how long it takes to administer, how knowledgeable the evaluators need to be, and the fact that this area is somewhat unfamiliar to practicing psychologists (Resing, Reference Resing2001).
This approach conceptualizes Intelligence as largely centered on modifiability, which is understood as an individual’s ability to take advantage of learning experiences directly related to the task (Calero, Reference Calero2004; Haywood & Lidz, Reference Haywood and Lidz2007).
According to Haywood and Tzuriel (Reference Haywood and Tzuriel2002), this type of assessment consists of “deliberate and planned mediational teaching, and the assessment of the effects of that teaching on subsequent performance.” Those authors argue that this methodology is inherently optimistic, that estimating learning potential and making predictions from those estimates is of no use if children do not also learn to externalize their potential.
The central theoretical basis for this type of assessment comes from Feuerstein (Feuerstein, Rand, & Hoffman, Reference Feuerstein, Rand and Hoffman1979) and Vygotsky (Reference Vygotsky1978). The latter proposed the notion of the “zone of proximal development” and argued that social context is crucial to learning. Feuerstein et al. (1979), meanwhile, posited that cognitive abilities could be improved through “mediated learning experience.” Based on that idea, Haywood and Tzuriel (Reference Haywood and Tzuriel2002) described specific types of interaction that help children develop higher mental functioning and encourage learning to progress (Haywood & Lidz, Reference Haywood and Lidz2007). In addition, many authors see this kind of evaluation as a valuable tool to support psychopedagogy, and as an opportunity to improve teaching-learning processes, because the mediation phase promotes skills such as self-regulated learning and metacognitive strategy acquisition (Haywood & Lidz, Reference Haywood and Lidz2007; Shamir & Lazerovitz, Reference Shamir and Lazerowitz2007).
Language, and above all language development problems, is another subject of interest to learning potential research. Due to the multidimensional nature of language, the term Developmental Disorder of Speech and Language applies to a tremendously varied set of children (Hasson & Joffe, Reference Hasson and Joffe2007). In fact, this group may include children with linguistic or cultural differences, who belong to socially marginalized groups, or who find difficulty in distinct aspects of learning or reading. Psychologically assessing children has certain, inherent issues, but bear in mind that IQ is irrelevant to diagnosing and predicting language development, because language problems do not usually correlate with IQ (Swanson & Howard, Reference Swanson and Howard2005). Also note that the linguistic screening measures currently used to identify problems and recommend suitable treatment are not very reliable (Hasson & Joffe, Reference Hasson and Joffe2007).
Considering how important it is to establish differential diagnoses for the various groups of children that fall into this category, and researchers’ interest in whether language problems are based on stable processing impairment, or if there is potential for improvement (Swanson & Howard, Reference Swanson and Howard2005), since the late ’90s, a group of authors led by Peña (Reference Peña2001) has begun to use a pretest-training-posttest approach to assessing language impairment. One result is that since 2005, the ASHA (American Speech-Language Hearing Association) has supported and furthered the use of learning potential assessment in research in this field (Larsen & Nippold, Reference Larsen and Nippold2007).
This research design has been applied to several tasks often included on traditional language impairment batteries, for example: vocabulary (Restrepo et al., Reference Restrepo, Schwanenflugel, Blake, Neuharth-Pritchett, Craner and Ruston2006), expressive language, word learning, explanatory discussion of concepts and sentences (Hasson & Botting, Reference Hasson and Botting2010), morphological analysis (Larsen & Nippold, Reference Larsen and Nippold2007), narrative language (Peña et al., 2006), reading skills (Swanson & Howard, Reference Swanson and Howard2005), etc.
Research has explored what kinds of mediation are most effective and has analyzed the most useful results (Hasson & Botting, Reference Hasson and Botting2010), finding learning potential assessment techniques to be useful in differential diagnosis, that is, in distinguishing between children with linguistic difficulties vs. language problems (Gutierrez-Clellen & Peña, Reference Gutiérrez-Clellen and Peña2001; Jacobs, Reference Jacobs2001; Peña, Reference Peña2001; Peña & Quinn, Reference Peña and Quinn2003; Peña, Bedore, & Rappazzo, Reference Peña, Bedore and Rappazzo2003; Peña, Iglesias, & Lidz, Reference Peña, Iglesias and Lidz2001; Peña et al., 2006; Restrepo et al., 2006), and between children with reading problems vs. other learning difficulties (Swanson & Howard, Reference Swanson and Howard2005). On another note, modifiability in processing and the skills required by different linguistic tasks have been well-established (Hasson & Botting, Reference Hasson and Botting2010). More recently, Hasson, Dodd, and Botting (Reference Hasson, Dodd and Botting2012) designed an assessment protocol based on sentence structure learning potential called DASS (Dynamic Assessment of Sentence Structure) for children 8-10 years-old. It strives to offer a reliable, valid test that provides useful information about potential in children with language disorders, the goal being to benefit learning.
With that in mind, we aimed to demonstrate the cognitive modifiability of preschool-aged children with Developmental Disorders of Speech and Language using a learning potential instrument; this was the first time it was used in this type of population. The Escala de Habilidades y Potencial de Aprendizaje en Preescolares [Application of Cognitive Functions Scale] by Calero, Robles-Bello, Márquez and de la Osa (Reference Calero, Robles-Bello, Márquez and de la Osa2009) was used to determine how children apply basic cognitive and metacognitive functions during learning activities that are typical of early childhood and tied to the demands of standard educational curriculum for children approximately 3 to 6 years-old.
Thus, this study was conducted for two reasons: first, to examine the differences between two groups of kids upon initial assessment, one with typical development and one with developmental disorders of speech and language (from an Early Child Development Center) and gauge how important it is to differentially diagnose such children who may need EI; and second, to demonstrate the effectiveness of the mediation phase, which is when the intervention and subsequent assessment took place. This was all done with the following idea in mind: better understanding samples of children with developmental disorders of speech and language, including their responses to this learning potential evaluation, would enable us to define and prioritize treatment objectives according to the specific population at hand.
These objectives were operationalized as follows. First, we measured baseline performance in both groups of children by collecting pretest EHPAP scores. We predicted significant differences between groups in pretest scores on all sub-scales of the EHPAP. Second, we aimed to determine how effective the mediation phase of treatment was in the different groups, expecting significant improvement (difference between pretest and posttest scores, or score increase).
Method
Participants
The sample included 64 children 4 to 6 years-old; they were divided into two groups. The first consisted of 32 kids with a Developmental Disorder of Speech and Language (LD from here on) (M = 4.2; SD = .9). Of the 32, there were 18 girls and 14 boys. The second group was comprised of 32 children with typical development (TD from here on) from 4 to 6 years-old (M = 4.59; SD = .79); that group included 16 girls and 16 boys.
The TD group was obtained from three different public schools in the capital of a Spanish province. Students were chosen by their teachers according to certain criteria. First of all, they had no issues with their grades, and no emotional problems. Second, their parents consented to them being evaluated.
Meanwhile, the LD group was recruited by various pediatricians at the Children’s Center for Early Intervention and Development (CADIT is the Spanish acronym) to receive early intervention. According to their clinical records, these children had received a diagnosis within the category 4.g. Developmental Disorders of Speech and Language (SLI–Specific Language Impairment) according to the diagnostic criteria established by the State League of Professional Early Intervention Associations (FEAPAT is the Spanish acronym, 2008). They had previously undergone a series of medical examinations before arriving at CADIT and reportedly had no apparent psychiatric problems of an auditory or visual nature.
Instruments
The Escala de Habilidades y Potencial de Aprendizaje en Preescolares (EHPAP) (Calero et al., Reference Calero, Robles-Bello, Márquez and de la Osa2009) is a Spanish language adaptation of the original Application of Cognitive Functions Scale, or ACFS (Lidz & Jepsen, Reference Lidz and Jepsen2000).
The methodological paradigm used in learning potential assessment is pretest – training/intervention–posttest. Therefore, we administered a test to individuals in their usual condition, then they were trained to solve a similar task (never the same one), and last, a task parallel to the first was assigned. The computed difference between pre and posttest scores was considered a measure of learning potential. Standardized instructions were given to administer the test. During the intervention, or mediation phase, an instructional conversation was induced between learner and mediator; it will be described later in this section.
EHPAP scores indicate the child’s initial level of mastery of each task (pretest), and capture their receptiveness to intervention (posttest and score increase). Its six subscales tap the following cognitive skills: 1) Classification: create groups with the set of blocks presented. 2) Auditory Memory: read a short story, listen closely, and later tell it in the correct order of events. 3) Visual Memory: name the objects printed on eight slides. Next, think of a strategy to memorize the objects’ names. Last, there is a recall test. 4) Sequential Pattern Completion: a sequence or pattern is presented and respondents must complete it with the correct option from among various possibilities. 5) Perspective Taking: play the role of the facilitator and give all the instructions you think are necessary to teach someone to draw a picture. 6) Verbal Planning: state the behavioral sequence needed to perform a specific task.
Our assessment included the Escala de Observación Conductual (EOC) [Behavioral Observation Scale], which describes qualitative aspects of the child’s interaction with the materials and the examiner and was later the subject of a separate study.
Working with this type of methodology (Haywood & Lidz, Reference Haywood and Lidz2007) usually involves an intervention (mediation) between standardized pre and posttests. The scale’s pre and posttest tasks were either the same or close variations of the same task, and standardized instructions were given to carry out each one. The mediation in each test was chosen to strike a balance between imposing a degree of standardization, easing interpretation, and simplifying administration of the test. Despite that planning, the EHPAP sparked an instructional conversation between subject and mediator in which the mediator, or examiner, experienced what it is like to work with the child as a learner, and the child demonstrated his or her respective competencies and needs in a relaxed setting. Children adapted quickly and experienced minimal tension about the feeling of “taking a test.”
Traditionally, the mediation taking place as an examiner trains the learning respondent applies (Haywood & Wingenfeld, Reference Haywood, Wingenfeld, Haywood and Tzuriel1992a) Learning Potential Methodology. As such, we aimed to alter the test application situation, so after pretest measurement, the facilitator interacted with the respondent, employing “mediation,” defined in general terms by Haywood and Wingenfeld (Reference Haywood and Wingenfeld1992b) as process–oriented dialog characterized by (Lidz, Reference Lidz2004): (a) Intentionality: aiming to bring about cognitive change. (b) Transcendence: attempting a structural change that can be generalized to other situations. (c) Meaning: the mediator enhances and guides the child’s perceptual experience, helping him or her decide what to focus on and what to continue noticing. (d) Competence: showing the subject what aspects of their behavior are effective, reinforcing what they do well, and bringing to their attention any apparent obstacle to their learning, all so that the child trusts that they can perform well. (e) Regulation of Behavior and Goal Seeking, Setting, and Achievement: rules are set, at first external but later internalized. (f) Sharing: the examiner should enrich the child’s experience by making them aware of other people’s experiences and thoughts. (g) Task Regulation: presenting new learning in a way that promotes the child’s competency and mastery, as well as strategic, planned thinking. (h) Challenge: every learning situation posed tries to surpass the child’s current level of functioning and reach an even higher level than in the last situation. (i) Psychological Differentiation: the examiner should fulfill their role and facilitate learning while avoiding the temptation to be overly instructive; meanwhile, the child should allow him or herself to be mediated. (j) Contingent Responsivity: the facilitator should respond to the child in a timely, appropriate way. (k) Affective Involvement: the facilitator should transmit warmth and caring to the child to build a rapport and make the interaction pleasant for both parties. (l) Change: the examiner communicates to the child that he or she has been successful in learning and is developing competence.
Appendix 1 presents a sample procedure and mediation from the Perspective Taking subscale (source: Calero et al., Reference Calero, Robles-Bello, Márquez and de la Osa2009).
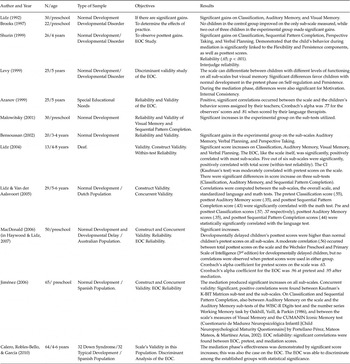
The original scale’s reliability and validity have been reported repeatedly, first by Lidz (Reference Lidz1992), then in Brooks’s (Reference Brooks1997) thesis, which used only the Classification sub-scale in children with developmental disorders who would benefit substantially from mediation, and compared them to a control group. Next came Shurin’s thesis (1999), which reported similar results but utilized all the sub-scales, followed by Levy’s thesis (1999), which explored the scale’s discriminant validity. Malowitzky’s study (2001) additionally examined the scale’s reliability and validity, as did a later study by Bensoussan (Reference Bensoussan2002). Aranov’s study (1999) focused exclusively on the EOC’s reliability and validity in children with special educational needs. Takit’s subsequent study (2000) aimed, for the first time, to determine the scale’s concurrent validity. Finally, Lidz (2004) analyzed its reliability and validity in a particular special needs population, deaf children.
All but the last three studies above were conducted in English-speaking populations. Furthermore, the first time the scale was applied outside the United States was when Lidz and Van der Aalsvoort (2005) tested its utility in a Dutch population. Haywood and Lidz (Reference Haywood and Lidz2007) confirmed it could be successfully applied in a population of Australian children. Jiménez (Reference Jiménez2006) reported that the original scale was applicable in a Spanish preschool population, while Calero, Robles-Bello and García (Reference Calero, Robles-Bello and García2010) found it to be effective in children with Down syndrome (Table 1 displays specific data about the ACFS’s reliability and validity, both the original English version, and the EHPAP).
Summary of Studies of the Reliability and Validity of the Original ACFS and its Spanish Adaptation, the EHPAP

Design
The present research followed a quasiexperimental design with 2 groups formed according to diagnosis: TD and LD. No LD control group was included because doing so would have drastically reduced the size of the LD experimental group. Furthermore, in favor of increasing initial sample size, we preferred to risk not being able to establish a causal relationship between applying the EHPAP and the results obtained; that sort of objective can be addressed in future studies. The groups were equivalent in terms of age.
To establish a differential performance profile based on EHPAP sub-scales, we first had to determine whether or not the two groups differed at pretest, so analysis of variance (ANOVA) was performed. Statistical analyses were carried out in pursuit of the second objective, including means comparison between the two groups with a repeated measures (pretest and posttest), general linear model design. Also, considering the effect size between pre and posttest, we estimated the magnitude of the difference between the variables involved.
Procedure
After obtaining informed consent from the parents of children in both groups to participate in this study, the assessment was carried out. All sessions were conducted on an individual basis. Administering the tests (pretest – mediation – posttest) took 20 minutes per sub-scale. The total procedure, then, required approximately two hours to complete, with breaks between sub-scales for children who needed them.
Each sub-scale was presented in a pretest – mediation/training – posttest format. In the pre and posttest phases, children were asked to carry out an activity with no help from the examiner so as to evaluate their independent performance before and after mediation. During the mediation phase, they were offered guidance to apply cognitive and problem–solving strategies linked to the cognitive functions needed to successfully complete each activity. Information collected during the mediation phase provided diagnostic indicators of the children’s receptiveness to instruction.
Results
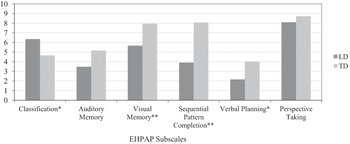
The first objective was to measure baseline performance in each of the two groups of children, that is, their pretest EHPAP scores. We expected to find significant differences in pretest scores on all EHPAP sub-scales, and computed means by carrying out the corresponding ANOVAs. As Figure 1 conveys, significant differences were detected on the sub-scales Classification, F(1, 63) = 7.01, p = .010, Visual Memory, F(1, 63) = 16.70, p < .0001, Sequential Pattern Completion, F(1, 63) = 8.035, p < .006, and Verbal Planning, F(1, 63) = 6.99, p = .010. On the remaining variables, Auditory Memory, F(1, 63) = 2.69, p < .106, and Perspective Taking, F(1, 63) = .500, p < .482, no significant differences were found between the two groups’ pretest situations.
Means Comparison between LD and TD Groups in the EHPAP Pretest Situation on All Sub-scales (* p < .05. ** p < .01).

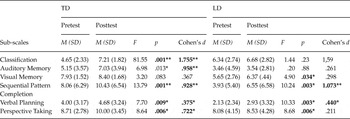
As for the second objective, to determine the effectiveness of the mediation phase in which the intervention took place, it was hypothesized that the two groups would differ significantly in terms of score increase (the difference between pre and posttest scores). Thus, a repeated measures general linear model was utilized. Table 2 shows that all differences were significant in the LD group, except on Classification and Auditory Memory. In the TD group, conversely, significant differences were observed between the two measurement times on all sub-scales but Visual Memory.
Pre and Posttest Scores and ANOVA Results for Pre and Posttest Scores on Each EHPAP Sub-scale in the LD and TD Groups. Effect Size of this Pre-post Difference is Included (Cohen’s d)

Note:
* p < .05. ** p < .01.
Concerning just how much scores increased through mediation, ANOVA results revealed that, in general, the TD group improved significantly more through intervention than the LD group. Differences were observed between groups in score increase (post-pre) on the sub-scales Classification, F(1, 63) = 81.55, p < .001; Auditory Memory, F(1, 63) = 6.98, p < .013; Sequential Pattern Completion, F(1, 63) = 13.79, p < .001; Verbal Planning, F(1, 63) = 17.70, p < .009; and Perspective Taking, F(1, 63) = 8.64, p < .006. Nevertheless, no significant differences were found on Visual Memory, F(1, 63) = 3.20, p < .083. Hence, effect size helped us determine the magnitude of the relationship between the variables in play. As Table 2 illustrates, we found the Cohen’s ds obtained were only significant on three of the sub-scales in the LD group: Auditory Memory, Sequential Pattern Completion, and Verbal Planning. In the TD group, however, significant differences occurred on all but the Visual Memory sub-scale. These findings further reinforce the results, which were not only statistically significant but also relevant from a clinical standpoint.
Discussion
This study sought to demonstrate that cognitive performance profiles in LD children receiving care through CADIT could improve by applying a mediation-type methodology, which is what learning potential assessment techniques utilize. The proposed goal was, utilizing the EHPAP scale, to analyze whether or not TD and LD children exhibit differential profiles in terms of learning-related cognitive abilities, and examine their response to mediation.
This interaction is rooted in the fact that many of the scale’s tasks are verbally rigorous. Even so, the protocol can be applied to children with significant language delays. Well-developed linguistic abilities are not necessary for some of the sub-scales and, for impaired children, the sub-scales can also serve to assess their receptiveness to intervention, and control their development over time (Haywood & Lidz, Reference Haywood and Lidz2007).
In response to the first question posed, if significant differences between cognitive performance profiles arose, the results revealed significant differences in pretest scores between the two groups on the majority of EHPAP sub–scales. Obviously, the results indicate the baseline situation was better for TD kids on most of the cognitive skills sub-scales, with two exceptions: Auditory Memory and Perspective Taking. That finding is at first disconcerting, because research has demonstrated that compared to children with normal development, cognitive functioning in those with LD is especially low in terms of verbal skills (Contreras & Soriano, Reference Contreras and Soriano2007; Pérez & Salmerón, Reference Pérez and Salmerón2006).
At this time, we must clarify that the EHPAP is not an Intelligence test, although how children function during its procedure is naturally influenced by what some people might consider intelligence. Still, conclusions should not be drawn, nor inferences made, about Intelligence based on performance on this scale. This applies especially to the concept of modifiability. The original scale’s authors (Lidz & Jepsen, Reference Lidz and Jepsen2000), along with this study’s authors (Calero et al., Reference Calero, Robles-Bello, Márquez and de la Osa2009), believe learning ability, modifiability, and receptiveness to experience should be incorporated into any definition of intelligence.
Following this line of reasoning, this protocol has provided evidence about the development of cognitive functions in children, functions linked to educational curriculum and content for children and their ability to learn, that is, to take advantage of the experience provided by the intervention’s various stages. That being said, modifiability and receptiveness are not synonymous with Intelligence. Our experience with learning potential assessment has clearly shown that some high-functioning children are not easily modifiable, and that certain lower functioning children can actually exhibit impressive modifiability. Authors therefore need to consider baseline performance level as well as receptiveness to intervention when interpreting the results of any assessment of this kind.
Analyzing the data more closely, the following progression becomes apparent. When we compared the two groups’ pretest situations, no differences registered. That is because these children were still quite little and the scale’s verbal demands may have exceeded their capabilities on two of the more verbally demanding sub-scales (Auditory Memory and Perspective Taking). That was not the case for the Verbal Planning sub-scale, which does not require as much of respondents, verbally; the task is visual. Nevertheless, in the TD group, kids benefited immediately from training, except on Visual Memory. That was likely due to a ceiling effect since they scored so high at pretest. Conversely, the anticipated benefits did not occur in the LD group; only Visual Memory, Sequential Pattern Completion, Verbal Planning, and Perspective Taking benefited. In contrast, Classification and Auditory Memory did not significantly improve. In other words, though the majority of sub-scales seem to reflect learning potential, this was not true of the sub-scale most closely aligned with language problems: Auditory Learning.
This impairment, of an almost entirely verbal nature, made them feel inhibited in a meditation relationship based purely on verbal dialog, suggesting this approach may lose efficacy in similarly impaired populations (Peña et al., 2006).
Thus, we argue that even though the learning potential assessment did not serve to benefit the LD group in terms of Auditory Memory, it could be used to discriminate children who truly exhibit DL from those with delayed language acquisition, which can occur for a variety of reasons. However, numerous studies of learning potential in children with developmental disorders of speech and language have already broached that subject (Gutierrez-Clellen & Peña, Reference Gutiérrez-Clellen and Peña2001; Jacobs, Reference Jacobs2001; Peña, Reference Peña2001; Peña et al., 2001; Peña et al., Reference Peña, Bedore and Rappazzo2003; Peña et al., Reference Peña, Gillam, Malek, Ruiz-Felter, Resendiz, Fiestas and Sabel2006; Peña & Quinn, Reference Peña and Quinn2003; Restrepo et al., Reference Restrepo, Schwanenflugel, Blake, Neuharth-Pritchett, Craner and Ruston2006; Swanson & Howard, Reference Swanson and Howard2005).
Despite the need to correctly discriminate among children with language problems not of a cultural or linguistic nature, we share the opinion of Hasson and Botting (Reference Hasson and Botting2010) that very few learning potential-based tests are available to evaluate children with this type of issue. Hasson et al. (Reference Hasson, Dodd and Botting2012) recently proposed an assessment protocol similar to this one. However, we cannot without reservation embrace the EHPAP as an assessment procedure for children with LD, because the proposed design did not allow us to draw conclusions about a causal relationship between applying the EHPAP and the results obtained. That was primarily because an LD control group was not included. It would certainly be eye-opening to document differential responses to the mediation in two LD groups. That will definitely be explored in a future study.
Even in light of the above, we dare to argue that this scale can serve as a valid instrument to assess possible language impairment in children, and not only that; its use could be extended to other populations of children to whom EI programs are tailored. The present research revealed, first, that this scale can determine what children will require intervention during language development and second, that it can be helpful in planning useful interventions. Moreover, this scale and its protocol teach us as educators about a child’s “zone of current development,” provide a format to create a “zone of proximal development,” and allow us to make inferences about a child’s instructional needs and hypothesize about potentially useful interventions. The EHPAP is more a model of cognitive functioning than a theory.
These sub-scales tap functions linked to universal abilities that sustain learning, which are tied to mastery of a wide variety of tasks as well as literacy (reading and writing ability), numerical ability, and scientific thinking. These functions and processes are often cited by eminent cognitive researchers as basic, essential characteristics of cognitive functioning, and include the processes classification, memory, sequencing, and planning (Calero et al., Reference Calero, Robles-Bello, Márquez and de la Osa2009). The idea of “looking at things from the other’s perspective” is essential to the basic human capacity for social interaction, especially since it is hard to imagine a competent social interaction without that skill. Including planning (metacognition) and perspective taking processes in a procedure for small children was highly unique; this scale was the first to do so. The remaining processes have been addressed by other, more traditional instruments, though clearly not with a learning potential format. This scale does not include every single process learning may be based on, but it does help assess what are definitely some of the most important.
We concur with Jacobs’s (Reference Jacobs2001) assertion that children with language development issues must be identified as early as possible; it has been established that those who do not reach appropriate development between 3 and 5 years-old experience rather serious problems, not only in language development but also socialization and academic development. Consequently, research in preschool-aged children is of the utmost importance (Jacobs & Coufal, Reference Jacobs and Coufal2001); they would benefit from an approximate diagnosis using this scale, the earlier the better. Furthermore, if a child shows weakness on some sub-scale of the EHPAP, we can make recommendations, not referring to ability, per se, but to strategies that put those functions into practice. Working from the assumption that processes can be influenced by experiences, the way to positively influence processes is to optimize the child’s experiences. This distinction is an inherent part of the EHPAP procedure, which was designed to assess cognitive functions. We make certain inferences about a child’s functioning (abilities) from observed applications (performance), but ultimately, we can only know how they performed in this instance.
One limitation of this approach, compared to traditional assessment, is that to apply it requires a great deal of experience and practice on the part of the facilitator. In addition, the assessment requires considerable time to complete (Losardo & Notari-Syverson, Reference Losardo and Notari-Syverson2001). Finally, this area is little–known to practicing psychologists, which is a hindrance to both its applicability and scope.
Another limitation lies in how the LD group was defined. Although the children were sourced according to a particular diagnosis, that diagnosis was very broad; we only ask that it become more specific over time. As researchers working with this type of population, we need to find instruments to help us more thoroughly define diagnoses. Moreover, in learning potential, we have found a tool that promises to be useful in detecting individuals who might initially seem impaired, but are actually quite capable of improving.
Appendix 1 SAMPLE PROCEDURE AND MEDIATION FROM THE PERSPECTIVE TAKING SUB-SCALE.
Source: Calero, Robles-Bello, Márquez and de la Osa (Reference Calero, Robles-Bello, Márquez and de la Osa2009).
Materials: Colored pencils or chalk of the child’s choosing and 6 sheets of size A4 white paper. A picture of a kid, a cat, and a bear on separate sheets.
PRETEST: Take the picture of the KID, along with the pencils and sheets of white paper. Place a sheet of paper in front of the child and another before the examiner. Put the picture in–between the examiner and the child, and the pencils above the picture. Say “Now we are going to do something a little different. I want YOU to be my teacher. I want you to help me draw this picture. Teach me how to draw a picture of this kid. What do I need to do?” If the child vacillates or starts to draw, say right away: “Don’t forget! You’re the teacher. Teach me or tell me how to draw the picture.”
If the child starts to give instructions and later stops or makes a mistake, prompt him or her again, say: “Don’t forget! You need to teach me how to draw the picture.” If the child gives instructions or makes verbal comments, the facilitator draws exactly what they say. In other words, the examiner does not wait for the child to tell them to draw.
TRAINING-MEDIATION: Set the CAT drawing, a sheet of white paper, and the pencils in front of the child and examiner. Say: “Good. Now it is my turn to be the teacher. I am going to teach you how to draw this cat. Which pencil do you want to use?” Model teaching with verbalizations and demonstration: the order in which to draw; ways to create the cat’s body parts; where to put lines or parts of the cat’s body; details about what to do.
POSTTEST: Place the BEAR picture, the pencils, and two white pieces of paper as in the pretest. Say: “Now it is your turn to be the teacher. Teach me how to draw this picture of a bear. What do I need to do? Don’t forget; you have to teach me how to do this.”