Healthcare-associated infections (HAIs) are a major source of morbidity, mortality, and healthcare costs in the United States.Reference Stone 1 – Reference Stone, Pogorzelska-Maziarz and Herzig 4 As a result, national and state policymakers, professional societies, and clinical leaders have increasingly focused their energy and efforts on reducing these events to improve patient care.Reference Berenholtz, Lubomski and Weeks 5 – Reference Pronovost, Goeschel and Colantuoni 8 As the largest national payer of healthcare in the United States, the Centers for Medicare and Medicaid Services (CMS) was the first to implement financial disincentives in an attempt to improve quality of care through the Hospital-Acquired Conditions (HAC) policy in 2008. This policy ceased additional reimbursements to hospitals for the costs of care associated with billing codes for selected “preventable events.” This included specific HAIs contracted during hospitalization that were deemed not present on admission, a policy that Medicaid subsequently implemented in 2012.Reference Straube and Blum 9 , 10
Some institutions, particularly safety net hospitals working in resource-constrained settings, may be more vulnerable to the lost revenue of such policies. Although a broad range of characteristics is used to define safety net status, a common theme is that these hospitals care for a disproportionate number of poor and minority patients who may have more comorbidities and/or psychosocial challenges. 11 Policymakers may want to ensure these efforts are effective and do not lead to unintended consequences,Reference Ly, Lopez, Isaac and Jha 12 , Reference Werner, Goldman and Dudley 13 such as reduced resources for overall patient safety efforts that could inadvertently lead to increased infection rates. Since prevention of HAIs involves significant hospital resources dedicated to surveillance and prevention efforts,Reference Hoff, Hartmann, Soerensen, Wroe, Dutta-Linn and Lee 14 – Reference Lee, Montgomery, Marx, Olmsted and Scheckler 17 we sought to understand whether the 2008 CMS HAC policy had an impact on central line–associated bloodstream infection (CLABSI) rates, as defined by the National Healthcare Safety Network (NHSN), in safety net hospitals compared with non–safety net hospitals. 18 We also examined the impact on ventilator-associated pneumonia (VAP) rates as a comparison outcome that was not targeted by the CMS policy.
METHODS
Study Design and Population
We used an interrupted time series with comparison series design to evaluate the differential impact of the HAC policy on targeted HAI rates by safety net status. We examined CLABSI rates targeted by the CMS policy and VAP rates, a comparison outcome not targeted by the policy. Acute care hospitals reporting data to NHSN before the implementation of the 2008 HAC policy in the Preventing Avoidable Infectious Complications by Adjusting Payment (PAICAP) study were recruited and enrolled. 19 , Reference Lee, Kleinman and Soumerai 20 Hospitals were eligible if they were nonfederal, had a Medicare Disproportionate-Share Hospital (DSH) index available, 21 and reported HAI rates to the Centers for Disease Control and Prevention’s NHSN during the study period. 22 We excluded federal, Maryland waiver, critical access, long-term care, cancer, psychiatric, children’s, and rehabilitation hospitals that were not subject to the Inpatient Prospective Payment System and, therefore, would not be penalized by the Medicare HAC policy. 23 We obtained hospital characteristics from the 2009 American Hospital Association annual survey including region (Midwest, Northeast, South, West), urbanicity (metropolitan, micropolitan, rural), number of beds (<100, 100–399, ≥400), teaching status (graduate, major, minor, nonteaching), nurse to patient ratio, and type of ownership (for-profit, not-for-profit, public). 24
To evaluate the impact of the HAC policy, we examined NHSN-defined HAI rates, rather than International Statistical Classification of Disease, Ninth Revision (ICD-9) billing codes for vascular catheter-associated infections or ventilator-associated pneumonia, since NHSN uses standardized national surveillance definitions based on review of clinical and laboratory data.Reference Straube and Blum 9 , 25 , Reference Horan, Andrus and Dudeck 26 Quarterly rates of infections in adult medical, surgical, and medical/surgical critical care units in safety net hospitals and non–safety net hospitals were measured from July 1, 2007, through December 31, 2013, for CLABSI and from July 1, 2007, through December 31, 2012, for VAP (because VAP surveillance was replaced by ventilator-associated events reporting in January 2013). CMS implemented the HAC policy on October 1, 2008, which allowed us to assess the impact of the payment policy on changes in both level and slope of CLABSI and VAP rates in the postpolicy (October 1, 2008, to December 31, 2013, for CLABSI or to December 31, 2012, for VAP) compared with the prepolicy (July 1, 2007–September 30, 2008) period. This study received approval from the institutional review board of Harvard Pilgrim Health Care.
Safety Net Definition
We used the Medicare DSH index to identify safety net hospitals. 21 , Reference Meddings, Saint and McMahon 27 , 28 DSH indices obtained from the 2009 Historical Impact File were used to determine the national DSH median and quartiles for 2009 CMS Medicare Provider Analysis and Review data file, the midpoint of our study period. 29 , 30 Ninety-seven percent of all Inpatient Prospective Payment System hospitals (3,205/3,304) had a published DSH index. Similar to previously published studies,Reference Chatterjee, Joynt, Orav and Jha 31 , Reference Jha, DesRoches and Shields 32 safety-net hospitals were identified as those with a DSH index in the highest DSH quartile (>34% in 2009). Hospitals in the first through third DSH quartiles were considered non–safety net hospitals.
Data Analysis
To explore differences in hospital characteristics by safety net status, we used χ2 or Wilcoxon rank sum tests. To examine the effect of the HAC policy on CLABSI rates in safety net and non–safety net hospitals, we used a negative binomial mixed effects regression model with log device days in the offset term. The model included random effects to allow for clustering within hospital and hospital unit and unique trends over time for each hospital. Independent variables included hospital type (safety net or non–safety net), time, and the period in which 2008 CMS HAC policy was in force (referred to as the policy period). Their 2-way and 3-way interaction terms were included, to allow for effects with interpretations as follows. The interaction term for policy*safety net status examines the change in intercept at the time of policy implementation in safety net vs non–safety net hospitals. The 3-way interaction term describes whether the slope of infection rates changed differently in safety net hospitals compared with non–safety net hospitals beginning at the time of the policy change. We used similar methods to explore VAP, which was not subject to the HAC policy.
Our primary analysis included all hospitals that contributed data to the NHSN at any point during the study period. In sensitivity analyses, we examined in separate models the effect of (1) restricting to hospitals that consistently reported infection data between July 2007 and the end of the study period to ensure our findings were not affected by variability in initiation of hospital reporting over time, (2) restricting to hospitals that did not change safety net status during the study period, or (3) adjusting for nurse full-time equivalents per 1,000 patient-days since staffing levels have been associated with the quality of care delivered.Reference Clarke and Donaldson 33 Analyses were completed using SAS, version 9.4 (SAS Institute), 34 and P<.05 was considered to be statistically significant.
RESULTS
Study Population
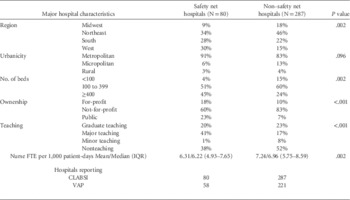
Three hundred sixty-seven hospitals contributed CLABSI data and 279 hospitals contributed data for VAP. Among these hospitals, all 279 hospitals reporting VAP data were also reporting CLABSI data during the study period. Of the 367 hospitals contributing CLABSI data, 80 (22%) were designated safety net hospitals. For those reporting VAP, 58 (21%) were considered safety net hospitals. Safety net and non–safety net hospitals within our study population differed significantly by region, size, type of ownership, nurse to patient ratio, and teaching status, but not by urbanicity (Table 1). Safety net hospitals were more likely to be public and not-for-profit, be affiliated with academic centers, and have a large number of beds.
Characteristics of Participating Safety Net Hospitals vs Non–Safety Net Hospitals, Reporting CLABSI or VAP 2007–2013

NOTE. CLABSI, central line–associated bloodstream infection; FTE, full-time equivalents; IQR, interquartile range; VAP, ventilator-associated pneumonia.
Impact of CMS HAC Policy in Safety Net and Non–Safety Net Hospitals
Figure 1 shows pooled CLABSI infection rates per 1,000 device-days for safety net and non–safety net hospitals. There was no visible effect of the policy change on CLABSI rates in either safety net or non–safety net hospitals between 2007 and 2013. In our models, the slopes in the pre- and postpolicy periods for safety net hospitals were 1.02 (95% CI, 0.89–1.17) and 0.98 (0.96–0.99), respectively. In non–safety net hospitals, the slope in the prepolicy period was 0.97 (95% CI, 0.88–1.08) and the slope after the policy was implemented was 0.97 (0.95–0.98). The ratio of the slopes between the post- vs prepolicy period did not differ between safety net (0.96 [95% CI, 0.84–1.09]) and non–safety net hospitals (0.99 [0.90–1.10]) (P for the 3-way interaction [ie, the difference between .96 and .99]=.68). In other words, the policy did not affect these types of hospitals differently with respect to their trends over time.
Rates of central line–associated blood stream infections (CLABSI) reported by safety net vs non–safety net hospitals. HAC policy, Hospital-Acquired Condition policy.

We also considered whether there might have been an immediate impact of the CMS HAC policy at the time of implementation by testing for a change in intercept. Again, we did not detect differences in an immediate response to the CMS policy between safety net and non–safety net hospitals (P for 2-way interaction, policy*safety net=.87). Thus, the CMS HAC policy did not have any differential impact on clinically relevant rates of CLABSI in safety net vs non–safety net hospitals.
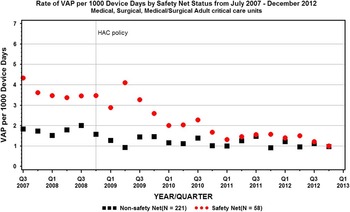
Our findings were similar for VAP (Figure 2), which served as our comparison condition that was not targeted by the CMS HAC policy. The VAP rates appear to decline in both safety net and non–safety net hospitals during our study period. Although the gap appears to be narrowing over time (Figure 2), our models did not detect a statistically significant differential rate of change in the post- vs prepolicy period for VAP rates between safety net and non–safety net hospitals (P for the 3 way interaction=.72). Similarly, there was no change in the intercept at the time of the policy in either safety net or non–safety net hospitals (P=.17). When we restricted to the subset of hospitals (N=102 for CLABSI; N=58 for VAP) that reported data consistently after July 1, 2007, excluded the 27 hospitals that changed safety net status on the basis of their DSH index during the study period, or adjusted for nurse full-time equivalents per 1,000 patient-days, our findings remained similar (data not shown): there were no differences between the safety net and non–safety net hospitals with respect to post- vs prepolicy trends in CLABSI rate, and there were no changes in rate in either group at the policy date.
Rates of ventilator-associated pneumonia (VAP), reported by safety net vs non–safety net hospitals. HAC policy, Hospital-Acquired Condition policy.

DISCUSSION
As there was no difference observed in the rate of decline of CLABSI rates in the post- vs prepolicy period, the CMS HAC policy did not have either a positive or negative impact on targeted HAI rates. Although we initially hypothesized that this payment policy may have had a detrimental impact on safety net hospitals, resulting in higher infection rates due to increasingly constrained resources, we found instead that the policy did not affect infection rates in either safety net or non–safety net hospitals.
Our findings are similar to previously published work demonstrating that the HAC policy had little impact on HAIs,Reference Lee, Kleinman and Soumerai 20 which may be due in part to the minimal financial impact incurred by hospitals.Reference McNair, Luft and Bindman 35 These analyses provide policymakers with additional information about the potential for unintended consequences of the 2008 CMS HAC policy on infection rates among a subset of hospitals that care for a high proportion of poor and minority patients. Downward trends in both hospital types may represent an overall positive awareness or acceptance of patient safety culture and may be reflective of efforts by safety net hospitals to continue strengthening HAI initiatives. 36
A particular strength of this study is the inclusion of a comparison condition that was not affected by the CMS HAC policy. As anticipated, the policy did not have an impact on VAP rates at the time of implementation, nor did it have an impact on the relative rate of decline in the post- vs prepolicy periods. We did observe, however, that the apparent gap between safety net and non–safety net hospitals appears to be narrowing overall, though this was independent of the effect of the policy. Continued efforts by safety net hospitals to reduce disparities in quality and outcomes are reassuring, though concerns remain about the potential for growing financial penalties to increase disparities for vulnerable populations.
Although to our knowledge this study is the first to evaluate the clinical impact of the CMS HAC policy on potential disparities in HAIs for safety net vs non–safety net hospitals, a few key limitations should be noted. First, we focused our analyses on HAIs reported to NHSN, even though the HAC policy uses ICD-9 billing data as the metric for improvement. We purposely chose to use NHSN data in order to focus on clinically relevant outcomes, particularly since billing data is known to have low sensitivity and moderate positive predictive values, and may be subject to potential reporting bias.Reference Calderwood, Kleinman and Soumerai 37 – Reference Harris, Gay, Neff, Patrick and Sedman 39 Second, the results of our study are based on a subset of Inpatient Prospective Payment System hospitals reporting data to NHSN since 2007. Because only a quarter of US hospitals were reporting NHSN data at that time and we had only a subset of these hospitals enrolled, our power to detect a differential impact in safety net vs non–safety net hospitals may have been limited. Furthermore, our findings may not be generalizable to all US hospitals affected by the 2008 CMS HAC policy. Third, we did not examine the financial or nonfinancial impact of the HAC policy in safety net or non–safety net hospitals. We anticipate the actual financial penalties would be minimal, due to complexity codes, outlier payments, or even changing the position of the HAC in the list of diagnosis codes.Reference Johnson, Kane, Odwazny and McNutt 40 , Reference McNutt, Johnson and Odwazny 41 However, it is plausible that even small financial penalties might have an effect on available resources for prevention. Alternatively, hospitals with constrained resources may focus their improvement efforts on HACs targeted by the CMS policy, shifting their efforts away from other important prevention needs in their population.Reference Lee, Hartmann and Graham 42 , Reference Hartmann, Hoff, Palmer, Wroe, Dutta-Linn and Lee 43 Fourth, defining a hospital’s safety net status on the basis of the DSH index may not be ideal for future evaluations, because DSH funds will eventually be reduced with the passage of the Affordable Care Act.Reference Coughlin, Long, Sheen and Tolbert 44 – Reference Bachrach, Braslow, Karl and Bruce 46 Finally, we examined the impact of the HAC policy only on CLABSI rates in our study, and not on a broader range of patient outcomes. However, this is one of the first evaluations to consider the impact of the 2008 CMS HAC policy on an important patient outcome in safety net hospitals—that is, the development of a serious infection during hospitalization.
The CMS HAC policy did not have a positive or negative impact on infection rates in safety net hospitals that care for underserved populations. With the expansion of Medicaid, reduction of DSH payments, and changes in reimbursements to hospitals based on quality benchmarks, it will remain a priority of future research to ensure disparities in rates of infection and other key patient outcomes do not emerge or widen for safety net hospitals.
Acknowledgments
We are extremely grateful to our hospitals for participating in the PAICAP study, including the following: Abington Memorial Hospital (Abington, PA), Advocate BroMenn Medical Center (Normal, IL), Advocate Illinois Masonic Medical Center (Chicago, IL), Advocate Lutheran General Hospital (Park Ridge, IL), Akron General Medical Center (Akron, OH), Altru Health System (Grand Forks, ND), Anna Jaques Hospital (Newburyport, MA), Blessing Hospital (Quincy, IL), Brookwood Medical Center (Birmingham, AL), Capital Region Medical Center (Jefferson City, MO), Carle Foundation Hospital (Urbana, IL), Centura Health/Porter Adventist Hospital (Denver, CO), Cooley Dickinson Hospital (Northampton, MA), Creighton University Medical Center (Omaha, NE), Einstein Healthcare Network (Philadelphia, PA), Excela Health Frick Hospital (Mount Pleasant, PA), Excela Health Latrobe Hospital (Latrobe, PA), Excela Health Westmoreland Hospital (Greensburg, PA), Fletcher Allen Health Care (Burlington, VT), Franklin Hospital (Franklin Square, NY), Glen Cove Hospital (Glen Cove, NY), Greenville Memorial Hospital (Greenville, SC), Hahnemann University Hospital (Philadelphia, PA), HealthAlliance Hospital (Leominster, MA), Huntington Hospital (Huntington, NY), Indiana University North Hospital (Carmel, IN), Iroquois Memorial Hospital (Watseka, IL), J. C. Blair Memorial Hospital (Huntingdon, PA), KentuckyOne Health–Saint Joseph Hospital (Lexington, KY), KentuckyOne Health–Saint Joseph East (Lexington, KY), Legacy Salmon Creek Hospital (Vancouver, WA), LewisGale Hospital Montgomery (Blacksburg, VA), Long Island Jewish Medical Center (New Hyde Park, NY), Marquette General Hospital A Duke LifePoint Hospital (Marquette, MI), Mercy Fitzgerald Hospital (Darby, PA), Moses Taylor Hospital, an affiliate of Commonwealth Health (Scranton, PA), Mount Sinai Hospital (Chicago, IL), MultiCare Health System (Tacoma, WA), North Shore University Hospital (Manhasset, NY), NorthShore University HealthSystem (Evanston, IL), Northwestern Memorial Hospital (Chicago, IL), OSF Saint Francis Medical Center (Peoria, IL), Plainview Hospital (Plainview, NY), Providence Saint John’s Health Center (Santa Monica, CA), Sacred Heart Hospital (Allentown, PA), Saddleback Memorial Medical Center (Laguna Hills, CA), San Gorgonio Memorial Hospital (Banning, CA), San Ramon Regional Medical Center (San Ramon, CA), SBH Health System (Bronx, NY), Sierra Provence East Medical Center (El Paso, TX), Silver Cross Hospital (New Lenox, IL), Sinai Health System / Holy Cross Hospital (Chicago, IL), Somerset Medical Center (Somerville, NJ), Southside Hospital (Bay Shore, NY), St. Joseph Hospital (Nashua, NH), St. Joseph’s Medical Center (Stockton, CA), St. Mary’s Hospital (Decatur, IL), Stamford Hospital (Stamford, CT), Summa Health System, Akron City and St. Thomas Hospitals (Akron, OH), SUNY Downstate Medical Center, University Hospital of Brooklyn (Brooklyn, NY), Syosset Hospital (Syosset, NY), Thomas Jefferson University Hospitals (Philadelphia, PA), Trident Health (Charleston, SC), Tucson Medical Center (Tucson, AZ), Twin Cities Community Hospital (Templeton, CA), UAB Hospital (Birmingham, AL), United Memorial Medical Center (Batavia, NY), University of California Irvine Health (Orange, CA), Vassar Brothers Medical Center (Poughkeepsie, NY), WakeMed Health & Hospitals (Raleigh, NC), Wentworth-Douglass Hospital (Dover, NH), West Georgia Health (LaGrange, GA), and Yavapai Regional Medical Center (Prescott, AZ). Two hundred ninety-five additional hospitals that contributed data to these analyses wish to remain anonymous.
We are grateful to Ashish Jha, for his support and technical advice in the planning and execution of this study; L. Clifford McDonald from the Centers for Disease Control and Prevention, for his review and contributions to the article; Kelly Peterson, for providing additional NHSN information in this article; key members of our PAICAP Policy Advisory Board (Neil Fishman from the Society of Healthcare Epidemiology of America, John Jernigan and Scott Fridkin from the Centers for Disease Control and Prevention); members of our PAICAP Infection Prevention Advisory Board (Victoria Fraser, Teresa Horan, Susan Huang, Robert Weinstein, Deborah Yokoe); and key members of the PAICAP team (Richard Platt) who provided continual guidance and support.
Financial support. Agency for Healthcare Research and Quality (grant R01HS018414 to G.M.L.) and National Institute of Child Health and Human Development (training grants 5T32HD066148 and 1T32HD075727 to L.E.V.).
Potential conflicts of interest. All authors report no conflicts of interest relevant to this article.
Disclaimer. The content is solely the responsibility of the authors and does not necessarily represent the official views of the Agency for Healthcare Research and Quality.