Election reforms have attracted substantial attention since the troubled elections of 2000. Some address problems in the administration of elections. Others aim to regulate the conduct of elected officials and lobbyists. A third category affects the structure by which elections are conducted. It is not clear whether the same over-arching problem motivates interest in these reforms. One common theme may be that public confidence in representation suffers as a result of actual or perceived deficiencies in the conduct of elections and elected officials. The failure to count votes accurately, the fact that eligible voters find they are unable to vote, the inability of minor parties to access ballots, revelations of scandalous relations between representatives and lobbyists, the power of wealthy donors, the lack of “civility” in political discourse, the uncompetitive nature of many elections, may all somehow act together to erode public trust, and reduce participation and engagement with representative democracy.
In considering contemporary electoral arrangements, we must ask, “what is the main problem that reforms intend to target, and what are the mechanisms by which reforms might fix the problem?” If public cynicism about representative democracy is part of the problem that reforms are supposed to fix, it is not clear how much improvement in the administration of elections can accomplish. The sources of public cynicism about elections may include a polarized party system and uncompetitive elections that fail to mobilize or engage many citizens. Contemporary reform proposals that attract bipartisan support may have little effect on this problem.
Reforms of Old: The Responsible Party Model
One of the most enduring academic statements in favor of political reform was the American Political Science Association's report (1950) “Toward a More Responsible Two-Party System,” which called for wholesale changes to how American political parties operated. In 1950, “weak” parties were the target of reformers. One of the “problems” reformers identified was that American parties did not provide an adequate opportunity for the electorate to hold government accountable. Parties in power were not able to control their members in office, nor coordinate the branches of government, nor effectively implement programmatic goals that defined the party. The lack of intra-party cohesion left voters unable to assign responsibility to a party and unable to select between distinctive governing and opposition party options.
The report proposed several reforms to make the two major parties more hierarchical, cohesive, programmatic, and ideologically distinct from each other. These included (but were not limited to): strengthening national party offices with more funding and staff resources; changing rules to allow parties a meaningful role in financing congressional candidates; increasing party discipline in Congress; creating more coherent party leadership over rank and file members of Congress; closing participation in nomination contests to registered partisans; giving rank-and-file party members direct control over delegate selection to national conventions; placing greater emphasis on national policy in congressional elections; and placing a greater emphasis on policy in party platforms. For decades after the issue of the report, the fragmentation of the party system at the elite level, the shift to candidate-centered presidential nominations, the decline of attachments to parties in the electorate, and the lack of collective responsibility in the American political system remained problems of concern for political science (e.g., Polsby 1983; Wattenberg 1991; 1998; Fiorina 1980).
There is some irony upon reviewing the report. We have not heard as much in recent years about the ideological congruence of the parties, nor as much about a lack of party unity in Congress. Enough has transpired to create a situation where arrangements appear a bit like what the report wished for. Party identification played a stronger role in structuring voter behavior by the late 1990s than it did 30 years earlier (Bartels 2002). Party leadership in Congress, although by no means parliamentary, is more cohesive and hierarchical than in decades past (Sinclair 2006). Even with “soft money” excluded, parties now play a much larger role in financing congressional races, and in recruiting candidates.
Party Polarization
Evidence that parties are more internally cohesive and ideologically distinct can be seen in floor voting in Congress (Groseclose et al. 1999; Poole and Rosenthal 1997), and in public attitudes and behavior. The proportion of all floor votes where most House Democrats voted one way and most House Republicans voted the other increased through the 1970s, 1980s, and 1990s. The percent of Democrats voting together against Republicans who voted together on such unity votes increased steadily through 2000 (Donovan and Bowler 2004, 44). Scholarship in political science has moved from a 1950s concern that Democrat and Republican elites (and voters) were often indistinguishable from each other on many measures (e.g., Campbell et al. 1960), to a more recent debate about whether the polarization of American parties exists only at the elite level (Fiorina et al. 2005), or at both the elite level and in the mass public (Layman and Carsey 2002; Hetherington 2001).
One less documented aspect of this polarization is that Democrats increasingly dislike Republican candidates, and Republicans increasingly dislike Democratic candidates. Since 1968, Democratic partisan identifiers have given Republican presidential candidates lower marks on feeling thermometer scores measured in American National Election Study (NES) surveys. On average, Democrats ranked President Richard M. Nixon at or above 55 both years he won, and placed President Gerald R. Ford around 50—in other words, Democrats generally had positive or neutral feelings about these Republicans. By 2004, however, Democrats rated President George W. Bush a cool 34, and Republicans were cooler toward Democratic presidential nominee John Kerry in 2004 than they were to any Democratic presidential candidate other than George McGovern.1
There has also been a steady increase in the net likes and dislikes that partisans cite about their rival party's presidential candidates since 1956.
Partisans' dislike of their rival party's candidates extends to evaluations of congressional candidates as well. Democratic partisans have held fairly steady in their feelings about Democratic congressional candidates since 1978, while becoming increasingly cool toward Republican congressional candidates. Republicans have grown more fond of Republican congressional candidates since 1992, and have become much cooler about Democratic candidates since 1990. From 1990 to 2004 there was a steady increase in this gap. By accident or by design, the American political system is now characterized by polarized party elites, and by polarized partisans.
The sources of this polarization lie in demographic trends (McCarty, Poole, and Rosenthal 2006), and in the structure of our election system (Cox and Katz 2002; Jacobson 2005). Realignment in the South and in New England has made the consistency base of the national parties more internally cohesive. Nomination processes in homogeneous districts (Burden 2004), the role of “extremist” party activists (King 1997), and ideologically motivated patrons who control campaign funds may have also shaped the pool of successful candidates and increased the distance between the parties.
In addition, the small number of competitive districts in the U.S. House means that the vast majority of representatives are from safe seats. These districts elected members who were more extreme ideologically than the national median voter (or the median district nationally).2
Homogeneous one-party districts may elect ideologically extreme members. Ansolabehere et al. (2001) find competitive races are more likely to produce moderate candidates. Also see Fiorina (1973); Sullivan and Uslaner (1978).
Marginal, centrist Democrats (according to DW-NOMINATE scores) included: Salazar (CO 03); Higgins (NY 27); Bean (IL 08); Costa (CA 20); Barrow (GA 12).
E.g., Sordel (IN 09) .518; Hostettler (IN 02) .712; Chocola (IN 02) .644; Taylor (NC 11) .537.

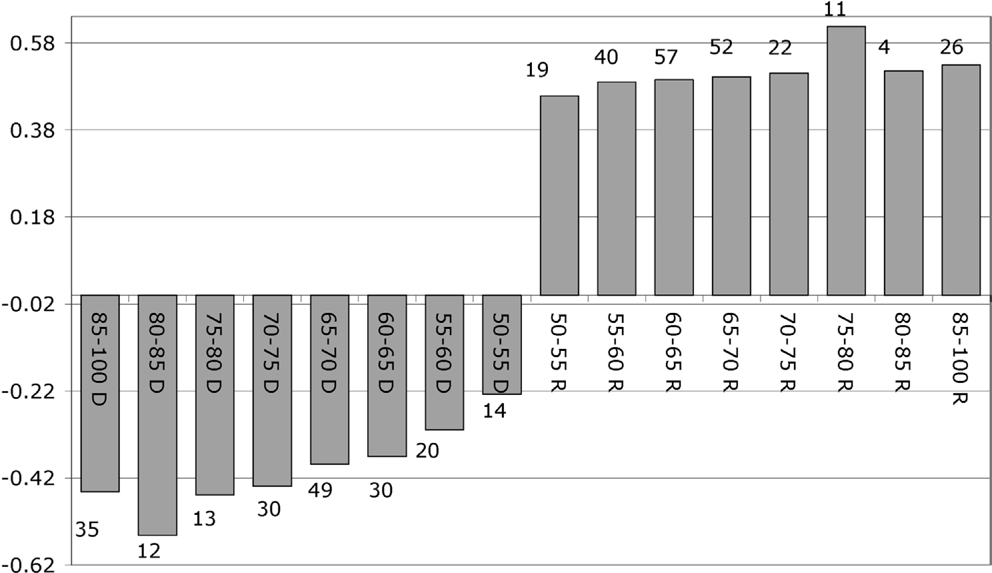
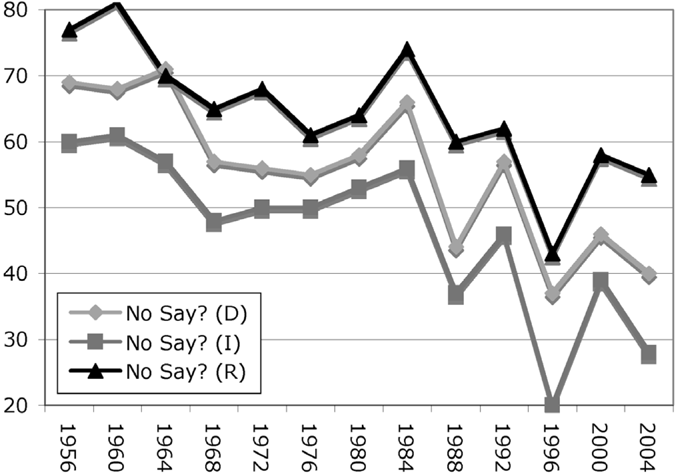
Floor Votes of Members of 109th Congress, by Their Vote Share in Previous Election
Note: Each bar represents the average DW-NOMINATE score for representatives in each type of district. −1 = most liberal, 1 = most conservative. Representatives are categorized by their 2004 vote share. The number under (over) each bar is the number of districts in a category.
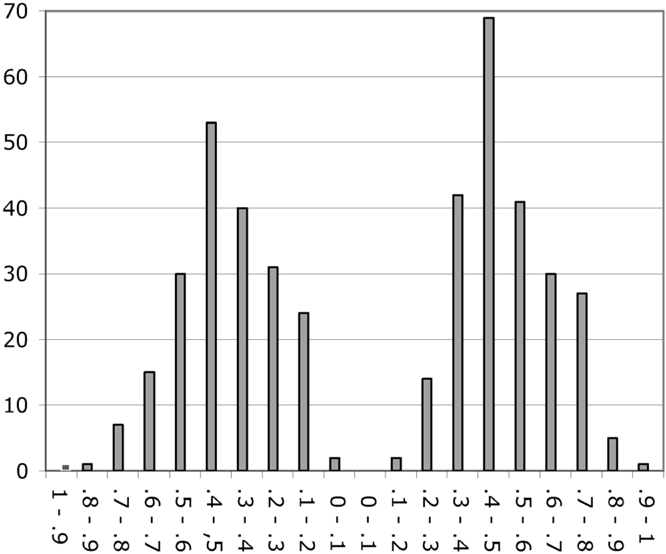
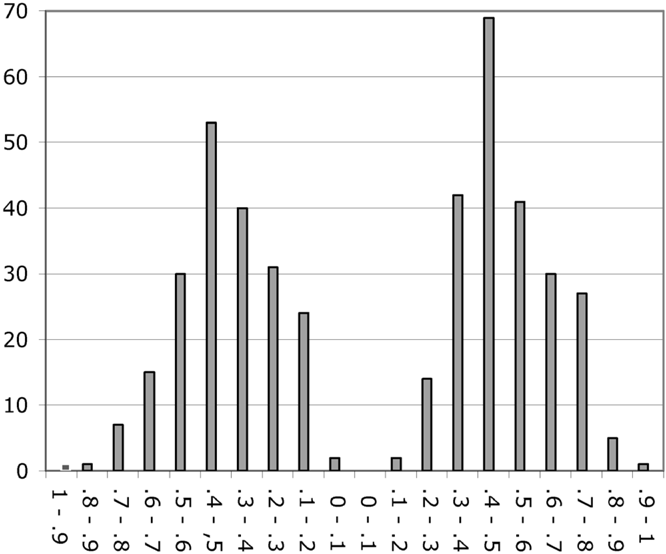
Distribution of Representation in the U.S. House, 109th Congress
Note: Bars reflect the number of representatives with DW-NOMINATE scores in the ranges listed on the x-axis. Values to the left are more liberal, values to the right more conservative. N = 434, mean = −0.02.
The 2006 midterm election may suggest that even with polarization and limited competition, U.S. elections still act as a mechanism that allows voters to hold government accountable. But as the values above and below the bars in Figure 1 illustrate, there are few marginal districts. By 2002, there were fewer two-party competitive U.S. House districts than at any point since 1900 (Donovan and Bowler 2004). A 5.5% vote-swing against the majority party in 2006 yielded a 30-seat midterm loss that was below average for comparable elections in the post-WWII era. In 1994, the 6.3% “Republican Revolution” swing against Democrats produced a 55-seat loss. The post-Watergate swing of 5.8% against Republicans in 1974 produced a 48-seat loss. A 5% swing yielded a 47-seat loss in 1958. The decline in competition means it may now take a larger swing to move fewer seats (Issacharoff and Nagler 2006).
In addition to effects on the magnitude of seat swings, marginality has consequences for the distribution of representation. With fewer competitive seats, there are fewer representatives in the center. This is illustrated in Figure 2, which displays the number of representatives in the 109th Congress across the ideological range (represented by DW-NOMINATE scores). Those farthest from the center tend to come from safer seats (see Figure 1) and thus are most insulated from national vote swings against their party.
The bimodal distribution in Figure 2 demonstrates the absence of a center in the American political system. It is a distribution at odds with the ideological self-placement of the American electorate, which has the qualities of a normal, “bell-shaped” distribution (Fiorina et al. 2005). Yet in the House, the median Democratic representative in the 109th Congress was reflected by liberal members such as Patrick Kennedy (RI) and Howard Berman (CA). The median Republican by conservatives Dennis Hastert (IL) and Virgil Goode (VA), a vocal opponent of Muslim immigration and of a Muslim being sworn-in to the 109th Congress with the Koran. In 2004, the presidential candidates were also linked to the ideological poles of their party in Congress. This can be seen when Bush and Kerry are placed on a similar roll-call vote measure of ideology. Kerry's floor votes placed him to the left of a large majority of senators from his party, while Bush's (inferred) issue positions placed him to the right of nearly all senators from his party (Clinton et al. 2004).
Be Careful What You Wish For
Whatever the causes of elite polarization, our current political environment reflects some (or much) of what the 1950 reformers wished for. This begs the questions: Having achieved an outcome somewhat similar to what a previous generation of reformers aspired to, are we better or worse off as a result? Is there increased electoral accountability? Is there greater engagement with representative democracy?
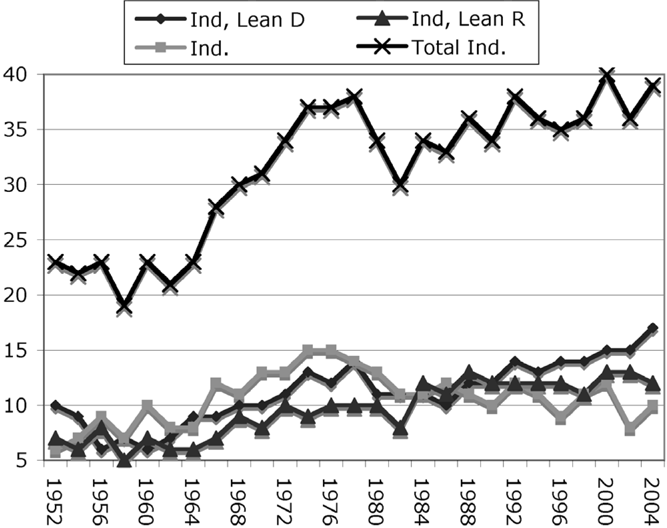
If standard measures of behavior and public attitudes about electoral politics are used to answer this question, the answers might be “no.” As of 2004, cynicism about elections was near (or at) the highest levels recorded in the era of modern American survey research. Attachments to major parties reached a record low in 2000. Consider the data in Figure 3. Although partisanship may now play a stronger role in structuring the votes of people who identify with a party and who continue to vote, fewer people identify with parties today. The 2000 NES measure of partisan affiliation found 40% of Americans self-identifying as independent, the highest level since the survey began in 1952. It is true that most of these independents report “leaning” toward a major party when prompted, and when their vote choices are limited to candidates from the major parties they are, behaviorally, quite similar to partisan identifiers (Keith et al. 1992). But when it comes to their attitudes about the two-party system, independent “leaners” appear more like “pure” independents than partisans. “Leaners” have little regard for maintaining the two-party system, they are more likely to support third-party candidates, and they prefer divided government (Donovan et al. 2005; Bowler et al. 2006). A substantial proportion of Americans fail to identify with a party system that presents increasingly polarized choices. And while barriers to voting have been reduced,5
The Supreme Court has reduced advance registration to 30 days maximum. Motor Voter registration, early voting, and the expansion of no-excuse absentee voting have occurred while turnout remained stagnant.
Turnout by voting-age population (VAP) oscillated below a high point of 55% from 1972 to 2004, after being higher in the 1960s. Michael McDonald demonstrates that as a percent of voting-eligible population (VEP), turnout in 2004 actually approached the higher levels of the 1960s.
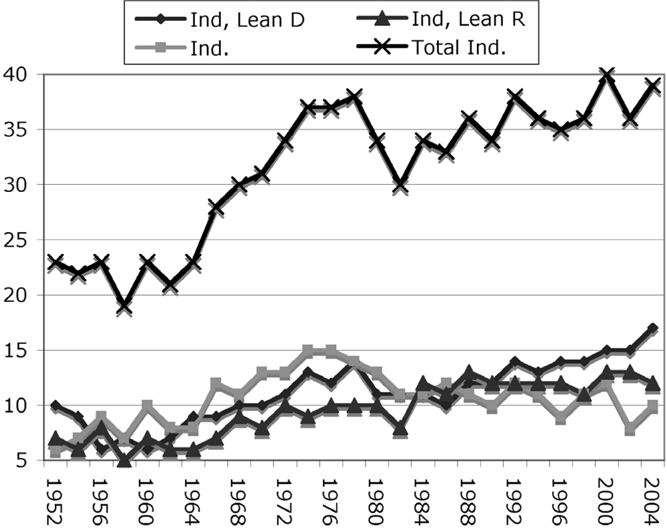
Party Identification; Proportion of Independents, 1952–2004
Source: National Election Study.
Note: The lower three lines plot trends in the percent of NES respondents replying “independent” to the initial three-part measure of party identification, then by their responses to the follow-up question asking if they “lean” toward one of the major parties.
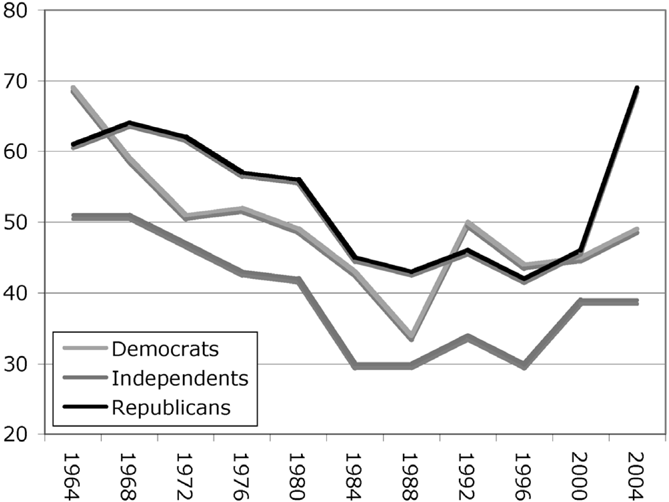
The rise of ideologically cohesive parties has not engaged more citizens nor led them to think their elections provide a mechanism to hold government accountable. Figure 4 illustrates that apart from Republicans in 2004, there is little to suggest that people felt government was more responsive to elections than in previous decades. Using the standard NES measure of “having a say in government,” Figure 5 found 2004 approaching a record low of political efficacy for Americans. Data such as these in Figures 4 and 5 suggest that a malaise about the efficacy of elections and representative democracy has persisted since the 1980s.
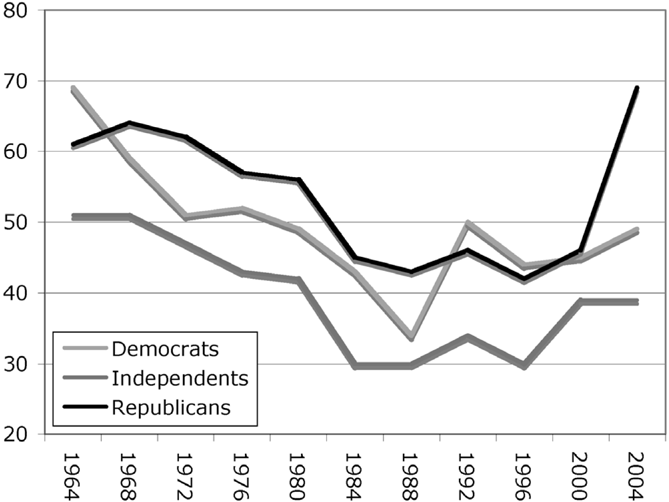
Do Elections Make Government Pay Attention?
Source: National Election Study.
Note: Percent saying “a good deal,” by party identification.
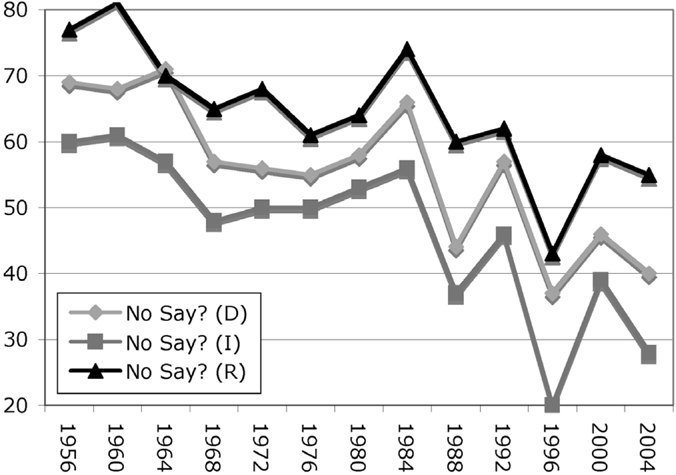
Do You Have a Say in Government?
Source: National Election Study.
Note: Percent who disagree with the statement “most people have no say,” by party identification.
Some suggest that low turnout and cynicism about representative democracy reflect public frustration with the political choices American parties present (Amy 2002). Although it is difficult to establish the causal relationships between elite polarization, apathy toward parties, and cynicism about elections and voter participation, participation is associated with the polarization of American elections. Safe, politically homogeneous legislative seats not only produce representatives farther from a national median voter, but these uncompetitive districts have less campaign activity, which translates into less participation—especially for the young and for people with less interest in politics than partisans (Donovan and Tolbert 2007). Uncompetitive states also correspond with less participation in presidential contests (Bowler and Donovan n.d.).
A Missing Middle
A two-party system dominated by ideologically polarized parties and uncompetitive elections may do little to link a large part of the public with representative democracy. Indeed, trends toward having ideologically distinct parties and less electoral competition correspond with greater cynicism about representative democracy. This cynicism may be exacerbated if (realistically or unrealistically) citizens devalue partisan conflict (Hibbing and Theiss-Morse 2002). If this is the case, then contemporary electoral arrangements may alienate a substantial proportion of the electorate.
Admittedly, the discussion here misrepresents what the 1950s reformers sought. Although there is evidence of greater polarization among party elites and party identifiers, this need not mean we ever achieved a responsible two-party system. The system described in the 1950 report was modeled on the assumption of legislative supremacy or at least legislative parity with the executive. This is a form of government that has been on the wane. Furthermore, one forgotten aspect of the report is that it stressed the need to “give all sections of the country a real voice” in elections,7
This was in reference to presidential elections under the Electoral College.
Even with the one-party South transformed, there are fewer two-party competitive U.S. House contests now than in 1950. The decline in competitive districts and the rise of incumbent advantages were noted decades ago (e.g., Mayhew 1974; Ferejohn 1977), but conditions have become even less competitive since then. Presidential and House elections are now structured such that many people live in places where they have no influence on elections. These voters are not exposed to national election campaigns unless they live in a handful of competitive presidential states such as Ohio, or in a rare, competitive U.S. House district. The U.S. has polarized parties without competitive elections; distinctive parties that offer many voters irrelevant elections between candidates who may be too extreme for them, with only one candidate having a chance to win.
Electoral Polarization, Competition, and Reform
Partisan polarization, then, by morphing with uncompetitive elections, has gone from being part of the preferred solution to what ails the American system, to possibly being a key force driving discontent with representative democracy. By extension it may also be driving interest in election reform. If either the failure to represent the large center of the American electorate or the dearth of meaningful elections (or both) is the source of discontent with representative democracy, then we must consider how various contemporary reformist impulses affect party polarization and electoral competition. At one level, it seems there is some consensus among reform proponents that “something” should be done to restore “faith” in American elections. For example, we might find substantial agreement that rules should insure that only eligible voters vote, and that their votes are counted as accurately as possible. There may be much less consensus about other reform goals, and even less about how these goals should be accomplished. Nonetheless, let us, for the sake of argument, assume we have consensus about some basic goals and that we have knowledge of how to achieve such goals. Assume that every vote cast would be a perfect reflection of what only eligible, participating voters intended. Assume that ethics reforms prevent legislators from accepting free luxury travel and skybox tickets from lobbyists. Assume, further, that voter registration record-keeping was flawless and presented eligible voters no barriers to participating. Assume that poll workers were perfectly trained, every polling place had optimal resources, and early voting was available for every eligible voter. Would, as a result of all of this, the mass public come to participate more, or to see elections as more meaningful? Would it lead more people to perceive that there were elected officials who shared their preferences? Would such reforms increases the public's sense that elections make government pay attention, or their belief that voting and elections give them a say in what government does?
Perhaps—but only as much as attitudes about the efficacy of elections are driven by perceptions of accuracy in registration, fairness in vote counts, problems with butterfly ballots, hanging chads, and the latest revelations about improper behavior by legislators and lobbyists. Downward trends in opinions about electoral efficacy displayed here, however, pre-date the 2000 Florida election fiasco that motivated the Help America Vote Act (HAVA) and also pre-date the Jack Abramoff / Duke Cunningham / Mark Foley / Tom Delay et al. indictments and scandals that motivated the 2006–2007 round of ethics reforms. The most accurate registration records and vote counting systems, furthermore, would likely do little to affect electoral competition nor affect how the major parties and the electoral system represent (or fail to represent) the preferences of marginally interested Americans who think of themselves as centrists or moderates.
HAVA-like reforms are motivated by events that occur in competitive contests (e.g., Florida and Ohio) where high numbers of voters are mobilized by competitive campaigns, where polling places are swamped with voters, and where subtle local administrative acts can have the capacity to affect election results. HAVA has generated substantial funds for research into the minutia of the machinery of elections. HAVA-like administrative reforms may make it more difficult to steal elections, but they fail to address the fact that most elections in most places remain so uncompetitive that they are not worth stealing.
Make Elections Worth Stealing
I suggest above that competition resulting from marginal districts may also affect political polarization. Electoral competition—the mobilization of candidates and campaign resources in an environment where election outcomes are relatively uncertain—is also a force that can mobilize people to participate in politics. Empirical research suggests that people respond to meaningful electoral choices and electoral competition. Competition in U.S. House races increases turnout (Cox and Munger 1989). Multiparty systems have higher voter turnout (Blais and Carty 1990) and higher levels of citizen satisfaction with how democracy works (Anderson and Guillory 1997). Referendums and initiatives bring people to the polls and choices associated with these may stimulate political efficacy (Smith and Tolbert 2004). Local “semi-PR systems” used (rarely) in the U.S. can expand the range of candidates competing for office, and thus increase campaign activity and voter turnout (Bowler et al. 2004).
Efforts to improve poll-worker training, and improve the accuracy of vote tabulation and voter registration rolls are necessary and laudable, but errors associated with voting machines, and the effects of duplicity in election administration are most likely to have consequences where election outcomes are relatively uncertain. Thus, an electoral context where more contests are marginal may increase incentives for fraud. This should be a primary goal for reforms. Electoral competition is greater in marginal seats. It is the mechanism that makes elections more responsive to the distribution of mass preferences, the mechanism that provides accountability, and the mechanism by which citizens are mobilized and engaged by representative democracy.
There are reforms that target forces beyond voter interactions with poll-workers and voting machinery. How might these affect electoral competition? Reducing barriers to candidate entry might provide voters with more choices. Burden's (2007) article in this symposium finds that ballot access rules have clear effects on whether minor-party candidates appear on ballots, but he also finds their candidacies have little effect on election outcomes. Indeed, their vote share is inversely related to the competitiveness of races they enter. In a Single Member Simple Plurality (SMSP) system where such candidates have little chance of representation, they remain a protest vehicle. Barriers to entry may also be reduced via public financing of campaigns. Werner and Mayer's (2007) article in this symposium shows that the public campaign finance options in Maine and Arizona are particularly attractive to candidates in the least competitive races, which may mute the programs' effects on electoral competitiveness. Reducing barriers to voter participation is also promoted as a means to get more citizens engaged with elections. However Gronke et al.'s (2007, this symposium) study of early voting demonstrates that the effects of making voting more convenient are modest. Without increasing mobilization efforts and interest in elections, convenience voting will have limited effects on turnout and the composition of the electorate. By failing to address the structure of electoral competition, even these reforms may have little effect on public engagement with representative democracy.
Changes in districting practices, then, may offer the greatest prospect for increasing electoral competition. Districting practices in Arizona and Iowa have been held as models for better practices. McDonald (2007) shows in his contribution to this symposium that few states use such outcome-based districting practices that emphasize competition, and that enforcement of competition criteria relies on state, rather than federal courts. If uncompetitive elections are mainly the product of a “natural” pattern of like partisans locating in similar places (rather than gerrymanders), even the most non-partisan, independent SMSP districting plans may be unable to affect electoral competition. Yet among the many reforms to attract attention from political science this decade, those targeting districting practices and district magnitude are the most explicit in aiming to alter the structure of elections to increase electoral competition.
The argument about electoral reforms here may be understood in terms of a baseball analogy. Administrative reforms are analogous to perfecting how balls, strikes, and base-running are called in a baseball game. Accurate calls are critical, but they are not likely to fill the stands with fans. People watch a game to see their team win, or because of interest in an important game. Perfect scoring is meaningless if only one team takes the field, and attendance will suffer if two teams are playing that no one can cheer for.