Introduction
Molecular design strategies have enabled the synthesis of polymers with functionalities that render them useful for diverse thin-film applications. Notable examples include organic solar cells, thermoelectrics, organic light-emitting diodes, energy storage devices, as well as active and passive coatings. The materials used in these applications include homopolymers, copolymers, polymer/polymer mixtures, and polymer nanocomposites (nanoparticles of varying functionalities incorporated within polymer hosts). While the possibilities for literally “tailoring” the functional properties of polymeric materials through the processing of different combinations of polymers, and in some cases nanoparticles, appear to be virtually limitless, the technical challenges are important. Collective entropic and enthalpic interactions over varying length-scales lead to unusual and often complicated morphological structures. Moreover, long-term reliability issues often pose additional difficulties for some applications. In general, understanding and optimizing the synthesis–processing–property–function–reliability of polymer-based material systems, while offering enormous technological opportunities, pose important scientific challenges.
An important goal of this Prospective is to describe the manner in which physical properties of polymers confined to nanoscale thickness dimensions differ from the bulk.[Reference Keddie, Jones and Cory1–Reference Kanaya and Kanaya7] Examples of thickness dependent physical properties of polymers include the following. Perhaps one of the best-known example of this phenomenon is the thickness, h, dependence of the average glass-transition temperature, T g, of a sufficiently thin homopolymer film, as revealed by experiment, theory, and simulations.[Reference Keddie, Jones and Cory1–Reference Forrest and Dalnoki-Veress3, Reference Alcoutlabi and Mckenna6–Reference Mittal, Shah and Truskett12] The thickness dependence of T g is exhibited by thin films typically in the thickness range of nanometers to tens of nanometers, stemming from interfacial effects. Other examples of thickness-dependent properties include the mechanical properties of thin polymer films,[Reference Stafford, Harrison, Beers, Karim, Amis, Vanlandingham, Kim, Volksen, Miller and Simonyi13, Reference O'connell, Hutcheson and Mckenna14] gas permeation in thin films,[Reference Mccaig and Paul15, Reference Mccaig, Paul and Barlow16] and the mobility of charge carriers in polymers.[Reference Huang, Glynos, Frieberg, Yang and Green17–Reference Dong, Huang, Tan and Green19] The h-dependencies of these properties typically occur over much longer length-scales, in some cases a few hundred nanometers, than those of the glass transition. In the case of polymer-A/polymer-B mixtures, in contrast to metallic alloys and small molecule mixtures, phase separation temperatures may differ from the bulk by tens of degrees and the length-scales may be as long as hundreds of nanometers.[Reference Bank, Thies and Leffingw20–Reference Dudowicz and Freed24] This is in part due to entropic effects, associated with the fact that the A and B constituents are long chains; each chain is composed of hundreds or thousands of monomers connected by covalent bonds. For the final example, we note that shifts of phase separation temperatures (i.e., so-called order–disorder transitions) are also documented for diblock copolymer thin films supported by substrates.[Reference Coulon, Russell, Deline and Green25–Reference Menelle, Russell, Anastasiadis, Satija and Majkrzak27] Therefore the length-scales over which this h-dependent phenomenon occurs depend on the specific property, the polymer, and on the polymer/external interface system.
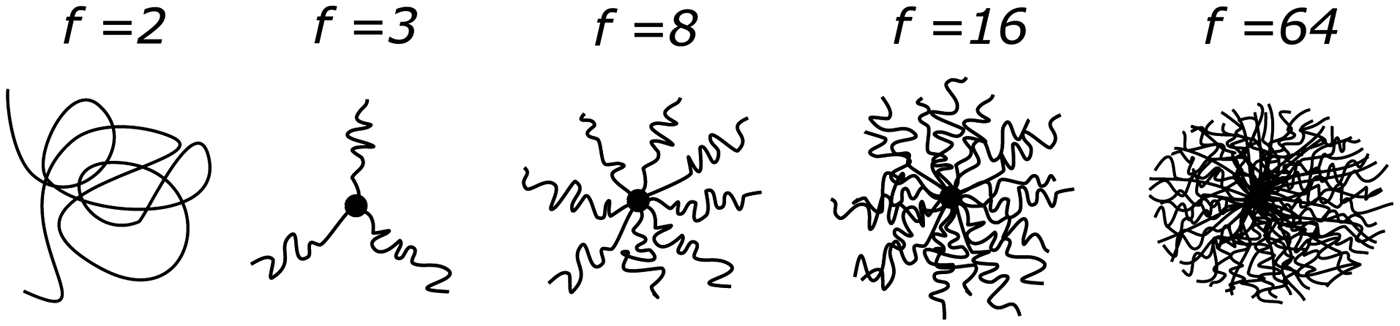
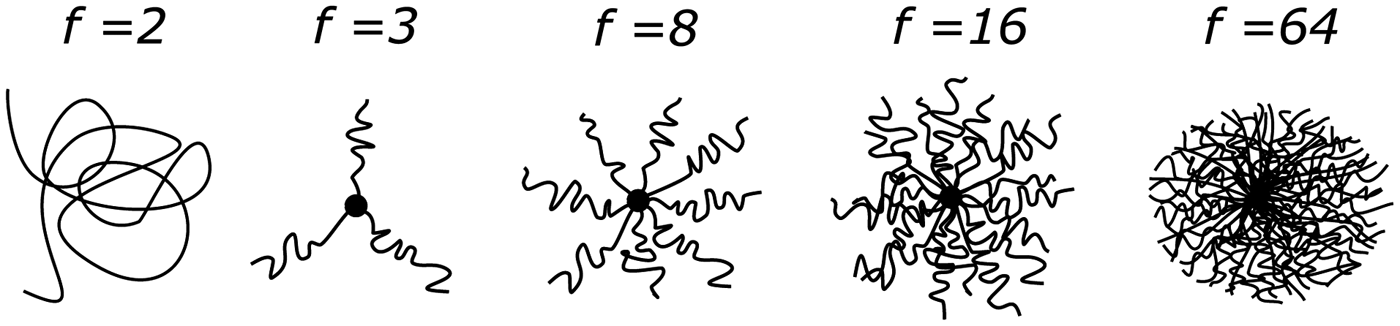
Much of what we understand about the effects of film thickness confinement on the physical properties of polymers is based on studies of linear chain macromolecules, comparatively little is understood about confinement effects the physical properties of macromolecules of different architectures, such as star-shaped macromolecules. It has been demonstrated that for star-shaped polymers the physical properties, such as wetting,[Reference Glynos, Chremos, Frieberg, Sakellariou and Green28, Reference Glynos, Frieberg and Green29] thin-film glass-transition temperatures,[Reference Glynos, Frieberg, Oh, Liu, Gidley and Green30, Reference Glynos, Frieberg, Chremos, Sakellariou, Gidley and Green31] and physical aging,[Reference Frieberg, Glynos and Green32, Reference Frieberg, Glynos, Sakellariou and Green33] differ appreciably from those of linear chain polymers. Wang et al. have demonstrated, using x-ray photon correlation spectroscopy, that in contrast to linear-chain thin-film polymers the surface viscosities of branched macromolecules are larger than the bulk.[Reference Wang, Jiang, Narayanan and Foster34, Reference Wang, Yang, Lee, Akgun, Wu and Foster35] Other studies provide more general insights into how changes in the structure of star-shaped polymers, achieved by varying the functionality, f (number of arms per molecule), and the molecular mass per arm M arm (see Fig. 1), may influence certain physical properties, such as the bulk rheological behavior.[Reference Vlassopoulos, Fytas and Cloitre36–Reference Pearson and Helfand38]
The architectures of a linear chain and of the star-shaped macromolecules of different functionalities (number of arms per molecule) are shown here. The number of monomers per arm is N arm. (N arm = M arm/M 0, where M 0 is the molecular weight per monomer, and M arm is the molecular weight per arm.)
This Prospective discusses fundamental questions related to the structure–property behavior and potential applications of star-shaped polymer films in the nanoscale thickness range. Our discussion will focus on differences between the structures of linear-chain and star-shaped macromolecular thin films and related implications for three important physical properties: glass transition, wetting, and physical aging.
Effect of geometric confinement on the structure of polymers
The adsorption of a polymer chain onto a surface is driven by the competition between enthalpic and entropic interactions: the gain in enthalpy due to the binding of monomers from the chain onto the surface and the associated conformational entropic cost associated with this adsorption.[Reference Degennes and Pincus39, Reference Rubinstein and Colby40] As a result, the “packing” of segments of chains is not spatially uniform throughout a polymer film. At a hard, atomically smooth substrate, the average monomer density is higher than in the bulk; simulations reveal that the amplitude of the monomer density profile oscillates away from the substrate, with the amplitude decreasing gradually into its bulk value.[Reference Yoon, Vacatello and Smith41–Reference Daoulas, Harmandaris and Mavrantzas44] Such simulations further suggest a “layering” of the segments at the substrate, including the center of mass of the chain. Specifically, the component of the radius of gyration of a chain parallel to the wall, 〈R xy〉, is larger than 〈R z〉, that of the radius of gyration component normal to the wall.
At an unconstrained or free surface, simulations of linear-chain polymers reveal that the local segmental “packing” is lower than the bulk.[Reference Daoulas, Harmandaris and Mavrantzas44–Reference Mansfield and Theodorou46] Experimental studies using positron annihilation lifetime spectroscopy (PALS) reveal the presence of increased free volume at the free surface in relation to the bulk.[Reference Glynos, Frieberg, Oh, Liu, Gidley and Green30, Reference Glynos, Frieberg, Chremos, Sakellariou, Gidley and Green31] This is experimental evidence that supports the premise that the chain segments near a free surface possess larger configurational freedom than the bulk. Simulations also show that the sharpness, or breadth, of this interface increases with decreasing temperature.[Reference Daoulas, Harmandaris and Mavrantzas44–Reference Mansfield and Theodorou46] In typical polymer systems, the length scales of the breadth of such an interface are of the order of nanometers. To this end, we schematically illustrate in Fig. 2 the local packing density of a supported polymer film, confined between a free surface and a hard interface. In this figure, the overall film thickness is h; h f is the length-scale from the free surface where there would be increased configurational freedom. The length-scale δ, of the order of a nanometer, is the thickness from the substrate where the chain segment orientations are restricted and there is a preferential orientation of the segments in the plane of the film. The distance h s + δ is the length-scale (~ few nanometers) over which the density of the film is perturbed due to the substrate. In addition to changes in the density at an interface, the average molecular weight between entanglements near an interface differs from the bulk and this can have important implications on mechanical properties, including interfacial adhesion and fracture.[Reference Sussman, Tung, Winey, Schweizer and Riggleman47] Other physical properties, such as the time-dependent displacements of chain segments in thin films, would differ from the bulk[Reference Ye, Wiener, Tyagi, Uhrig, Orski, Soles, Vogt and Simmons48–Reference Soles, Douglas and Wu50]
Schematic illustrates variations in the local density of the segmental “packing” at distances away from the interfaces.

Generally polymer segmental dynamics at polymer/substrate interfaces are comparatively slow;[Reference Soles, Douglas and Wu50–Reference Soles, Douglas, Wu, Peng and Gidley53] this sluggishness is believed to be due to the long time-scales (compared with bulk relaxations) associated with adsorption/desorption of segments from the “walls.”[Reference Yelash, Virnau, Binder and Paul54] Stronger interactions with the walls lead to longer desorption times, thereby leaving the molecules in a metastable state, and hence slower dynamics. In fact, broad band dielectric spectroscopy (BDS) studies reveal a reduction of the dielectric strength (Δε) indicating a portion of the film is “dead” when the chains are permanently adsorbed onto a substrate and the dipoles unable to reorient.[Reference Napolitano and Wubbenhorst52] This effect, permanently adsorbed chain segments, is polymer/substrate specific and typically occurs after heating the film for sufficiently long periods of time. Simulations reveal that the dynamics at “walls” are anisotropic; the dynamics of the segments normal and parallel to the substrate differ in magnitude.[Reference Peter, Meyer and Baschnagel55, Reference Hanakata, Douglas and Starr56]
With regard to free, unconstrained, surfaces it has been demonstrated by experiments and by simulations that the polymer chain dynamics are fast relative to the bulk.[Reference Keddie, Jones and Cory1–Reference Long and Lequeux10, Reference Chai, Salez, Mcgraw, Benzaquen, Dalnoki-Veress, Raphaël and Forrest57–Reference Torres, Nealey and De Pablo64] The dynamics near the free surface are enhanced due to excess configurational freedom of the chain segments. The excess configurational freedom would be responsible for a reduction of the effective friction coefficients, which dictate the time scales of the center-of-mass diffusion of chains near a surface, leading to an increase in translational diffusion coefficient of a chain.[Reference Lange, Judeinstein, Franz, Hartmann-Azanza, Ok, Steinhart and Saalwächter65] Later it will be shown that changes in physical properties of polymers occur over much longer length-scales than the length scales that characterize changes in their segmental densities at interfaces.
Wetting of star-shaped macromolecules
Differences between the wetting properties of star-shaped macromolecules and their linear-chain analogs are profound. To understand these differences it is instructive to recall basic ideas about the wetting of a non-volatile liquid droplet on a substrate.[Reference Bonn, Eggers, Indekeu, Meunier and Rolley66–Reference Young70] The wetting of a liquid on a substrate is dictated by a combination of short- and long-range intermolecular forces: within a specific distance of the line of contact the shape of the droplet is distorted by the intermolecular forces. The molecular length associated with the long-range van der Waals interactions is defined as:
 $$\alpha = \sqrt { - A/G\pi \gamma}, $$
where A is the Hamaker constant, and γ the liquid/vapor surface tension of the liquid. The macroscopic angle of contact θ eq, defined away from the line of contact, is dictated by Young's equation, which relates it with interfacial energies:
 $$\gamma \cos {\theta _{{\rm eq}}} = {\gamma _{{\rm SV}}} - {\gamma _{{\rm SL}}},$$
where γ SV is the surface tension, and γ SL is the interfacial tension between the liquid and the substrate.
Recently we showed that the macroscopic contact angle θ eq for an 8-arm star-shaped polystyrene (PS) macromolecule on silicon oxide substrates (SiOx) is approximately one order of magnitude smaller than linear-chain PS on the same substrate.[Reference Glynos, Chremos, Frieberg, Sakellariou and Green28, Reference Glynos, Frieberg and Green29] The adsorption of a macromolecular segment onto a substrate is largely dictated by a competition between the gain of enthalpy due to binding monomers to the substrate, and the conformational entropic cost of adsorption. The enhanced wetting of the star-shaped macromolecules is associated with the fact that these branched polymeric molecules experience smaller losses in configurational entropy when adsorbed to interfaces compared with their linear analogs.[Reference Striolo and Prausnitz71–Reference Chremos, Camp, Glynos and Koutsos75] These smaller losses of configurational entropy of the star-shaped macromolecules, in relation to their linear chain analogs of the same total number of monomers, may be considered to be an entropic attraction of the star-shaped molecules to the substrate.
The data in Fig. 3 describe the fascinating wetting characteristics of the star-shaped macromolecules.[Reference Glynos, Chremos, Frieberg, Sakellariou and Green28] The error bars this figure represent were determined from measurements of the contact angles of tens of droplets. It is shown that the macroscopic contact angle rapidly decreases with increasing functionality of the star, before exhibiting a minimum at f = 16. For f > 16, θ eq increases with f until it becomes nearly constant in the high functionality limit. The values are smaller than that of linear chains.
Equilibrium contact angles, θ eq, are plotted as a function of f. Reproduced (adapted) with permission from Ref. Reference Glynos, Chremos, Frieberg, Sakellariou and Green28, copyright 2014 American Chemical Society.
The wetting behavior of star-shaped molecules in relation to their linear-chain analogs may not be fully understood in terms of the surface tension of the molecules; effects associated with the entropic attraction must be considered. The surface tension for star-shaped polymers is reasonably well described by:
 $${\gamma ^{\hskip1.5pt\rm s}}({M_{\rm n}}) = {\gamma ^{\hskip1.5pt\rm s}}(\infty ) + \rho RT\displaystyle{{\,f{\hskip-0.9pt{U}^{\rm e}} + {U^{\rm b}}} \over {M_{\rm n}^{\rm s}}}, $$
where γ(∞) is the surface tension of the theoretical infinite number average molecular mass polymer, ρ is the bulk density, R is the universal gas constant, T is the temperature, M n is the number average molecular mass, and U e and U b represent the effective attractive, or repulsive, interactions between the interface and the chain ends, and branch points, respectively.[Reference Minnikanti and Archer72, Reference Qian, Minnikanti, Sauer, Dee and Archer73] Because this relationship predicts a monotonic decrease of the surface tension with increasing functionality, the non-monotonic behavior of θ eq cannot be explained solely in terms of changes in the surface tension. As discussed below, the wetting properties of star-shaped polymers stem primarily from the strong surface adsorption behavior in relation to linear chains of otherwise identical chemical structure.
Molecular dynamics (MD) simulations of a bead-spring model of polymer chains show that the ratio of the perpendicular and parallel components of the radii of gyration, 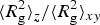 ${\langle R_{\rm g}^2 \rangle _z}/{\langle R_{\rm g}^2 \rangle _{xy}}$, of macromolecules adsorbed to an interface depends on the functionality of the polymer [Fig. 4(a)].[Reference Glynos, Chremos, Frieberg, Sakellariou and Green28] These MD simulations indicate that
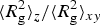 ${\langle R_{\rm g}^2 \rangle _z}/{\langle R_{\rm g}^2 \rangle _{xy}}$ increases with increasing f, but exhibits a maximum for f ≈ 8. Beyond this maximum, f > 8, the ratio decreases and reaches a constant value in the high f limit. The densities of adsorbed chains, ρ ads (the number of adsorbed chains per unit area), extracted from the MD simulations and experimental measurements are plotted in Fig. 4(b). These data indicate that dependence of ρ ads on f is consistent with the
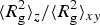 ${\langle R_{\rm g}^2 \rangle _z}/{\langle R_{\rm g}^2 \rangle _{xy}}$ [Fig. 4(a)] versus f trends.
(a) The ratio of the parallel and perpendicular components of the mean-square radii of gyration 〈R g2〉z/〈R g2〉xy of the adsorbed polymers is plotted as a function of ƒ. Reproduced (adapted) with permission from Ref. Reference Glynos, Chremos, Frieberg, Sakellariou and Green28, copyright 2014 American Chemical Society. (b) The number of adsorbed chains per unit area (density), ρ ads, is shown as a function of ƒ, obtained from the experiment and from the simulations. Reproduced (adapted) with permission from Ref. Reference Glynos, Chremos, Frieberg, Sakellariou and Green28, copyright 2014 American Chemical Society.
The maxima of the anisotropy of orientation of the molecules and of the density [data in Figs. 4(a) and 4(b)] are due to the same two competing mechanisms. The entropic attraction of a star-shaped molecule to the substrate increases as the functionality ƒ of the molecule increases. Additionally with this increase of ƒ, entropic intermolecular repulsions between the arms of a molecule extending from the branch point necessarily increases; this leads to stretching of the arms (i.e., a reduction of the entropy per chain). This intermolecular repulsion has the effect of reducing any potential “crowding” of the molecules at a surface. In other words, the entropic restrictions imposed by increasing f lead to a decreasing compliance of the star-shaped polymers, which suppresses their ability to deform on the surface when adsorbed. Hence, the angle of contact decreases.
This is the first time that such significant differences in the wetting behavior are achieved by simply changing the architecture of the molecule, without changing the chemistry. The practical implications are that the wetting at an interface may be “tailored” via changes in the functionality and the length of the arms of the macromolecule.
Glass transition of thin films
This topic is introduced by recalling that the reduction of the temperature of substances, from small molecule liquids to network glass melts and polymer melts, is accompanied by a significant increase in the structural relaxation time. Practically, at a sufficiently low temperature where the structural relaxation time becomes longer than the observation time, or duration, that the cooling rate permits, the system becomes “frozen,” this temperature denotes the glass transition. Additionally virtually any substance, if cooled at a sufficiently rapid rate, would not crystallize due to a lack of time for the constituents to form an ordered structure. It is important to note that by virtue of their molecular structures, atactic polymers for example, will not crystallize and therefore exhibits a T g, regardless of cooling rate. Glass-forming melts solidify, with the absence the formation of long-range order, at a lower temperature than the crystallization temperature. The glass-transition temperature, T g, occurs over a very narrow range of temperatures and is cooling-rate dependent. With these brief comments, we discuss this phenomenon with regard to the behavior of thin polymer films.
It is a known fact that the average glass-transition temperature of a sufficiently thin polymer film differs from the bulk.[Reference Baschnagel and Varnik8, Reference Pye and Roth63, Reference Forrest, Dalnokiveress and Dutcher76–Reference Ediger and Forrest79] This effect is often observed when the polymer film is of the order of tens of nanometers, whether or not it is supported by a substrate. In the case of freely standing linear-chain polymer films, the average T g decreases with decreasing h. When the polymer films are supported by non-wetting surfaces, such as linear-chain PS supported by SiOx, the average T g decreases with decreasing h (see Fig. 5).[Reference Keddie, Jones and Cory2, Reference Kawana and Jones80] However, when the interactions between the polymer and the substrate are sufficiently strong (i.e., polar interactions), the average T g increases with decreasing h. Two examples of this are poly(methyl methacrylate) (PMMA) films supported by SiOx and PS supported by gold substrates.[Reference Keddie, Jones and Cory1, Reference Priestley, Mundra, Barnett, Broadbelt and Torkelson81–Reference Pham and Green84] The important point is that the average glass-transition temperature of a thin polymer film is influenced by the polymer and by the nature of the interactions between the polymer segments and the external interfaces, as further discussed below.
(a) T g, plotted as a function of depth, for linear-chain PS and for star-shaped PS (f = 8, M arm = 10 and 25 kg/mol.); these data were obtained using depth-profile PALS. Reproduced (adapted) with permission from Ref. Reference Frieberg, Glynos and Green32, copyright 2012 American Physical Society and Ref. Reference Glynos, Frieberg, Oh, Liu, Gidley and Green30, copyright 2011 American Physical Society. (b) The relative length scales of the effects of the monomer density profiles and of the T g are depicted here.
It has been suggested that due to the lower segmental configurational freedom of chains at a free surface, the T g at the free surface would be lower than the bulk.[Reference De Gennes58] Experiments show that polymer segments, within a distance of a few nanometers of the free surface, remain mobile at temperatures below the bulk T g.[Reference Chai, Salez, Mcgraw, Benzaquen, Dalnoki-Veress, Raphaël and Forrest57, Reference Ediger and Forrest59–Reference Paeng, Swallen and Ediger62, Reference Forrest85] Commensurate with this observation, depth-profile PALS measurements demonstrate that the glass-transition temperature at the free surface of linear polystyrene is lower than the bulk; these data are shown in Fig. 5(a) (squares).[Reference Glynos, Frieberg, Oh, Liu, Gidley and Green30, Reference Frieberg, Glynos and Green32] The T g becomes equal to the bulk at a distance of tens of nanometers into the film. Other experiments also lead to conclusions that the T g across the film is not uniform.[Reference Yang, Fujii, Lee, Lam and Tsui4, Reference Ellison and Torkelson60] For the case of PS/SiOx where the interactions between the PS chain segments and SiOx are non-wetting, and the T g at the free surface is lower than the bulk, the average T gs of such PS films are lower than the bulk value. Generally, when the T g at the free surface is lower than the bulk and the polymer/substrate interactions are sufficiently weak, the average T gS of sufficiently thin polymer films are lower than the bulk. However, if the polymer substrate interactions are sufficiently strong (e.g., hydrogen bonding), and responsible for an enhancement of the local T g at the substrate, then the average T g of a sufficiently thin film may be larger than the bulk value. The PS/Au and PMMA/SiOx systems are excellent examples.
It is important to recognize that the length-scale ξ ρ over which the “packing” of segments is influenced by the proximity to the interface is of the order of a nanometer.[Reference Baschnagel and Varnik8, Reference Torres, Nealey and De Pablo64, Reference Shavit and Riggleman86] However, the length-scale ξ glass over which the glass-transition temperature deviates from the bulk is at least one order of magnitude larger (Fig. 5). This behavior has not been fully captured using simulations. However, a recent analytical theory provided the first explanation for the differences between the length-scales associated with segmental packing and those longer distances associated with changes in the glass transition.[Reference Mirigian and Schweizer87] The displacements of polymer segments are associated with long-range collective elastic distortion processes, occurring over tens of nanometers. Near a surface the effects are different from the bulk due to the “reduced neighbors” and subtle differences in the “packing” of segments. For this reason, the near surface and the bulk vitrification temperatures, and their associated length scales, are different.
(a)The glass-transition temperatures are plotted as a function of film thickness for linear-chain PS, supported by SiOx, and for star-shaped PS molecules of varying functionalities. The molecular mass per arm of each macromolecule is ≈10 kg/mol. Reproduced (adapted) with permission, from Ref. Reference Glynos, Frieberg, Chremos, Sakellariou, Gidley and Green31, copyright 2015 American Chemical Society, and Ref. Reference Glynos, Frieberg, Oh, Liu, Gidley and Green30, copyright 2011 American Physical Society. (b) The deviation of T g from the bulk for a h = 30 nm thick PS film on SiOx as a function of the number of arms. Reproduced with permission (Ref. Reference Glynos, Frieberg, Chremos, Sakellariou, Gidley and Green31), copyright 2015 American Chemical Society.
Since the star-shaped macromolecules experience lower entropic penalties than their linear-chain analogs when adsorbed at an interface, it would be reasonable that their thin-film glass-transition temperatures would differ from linear chains, as suggested by the data in Fig. 5(a).[Reference Glynos, Chremos, Frieberg, Sakellariou and Green28, Reference Glynos, Frieberg and Green29, Reference Striolo and Prausnitz71–Reference Chremos, Camp, Glynos and Koutsos75] To this end the h-dependencies of the average T gs of several different star-shaped PS thin films supported by SiOx substrates are reported in Fig. 6. In this figure, M arm was fixed and the functionalities are varied, 3 < f < 64. For cases where f = 2, 3, and 4 the average T gs decrease with decreasing h. This behavior is similar to linear-chain PS, where T g decreases with decreasing h.[Reference Glynos, Frieberg, Oh, Liu, Gidley and Green30] However, for molecules possessing functionalities in the range 4 < f < 32, the average T gs increase with decreasing h. This remarkable shift in the trend, based on the functionality, exhibited by vitrification of the films is more clearly illustrated in Fig. 6(b). In this figure, the T gs of different h = 30 nm thick films of molecules of varying f relative to the bulk T gs are plotted. It is apparent that the T g behavior of the star-shaped polymers is similar to that of linear chains when the arms are sufficiently long (M arm is sufficiently high); here the effect of the functionality is not important.[Reference Glynos, Frieberg, Oh, Liu, Gidley and Green30] Simulations reveal an enhancement of the segmental densities of short-arm star-shaped molecules at the external interfaces, in relation to the bulk. The enhancement at the free interface is less pronounced than at the substrate, which is not unexpected. These results provide a rationale for the shifting trends of the T g versus h behavior.
We now discuss the increase of the T g with decreasing h, for f > 4. PALS measurements show that the free surface T g for the 8-arm star-shaped films is higher than the bulk (Fig. 5). Our MD simulations reveal that at the free surface, the packing density of the 8-arm star-shaped macromolecules is higher than the bulk. Additionally, a strong positional correlation between the star-shaped molecules (spatial ordering of the cores) near the free surface occurs.[Reference Glynos, Frieberg, Chremos, Sakellariou, Gidley and Green31] As described in the previous section, the star-shaped molecules in this regime exhibit a stronger tendency to adsorb to the substrate. This results in a higher packing density and thus a larger local T g at the substrate interface. Because the T gs at the free surface and at the substrate are larger than the bulk for the 8-arm star with M arm = 10 kg/mol., the average T g of this system increases with the decreasing film thickness [Fig. 6(a)].[Reference Glynos, Frieberg, Oh, Liu, Gidley and Green30] When arms are sufficiently long, M arm > 25 kg/mol., the thickness-dependent T g behavior is virtually identical to that of linear-chain PS. These results confirm the notion that the thickness dependence of the T g may be understood in terms of the interactions between the polymer segments with its external interfaces. The interactions are enhanced due to the entropic attraction of the chains to the interfaces with increasing f. As described in the previous section this enhanced entropic attraction is offset by an entropic effect associated with crowding, and an associated loss of mechanical compliance, of the molecules as f further increases. This behavior is largely responsible for the maximum in Fig. 6.
The glass transition of star-shaped PS polymer films on SiOx may be summarized in terms of a “Diagram of States” where the deviation of T g from the bulk is illustrated as a function of f and M arm in Fig. 7. When the number of arms is sufficiently large and the arms are sufficiently short, the star-shaped molecules “pack” like soft-colloids; the average glass transition temperatures of these films are equal to that of the bulk. It has also been reported in that bulk star-shaped molecules with high f and low M arm exhibit behavior akin to that of soft-colloids.[Reference Vlassopoulos, Fytas and Cloitre36–Reference Pearson and Helfand38] In this regime the molecules self-assemble to form ordered structures and uniform ordered layers across the film. This is illustrated in Fig. 8 with an atomic force microscopy (AFM) image, line-scan and schematic. This organization is consistent with the simulations, which suggest evidence of ordering of the cores of the molecules at the interfaces, for the molecules with large f.
The relative glass-transition temperature, ΔT g = T g(h = 30 nm) – T g (bulk), is shown here for star-shaped polymers of varying functionalities and arm lengths. Gray region (black squares) represents ΔT g < 0, blue region (blue triangles) represents ΔT g > 0, and the red region (red circles) represents ΔT g = 0. Reproduced with permission from Ref. Reference Glynos, Frieberg, Chremos, Sakellariou, Gidley and Green31, copyright 2015 American Chemical Society.
An AFM image of a thin-film star-shaped macromolecule of functionality f = 64 (and M arm ~ 9 kg/mol.) is shown. The thickness of each layer is represented by the line scan; a schematic representation of the organization of two layers of molecules is shown.
The decreased compressibility of the polymers, with increasing f and decreasing M arm would have the effect of suppressing the influence of the interface on wetting and adsorption, and therefore changes in the glass transition as shown. In the “linear-chain” region of Fig. 7, the average T g of thin films is lower than the bulk. The transition between the linear-chain region and the soft colloidal-like behavior occurs over limited values of f and M arm. This is this region that represents the maximum in Fig. 6(b).
The primary message of this section is that the average T g of a thin polymer film is dependent on the thickness of the film, the macromolecular architecture and the external interfaces. These data in Fig. 7 illustrate the fact that the glass-transition temperatures of films may be “tailored” simply by changing the macromolecular architecture. The glass-transition temperature is not constant throughout the film; it is a function of the proximity to an interface. Secondly, the architecture of the molecule and the interactions between the molecule and the interfaces have a significant impact on the magnitude of the local T g and hence the average T g of the film. The primary implication of these results is that when a thin film is cooled to lower temperatures, different regions within the thin film, based on their proximities to the interfaces, fall out of equilibrium at different temperatures. This has important implications on processing and on properties such as physical aging, which we discuss in the next section.
Physical aging of thin films
The term physical aging refers to a system undergoing slow dynamics as the system approaches equilibrium, due to frustration associated with transitions between the metastable states (configurations).[Reference Struik88] This phenomenon is ubiquitous, occurring in diverse systems: network glasses (i.e., SiO2),[Reference Zhao, Simon and Mckenna89] spin glasses,[Reference Bouchaud90] colloids,[Reference Bouchaud90] metallic glass,[Reference Wang91] and polymer glasses.[Reference Struik88] To understand this phenomenon in polymers we begin by recalling that as the temperature of a glass-forming liquid is decreased, the structural relaxation time, and the viscosity, increases in a non-linear manner. The temperature dependence of the viscosity is well described by the Vogel–Fulcher–Tammann (VFT)[Reference Fulcher92–Reference Vogel94] equation [also equivalently the Williams–Landel–Ferry equation (WLF)]:[Reference Williams, Landel and Ferry95]
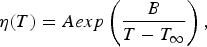 $$\eta (T) = Aexp\left( {\displaystyle{B \over {T - {T_\infty}}}} \right),$$
where T ∞ is the Vogel temperature, which is related to T g, and B is a parameter associated with thermally activated processes. Adam and Gibbs, in 1965, were the first to propose the existence of cooperativity between the dynamics of the constituents of the material and the effect of cooperativity on the overall dynamics. Specifically, there exists a length-scale, ξ coop, which characterizes a distance over which the dynamics are highly cooperative. They, and now others, argue that it is the increase of ξ coop with decreasing T that is responsible for the increase in the activation energy and hence the non-linear increase of time scales of the relaxation dynamics, with decreasing T.[Reference Adam and Gibbs96]
It is currently understood that the dynamics of liquids are spatially and temporally heterogeneous.[Reference Ediger97] Specifially, the dynamics of local regions (size ~ nm at high T) vary spatially; in some local regions the dynamics are very fast compared with the average and for others the dynamics are slow compared with the average. The positions of these local regions are correlated temporally in space over particular length-scales ξ het of the order of nanometers.[Reference Long and Lequeux10, Reference Adam and Gibbs96–Reference Starr, Douglas and Sastry99] It is suggested by dynamic heterogeneity models that density fluctuations throughout the system are responsible for the strong spatial variations of the dynamics. It is the percolation of the slow domains that is responsible for the glass transition, below which the system becomes a glass.
When a substance rapidly cooled into the temperature regime T < T g, the physical properties of the material become time-dependent in this non-ergodic state, as the system attempts to reach equilibrium.[Reference Priestley, Ellison, Broadbelt and Torkelson5, Reference Struik88, Reference Hutchinson100–Reference Mckenna103] Time-dependent properties include: enthalpy, entropy, the compliance, gas permeability/selectivity, density, index of refraction, and dielectric susceptibility. In polymers, the physical aging process is characterized by three regimes: an initial plateau, an intermediate time-dependent stage, and an equilibrium plateau. The aging rate:[Reference Baker, Rittigstein, Torkelson and Roth104]
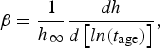 $$\beta = \displaystyle{1 \over{{h_\infty}}} \displaystyle{{dh} \over {d\left[ {ln({t_{{\rm age}}})}\right]}},$$
is obtained from the slope of the lines shown in Fig. 8(a).[Reference Frieberg, Glynos, Sakellariou and Green33] The data shown in this figure represent the intermediate, time-dependent, aging stage. It is well established that the aging rate is determined by the difference between the glass-transition temperature of the material T g and the aging temperature T age: T g–T age = ΔT a.[Reference Hutchinson100–Reference Mckenna103] For small values of ΔT a the aging rate is fast and increases with increasing ΔT a; however, the aging rate reaches a maximum and then decreases with increasing ΔT a. This maximum is the result of two competing processes: the driving force for aging increases with decreasing ΔT a, but the thermal energy decreases as T decreases. Experimentally, the time scale associated with achieving equilibrium could range from minutes to decades. In our case, we investigated the time dependent changes in the film thickness of a supported polymer film after it is quenched to a temperature T age.
The aging rates of star-shaped and linear-chain polymers differ: whereas the aging rate of linear-chain polymers is independent of the length of the chain,[Reference Hutchinson100–Reference Mckenna103] the rates of star-shaped polymers depend on the functionalities and on the arm lengths of the polymers.[Reference Frieberg, Glynos and Green32, Reference Frieberg, Glynos, Sakellariou and Green33] It is shown in Fig. 9(a) that as the functionality of the star is increased the aging rate decreases at a constant temperature relative to T g.[Reference Frieberg, Glynos, Sakellariou and Green33] However, when M arm is sufficiently large the star-shaped polymers exhibit an aging rate similar to linear-chain PS [Fig. 9(b)].[Reference Frieberg, Glynos, Sakellariou and Green33] It should be intuitive, therefore, that as the length of the arms is increased, or the number of arms is decreased, the reduction of the aging rate associated with the branching point is suppressed.
(a) The time-dependent change in film thickness for h = 1000 nm thick films of three different PSs: linear-chain and star-shaped (f = 8, 16). Reproduced (adapted) with permission from Ref. Reference Frieberg, Glynos, Sakellariou and Green33, copyright 2012 American Chemical Society. (b) The physical aging rate is plotted as a function of f and M arm at a temperature which is 35 °C below the T g for the h = 1000 nm thick films. The black squares represent linear PS, the red circles represent 8-arm star PS and green triangles represent 16 arm star PS. Reproduced (adapted) with permission from Ref. Reference Frieberg, Glynos, Sakellariou and Green33, copyright 2012 American Chemical Society.
It has been noted that the glass-transition temperature of a thin film is not a constant value, but varies as a function of distance from an interface. With regard to aging, the local aging rates of a film are dictated by the local T gs throughout the depth of the film. This is illustrated in Figs. 10(a) and 10(b), where it is shown how the aging rate changes across thin films of linear-chain PS [Fig. 10(a)].[Reference Frieberg, Glynos and Green32] MD simulations of the aging of freely standing linear-chain polymer films yield similar results; the aging rate is lowest near the free surface and increases with increasing distance, reaching a maximum, in the interior of the film.[Reference Shavit and Riggleman105] Note that in Fig. 10(a), the film is supported and T g at the substrate is approximately equal to the bulk T g for this linear-chain PS/SiOx system, as discussed earlier. Hence, the aging rate necessarily reaches a plateau, as shown.[Reference Frieberg, Glynos and Green32] The aging rates for the 8-arm star-shaped PS [Fig. 10(b)] are also depth-dependent and also dependent on the difference between the aging temperature and the local T g, i.e., the T g at that depth.[Reference Frieberg, Glynos and Green32] The other important result of this model is shown in Fig. 9(c), which shows the lower T g surface layer for the linear chain increases with increasing T, for temperatures below T g. This is the liquid-like surface layer to which we referred in the section on the T g of thin films; its thickness is dictated by T g–T. These data in Fig. 10(c) are consistent, both in magnitude and the trend with temperature, with independent experiments by other researchers.[Reference Paeng, Swallen and Ediger62, Reference Paeng and Ediger106] When the outer surface layer has a higher T g than the bulk, the surface layer thickness decreases (opposite trend) over the same temperature range.
(a) The aging rate is shown here for linear-chain PS as a function of distance from the free surface, for a h = 50 nm thick film; (b) similar data are shown for the 8-arm star shaped PS. (c) The thicknesses of the surface layers are shown here at a function of the difference between the bulk T g and the aging temperatures for linear-chain and star-shaped polymers. Reproduced (adapted) with permission from Ref. Reference Frieberg, Glynos and Green32, copyright 2012 American Physical Society.
We conclude this section by reiterating the following observations. The aging of a thin film is dictated by the local T gs near the interfaces. The average aging rates of star-shaped macromolecules are lower than that of their linear-chain analogs. This has important implications regarding the use of macromolecules of different architectures for thin-film membrane applications as well as a host of thin-film packaging applications.
Future outlook
Star-shaped polymers exhibit different physical properties from their linear-chain analogs when confined to thin-film geometries. The key differences include the following. (i) The surface wettability of star-shaped polymers may be “tailored” in a controllable manner by varying the functionality of a star-shaped polymer and the arm length. (ii) The substrate and free surface T gs of the star-shaped polymers are dependent on the functionality and molecular mass per arm. (iii) Star-shaped polymers age more slowly than linear-chain polymers.
The practical implications of such differences are important for a variety of applications. The mechanical properties of films are sensitive to film thickness as shown by MD simulations,[Reference Bohme and De Pablo107, Reference Yoshimoto, Jain, Nealey and De Pablo108] finite-element analysis,[Reference Clifford and Seah109] nanoindentation experiments,[Reference Clifford and Seah110] thin-film buckling measurements,[Reference Stafford, Harrison, Beers, Karim, Amis, Vanlandingham, Kim, Volksen, Miller and Simonyi13, Reference Stafford, Vogt, Harrison, Julthongpiput and Huang111, Reference Torres, Stafford and Vogt112] and Brillouin light scattering. The thickness dependence is associated with the fact that near the free surface the local T g is lower than the bulk T g, which suppresses the average T g of the film. The magnitude of the modulus depends on the difference between the bulk T g and the ambient temperature at which the measurements are conducted. Star-shaped polymers would offer an important alternative to linear-chain polymers, because their interfacial properties are dictated by f and M arm. Another obvious application would be adhesion to various types of interfaces, due to their enhanced wettability. Additionally, the star-shaped polymers may be suitable for membrane applications for gas selectivity and/or separation. Since the star-shaped macromolecules age at appreciably slower rates than the linear chains, they offer important advantages with regard to the stability and reliability of pore sizes in polymer membranes.
Acknowledgments
This publication is based on the work supported in part by the National Science Foundation (NSF), Division of Materials Research by award DMR-0906425 and award DMR-1305749. Certain commercial equipment, instruments, or materials are identified in this paper in order to specify the experimental procedure adequately. Such identification is not intended to imply recommendation or endorsement by the National Institute of Standards and Technology, nor is it intended to imply that the materials or equipment identified are necessarily the best available for the purpose.