


Introduction
Previous satellite-radar altimeters such as Geosat and Seasat provided coverage for high-precision mapping of the Antarctic plateau up to 72° S (Reference BrooksBrooks, 1983; Reference Zwally, Bindschadler, Brenner, Martin and ThomasZwally and others, 1983). Radar-altimeter data from the ERS-1 satellite gives coverage for the first time up to 82° S, providing detailed elevation maps of the majority of the ice sheet and ice shelves.
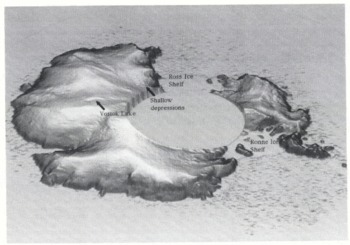
A useful technique for displaying data over large areas is the shaded isometric view. It provides a higher visual definition for identifying surface features than the more conventional contour map. Figure 1 shows a shaded isometric view of the Antarctic continent derived from the ERS-1 fast-delivery (FD) radar-altimeter data (see next section for details). Several surface features of low relief are revealed. One distinct feature of particular interest, near the centre of the East Antarctic plateau, is a large flat region, 50 km × 185 km centred 150 km north-northwest of Vostok (78°28′S, 106°49′E). This region, which has previously been observed during radio-echo sounding (RES) flights and aerial surveys (Reference Robin, Drewry and MeldrumRobin and others, 1977), is the surface expression of a large subglacial lake about 3950 m beneath the surface of the ice sheet.
An isometric plot of Antarctica compiled from the ERS-1 35 d FD radar-altimeter data. Details of the surface topography are highlighted including the prominent Vostok subglacial lake.
Knowledge of the presence of basal water is important because of its influence on ice dynamics, through the degree of glacial coupling to the bed, and because of the implications for basal temperatures, and hence the creep properties of the basal layer of ice (Reference ShoemakerShoemaker, 1991; Reference AlleyAlley, 1992). The pressure gradient beneath a glacier normally serves to drive out subglacial water; however, Reference Oswald and RobinOswald and Robin (1973) showed that water flow in the direction of ice flow can be prevented by a basal slope against the flow, provided the basal gradient is approximately ten times that of the surface. If the flow of water is halted, a subglacial lake forms. Such conditions are most likely to be found where surface slopes are small, such as domes and saddles on the ice sheet.
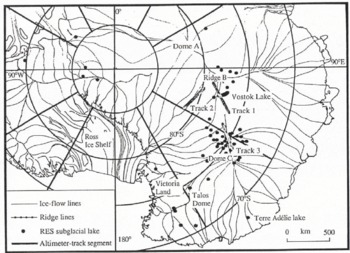
Subglacial lakes are the most readily identified form of water beneath the Antarctic ice sheet, and are indicated by anomalously strong and uniform returns from RES data. They can have lateral extents of several kilometres and are common in parts of East Antarctica. Previous workers (Reference Oswald and RobinOswald and Robin, 1973; Reference SteedSteed, 1980; Reference Guzkowska, Rapley, Ridley, Cudlip, Birkett and ScottMacIntyre, 1983) have inspected the RES records and have found about 57 lakes (Fig. 2), typically of the order of one ice thickness in lateral extent. The lakes tend to be grouped beneath Ridge B, Dome C and Talos Dome in northern Victoria Land. A large concentration of lakes over such regions indicates that the basal ice must be close to the pressure-melting point over considerable areas.
A location map for features discussed in the text, showing subglacial lakes previously discovered from radio-echo sounding data and segments of altimeter ground tracks.
The decoupling of the ice from the substrate, due to the presence of water, will have an effect on the flow of ice and the surface topography, similar to that observed over ice shelves. Consequently, after moving on to the lake, the ice-sheet surface will become horizontal and flat, provided there is no localized grounding, on time-scales of a few years (Reference ShoemakerShoemaker, 1991). Radar altimetry is useful in measuring very small gradients and so can be used to detect the change in gradient from the ambient grounded ice to that over the lake.
The only subglacial lake known to have been previously observed with radar altimetry is in Terre Adélie (Fig. 2), and has been mapped by both the Seasat and Geosat satellites (Reference Cudlip and McIntyreCudlip and MacIntyre, 1987; Reference Remy, Mazzega, Houry, Brossier and MinsterRemy and others, 1989; Reference Mantripp, Ridley and RapleyMantripp and others, 1992). Besides the glaciological significance of subglacial lakes, a large lake creates a topographically flat area that may be used as a height-reference surface for use in improving the knowledge of altimeter-satellite orbits.
Data Handling
Launched in July 1991, ERS-1 first entered a commissioning phase. Between December 1991 and March 1992, it operated in a 3 d repeat cycle with a ~300 km cross-track sampling of the surface elevation at the Antarctic coast. Since April 1992, it has been in a 35 d repeat cycle, providing a cross-track sampling of ~30km at the coast. In 1994, the satellite will enter a 176 d repeat cycle which will provide very dense coverage of the Antarctic interior. This study involves ERS-1 radar-altimeter data exclusively.
ERS-1 radar-altimeter data
ERS-1 radar-altimeter elevation data are available in two forms. The first is called fast-delivery (FD) data. This has reduced spatial resolution as the full surface-sampling rate of 20 Hz has been averaged to give a measurement of surface height every 6.7 km (1 Hz) along-track. The second form is known as low bit rate (LBR) data, in which the telemetered return-echo wave forms are available for analysis, and it provides the full 335 m (20 Hz) sampling along-track. An analysis of the echo wave forms permits a higher-precision surface height measurement than the FD data through a recalculation of the range estimate in a process known as retracking (Reference Martin, Zwally, Brenner and BindschadlerMartin and others, 1983). Only limited amounts of LBR data, from the 3 d repeat cycle of the ERS-1 mission, were available for this study.
Although the FD data used do not contain return-echo wave forms to allow for correction of tracking errors, it has been shown that ERS-1 tracks the surface well over the majority of the ice sheet (Reference ScottScott and others, 1992). However, careful data filtering is required to ensure that, as far as possible, range estimates obtained when the altimeter has lost track of the surface are excluded. Here, we use the pulse-peakiness parameter (provided in the data set) to reject faulty measurements (Reference ScottScott and others, 1992). Data points with a pulse-peakiness value of less than unity, which indicate that the altimeter is no longer tracking the first return from the surface, are rejected. This filter eliminates more than half of the poor tracking data, whilst retaining 99% of good tracking data. More stringent data filters can be placed on the data, but at the cost of losing further good, and potentially interesting, data. In this example it was decided to tolerate some anomalous data to allow the maximum information on ice-sheet features to be observed.
Only nominal values for the various altimeter corrections are provided in the FD data set. The dry, wet and ionospheric corrections are fixed at 2.32, 0.10 and 0.02 m, respectively, and there are no tidal corrections. However, the error introduced by using these values is likely to be no more than 0.2–0.3 m and this is small compared to the tracking and orbit errors (see below). Similarly, the slope-induced error (Reference Brenner, Bindschadler, Thomas and ZwallyBrenner and others, 1983) is <1 m in this region and so has been ignored. The effects of radar penetration into the surface (Reference Ridley and PartingtonRidley and Partington, 1988) have also not been accounted for, but this is expected to be fairly uniform over the region considered and so will affect only the overall bias in the map.
Data processing
FD data from May and June 1992, from a single 35 d repeat cycle, were used to produce the isometric view. The contour map of the vicinity of the Vostok lake was produced from three such 35 d cycles from April to September 1992, averaged to reduce the effects of orbit error. Extra coverage of the area was provided by a 3 d repeat and a number of tracks from the commissioning phase. The LBR data, from the 3 d repeat cycle, were used for the more detailed analysis of the profiles over the lake.
Over regions of Antarctica with low surface gradients, the accuracy of the data is principally determined by the knowledge of the satellite orbit. The FD data were processed using the ERS-1 restituted orbit available from ESA. This has a specification accuracy of ±25 m spatially, and 15 m radially (ERS-1 programme, 1991). To assess the error in our area of interest, a cross-over analysis was conducted over the region around the lake. A total of 1500 orbit cross-overs for the first 35 d repeat processed provided height differences with a r.m.s. of 3.5 m. Given that data from three 35 d repeats were averaged to generate the contour map, we can assume the relative error in the data points is of the order of 2 m r.m.s. As the area is contoured with 10 m contours, this error was deemed to be not sufficiently large to warrant carrying out a cross-over adjustment prior to contouring. The 2700 average surface elevations, from the FD data set, over the region of the lake were contoured using the method of Reference Franke and NielsonFranke and Nielson (1980). The absolute error in orbit data was not evaluated and so the height values shown on the contour map may be biased by up to 15 m.
A further parameter from the FD data set is the standard deviation of surface heights derived from the 20 individual samples which comprise the 1 Hz values. This is a measure of how flat and uniform the surface is over distances of 6.7 km. In order to extract that part of the data set for which the surface is considered topographically flat, the FD data were filtered using the criterion that the standard deviation of heights must be less than 0.5 m. In addition, regions of low overall surface gradient were determined by identifying data for which the gradient across three consecutive 1 Hz samples (20 km) was not greater than 0.5 m km−1. This was the maximum gradient observed over the Terre Adélie lake (Reference Cudlip and McIntyreCudlip and MacIntyre, 1987). The results of this filtering are shown later.
Three satellite ground tracks crossed the area of the “lake” during the 3 d repeat cycle. The echo wave forms from LBR data available from this phase were retracked using a 10% threshold technique (Reference Guzkowska, Rapley, Ridley, Cudlip, Birkett and ScottGuzkowska and others, 1990), correcting the elevations for the on-board tracker lag. Comparison of repeated LBR tracks across the “lake” showed the retracked height precision of the measurements to be 0.11 m r.m.s. for 20 Hz data. To assess the error in the FD data due to these data not being retracked, the retracked heights from the LBR data were compared with the corresponding FD data. The r.m.s. height error was ~1.0 m, which is small compared to the orbit error.
Results
The altimeter data were used first to map the topography over the Vostok lake, and secondly, the individual height profiles were used to characterize specific topographic features. Two existing models are described, and their output matched with the observed topography, to determine what glaciological information may be extracted from the height data. Having determined some of the characteristic features in the data from the Vostok lake, the data set for all of Antarctica is searched for similar features and hence other subglacial lakes. From both the FD and LBR data sets, the limits in terms of the minimum size of lake that may be discovered is determined. Finally, a satellite Orbitographic application for large flat areas, such as the Vostok lake, is described.
Vostok lake
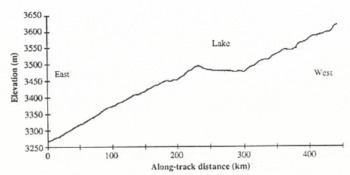
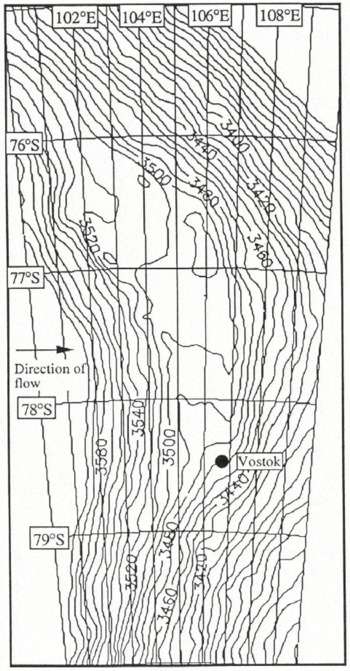
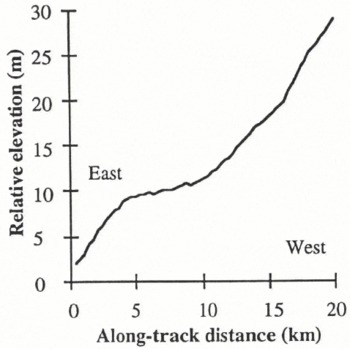
An LBR elevation profile of one of the tracks, track 1 in Figure 2, from the 3 d repeat cycle, which crosses the centre of the lake and the adjacent slopes is shown in Figure 3. This illustrates the sharp change in gradient between the surrounding ice sheet and the horizontal lake surface. The 3 d repeat LBR data are too sparse in coverage to provide a contour map of the region, so the FD data from the 35 d repeat were used (Fig. 4). The elevations used in the contour map are evaluated relative to the GRS-80 Earth reference ellipsoid. The ground tracks, and corresponding density of data points used in the contour map, are shown in Figure 5.
An elevation profile over the Vostok lake and its environs shown as track 1 in Figure 2. The elevation samples are at 0.35 km intervals and the profile runs from east to west.
Contour map (10 m intervals), compiled from ERS-1 fast-delivery data, of the ice surface over the large Vostok subglacial lake.
The location of data points used in the FD contour map in Figure 3.
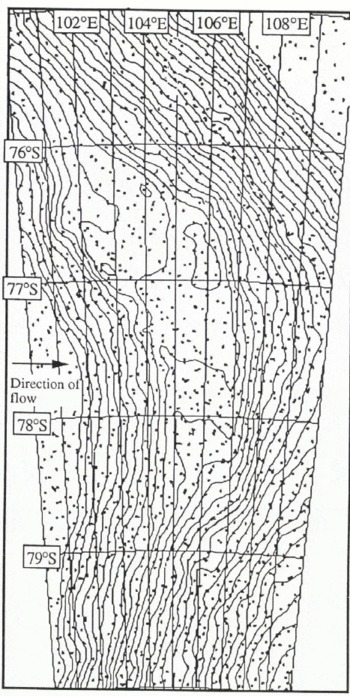
Across the region of the lake, the ice-surface gradient is reduced from 0.08° (1.4 m km−1) either side to < 0.002° (0.035 m km−1) over the lake itself. However, there is a slight gradient, 0.006° (0.105 m km−1) south to north, along the length of the lake, perpendicular to the gradient of the surrounding plateau. Other features evident in the contour map are a valley on the east side and a slight rise on the west (downstream) side of the flat region. The standard deviation of heights (SDH) over the flat region drops very rapidly from 2 m on the plateau to 0.2 m over the central part (Fig. 6), indicating that this central region is free from local grounding. On the northern part of the lake there is a small tongue about 20 km across which may be a slow ice stream entering from the northern end.
Map showing the region of the lake for which the surface standard deviation of heights for 20 consecutive samples is less than 1 m (shaded region). Overlaid on the map are the LBR tracks from the ERS-1 3 d repeal cycle, the track sections shown as dashed line correspond to the height profiles shown in Figure 7. Also shown are the RES flight paths and the locations of strong bottom echoes from radio-echo sounding (Reference Robin, Drewry and MeldrumRobin and others, 1977) which have been interpreted as the signature of basal water.
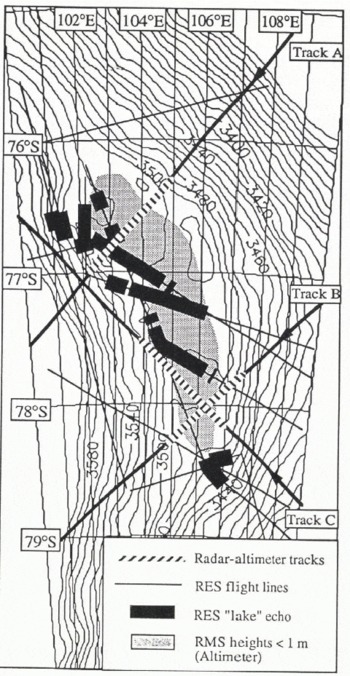
The altimetric surface-height contours are compared with the locations of bright bottom returns, from the Reference Robin, Drewry and MeldrumRobin and others (1977) airborne RES data, in Figure 6. Although there is general agreement with the location of the lake in both data sets, there are two areas where subglacial water is detected in the presence of a higher surface slope. At the south end of the lake, the disconnected subglacial water is probably a small adjacent lake, over which the altimeter FD sample spacing is too coarse to discriminate a distinct change in gradient. This hypothesis is supported by the RES data which show the detached lake to be ~30m lower in elevation than the main lake; the same elevation difference is seen in the surface contours. Overflow from the larger lake will likely be forced into this lake as a consequence of the north-south surface gradient. The other major discrepancy between the data sets is in the northwest of the map, where subglacial water was detected at a point where the surface gradient is relatively high. A lateral mislocation of the aircraft track of 5 km, due to navigation errors, is possible, but it is insufficient to place the aircraft ground tracks where the surface becomes flat.
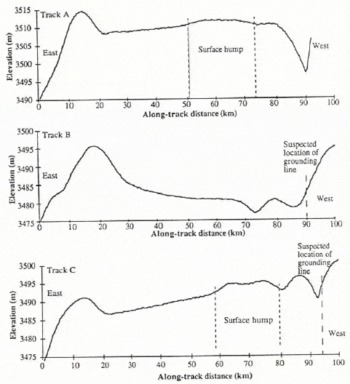
The LBR elevation profiles across the flat region (Fig. 7a–c), whose locations are shown in Figure 6, provide detail of the general features seen in the contour map. These profiles all show an ice rise which bounds the lake to the east and a shallow depression on the western edge which is similar to that seen at grounding lines of ice shelves (Reference SmithSmith, 1991). Profiles A and C also show a surface hump of 1 m on the otherwise flat surface profile over the western half of the lake.
Details of the retracked height profiles across the lake for the three LBR tracks (A, Β and C locations shown in Figure 6) which crossed it during the 3 d ice phase. The suspected ice-grounding points and anomalous humps are shown. Ice flow is from west to east.
Interpretation
The dominant surface feature of the lake in Figure 4 is the 40 m drop in elevation over 220 km from north to south. The altimeter-derived heights have not been corrected for the local geoid, but inspection of the GEM-Τ1 model (Reference MarshMarsh and others, 1988) indicates a drop of only 5 m along the lake from north to south. The excess difference along the lake could be due to a local geoid not accounted for in the GEM-Τ1 model, but a 35 m geoid error is unlikely. The observed surface gradient follows the bend in the lake, remaining perpendicular to the ambient, grounded ice, suggesting that the ice is thicker at the northern end.
Since the ice on the lake must be in hydrostatic equilibrium with the basal water, the basal ice gradient must be 11 times the surface gradient (Reference Oswald and RobinOswald and Robin, 1973). A height change across the lake of 40 m would correspond to an effective depth of lake water of 440 m.
Model of lake-surface profile
The cross-section profile of the lake shows a sharp elevation drop down to the horizontal area of the lake, followed by a sharp hump followed by the downstream plateau gradient. The overall shape of the cross-section is that of a surface depression.
The transition region from grounded ice sheet to glacial lift-off over the lake may be described by a simple model (Reference ShoemakerShoemaker, 1990). The two-dimensional model draws a relationship between the length, L, in which the basal shear stress decays to zero, and the change in surface elevation, Δh, across the transition. The model indicates that a surface depression over a lake, as is the case of the Vostok lake, is likely to occur where there is thick slowly moving ice, provided that L is less than about 5 km.
To test if this model is applicable to the Vostok lake, we use the three detailed profiles across the lake, from the LBR data in Figure 7. Projecting the track lengths to be perpendicular to the lake coast, the components of the profiles are compared with the model predictions for L and Δh. Ice-flow rates of 2–20 m a−1 are assumed. It is found, in the case of all three profiles, that the model requires too short a transition length, L, to generate the magnitude of the observed downstream rise of 5–10 m. However, Reference ShoemakerShoemaker (1990) stated that the length of the transition region, L, will increase as the bed-depression angle decreases. Alternatively, the downstream ridge may be the surface expression of subglacial mountains, a possibility that would negate a direct application of the model. The model appears unable to fit the surface profile because of the prescriptive nature of the assumptions and initial conditions on which it is based.
Grounding-line surface-profile model
The 5–10 m dip in the surface elevation at the grounding line, seen in the profiles in Figure 7, appears to be a dynamic feature similar to that observed at ice-shelf grounding lines (Reference SmithSmith, 1991). If the ice is modelled as a uniform plate, then the basal topography will follow that of the surface and the water depth must then be greater than 5–10 m.
A single dip in the surface elevation is predicted by simple flexure of a two-dimensional elastic plate of constant thickness, clamped at one end, resting on an elastically deforming foundation — water (Reference SmithSmith, 1991). The elevation, H, of the surface with distance, x, is given by:

where H0 is the equilibrium surface elevation, θ0 is the angle of the rock bed with respect to the horizontal, z0 is the height of the centre line at x = 0 and β is an elastic damping factor. That used by Reference SmithSmith (1991) for ice shelves is:
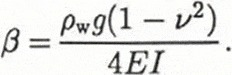
Here, ρw is the density of sea water, g is the gravitational constant, v is Poisson’s ratio for ice (0.3), Ε is the Young’s modulus of the ice appropriate at tidal frequencies and I is the second moment of the ice, thickness 2h:
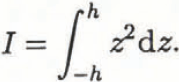
Although it can be shown that a similar form of the elastic equation is applicable for a viscous material, the numerical values for the various fitted parameters do not differ greatly in either case. In this analysis, β is presented as some plastic-elastic bending factor dependent on ice thickness. The principal fitting factors of the model to the observed undulations are the bending factor, which determines the surface curvature, and z0 which defines the amplitude. Fitting of the model to the Vostok and other lake grounding-line surface profiles are discussed later. However, a double dip, as seen in tracks Β and C in Figure 7, is not permitted by the model and may require additional modelling for alternative grounding-line geometries.
Search for other flat areas
We have identified that the surfaces of lakes are smooth from the standard deviation of surface heights (SDH) within the Vostok lake FD data. This criterion can be used to search for other lakes and flat areas within the complete FD data coverage of Antarctica. To do this, the data are filtered for SDH <0.5m, “smooth” and along-track gradient <0.3 m km−1 over 20 km (three FD data points), “flat”.
The surface can only be considered to be smooth and flat in two dimensions if both the ascending and descending tracks show such characteristics. Tracks which run along linear features such as basins or ridges will satisfy the criterion in one direction only. The complete map of flat surfaces is compiled from segments of tracks at cross-over points where crossing tracks are both flat.
The main areas identified through this data filter are the Vostok lake and the ice shelves. Other continuous stretches of the sub-set are located on ridge lines where surface gradients are relatively low. All other points are located in small basins, between undulations, and large basins, such as that between Dome A and Dome G and between Dome C and Victoria Land. None of the locations for flat areas are coincident with lakes catalogued from the RES records by Reference MacIntyreMacIntyre (1983). The reasons for this are partially because the grounding-line undulation, observed in the LBR height profiles, increases the r.m.s. heights. The lake must then be up to 20 km wide along the ground track before it flattens out after the undulations. The lake must then be flat for another 20 km, the shortest length needed to measure the gradient from three samples. Most of the subglacial lakes, discovered through RES flights, have dimensions similar to the ice thickness, ~4km across, and so are not detectable by this method. The only other known lake with linear dimensions of ~40km, which should be detected, is the Terre Adélie lake (Reference Cudlip and McIntyreCudlip and MacIntyre, 1987). An examination of the data shows missing orbits across the area of the lake and so it is not detected.
Search for other lakes in the LBR data
We have shown that the FD data have an inadequate sample spacing to detect even intermediate-sized sub-glacial lakes, so a pilot study was undertaken to search for such lakes in the LBR data. The limited coverage of the 3 d repeat can be extended, if the technique proves successful, once the 35 d repeat LBR data are available.
The LBR data were examined to study the details of the “pock marks”, observed in Figure 1, which are suggestive of smaller subglacial lakes (Reference RobinsonRobinson, 1964). Small lakes will not be apparent in any search for flat areas, as they have linear dimensions on the order of the wavelength of the grounding-line undulations. The wavelength of the undulations at the grounding line, for the Vostok lake, are determined by the three LBR profiles in Figure 7, as ~20km. An examination of a track passing through an area of “pock marks”, track 2 in Figure 2, revealed that several short parts of the track had horizontal surfaces with sharp changes of gradient both upstream and downstream (Fig. 8). A close examination of these profiles reveals that they all have the form of a shallow undulation, similar to that which follows the Vostok lake upstream grounding line (Fig. 9). The undulation wavelengths on all three of the potential lakes on this single track are approximately the same but are shorter than that from the Vostok lake.
An LBR profile which crosses three flat areas that may be subglacial lakes too small to be detected in the coarser sampled FD data. This is shown as track 2 in Figure 2.
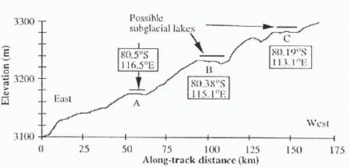
Detailed profiles of the three flat regions, shown in Figure 8, compared with the start of track Β across the Vostok lake. The low-amplitude undulations appear to be characteristic of a subglacial lake upstream of the grounding line.
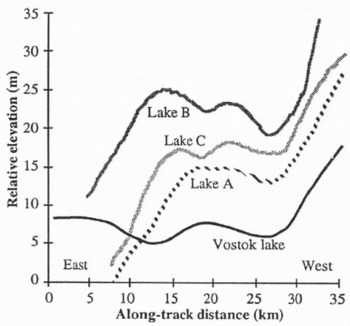
The model of Reference SmithSmith (1991), referred to as Equation (1), is fitted by inspection to the first undulation of one of the “pock marks” and to the Vostok lake, and is found to provide a good description of part of the undulating surface (Fig. 10). A decrease in ice thickness, 3950 m at Vostok (Reference Robin, Drewry and MeldrumRobin and others, 1977) to ~2500 m along track 2 (Reference Drewry and DrewryDrewry, 1983) causes a decrease in undulation wavelength. The bending factor, β, is 3.8 × 10⁻⁴m−1 for track 2 and 2.4 × 10⁻⁴ m−1 for Vostok. The observation that the elastic bending model is applicable for part of the surface profile is indicative that the pock-mark features observed in Figure 1 may be intermediate-sized subglacial lakes.
The fit of the grounding-line model of Reference SmithSmith (1991) to the first undulation in the horizontal profile of subglacial lakes, a. Lake A from Figure 9; b. Track Β across the Vostok lake. Coarse estimates of the ice thickness and Young’s modulus of the ice may be determined from the fit.
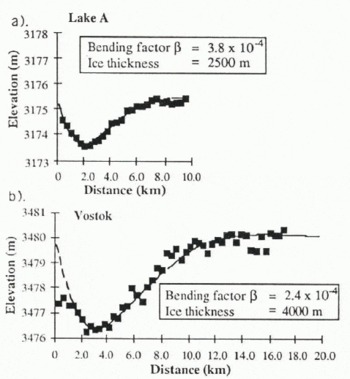
However, as stated earlier, the double undulation observed is not permitted by the simple grounding-line model of elastic bending. If the first dip in the surface profile follows the grounding point, then a second dip should not be expected from floating ice. The model assumes a planar gentle gradient in the bedrock to the point of glacial lift-off, but in the case of subglacial lakes this may not be applicable. The bedrock geometry may include a step or series of steps into the subglacial water, and this would have a significant impact on the surface topog-raphy.
In order to search for flat lengths of LBR profile which have characteristics different from those exhibited in Figure 9, the same track was searched for 3.5 km segments with a standard deviation of less than 1 m in the intervening ten samples. Many small sections of track, of which Figure 11 is an example, did fulfill the requirement. They are different from the segments in Figure 9 in that the radius of surface curvature is greater immediately upstream and downstream of the horizontal section of profile, and they are shorter. They appear to be simply horizontal segments of the general ice-sheet undulations with wavelengths of 40 km or more. The segment in Figure 11 has similar gradients associated with it as the segments in Figure 9, and serves as a control to illustrate that the observed low-amplitude undulations are not of instrumental origin.
A control segment of the same LBR track shown in Figure 8, showing a flat section which does not have low-amplitude undulations. The length of the horizontal parts of such sections is generally less than 5 km.
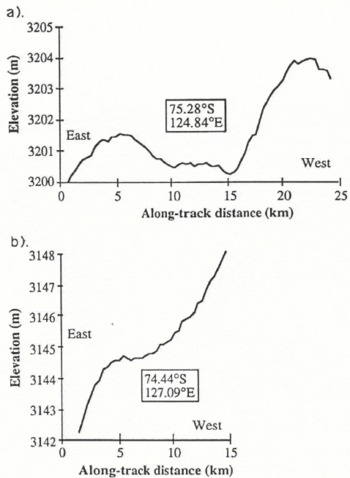
One LBR track, track 3 in Figure 2, passes over two of the subglacial lakes located by Reference SteedSteed (1980), the altimeter-height profiles for which are shown in Figure 12. From the length of the horizontal surface, these lakes appear to be smaller than those in Figure 10. However, given positioning inaccuracies due to aircraft-navigation errors, we cannot be sure that the satellite track passes directly over the lakes. In both cases, the surface topography becomes flat for only ~5km and the upstream grounding-line undulation is absent. There is no apparent difference between the surface topography over the confirmed lake shown in Figure 12b from that over undulations such as that shown in Figure 11. Consequently, a greater horizontal surface, as determined by the altimeter, is required to detect the surface manifestation of subglacial lakes. The lower size limit for the detection of lakes within a single radar-altimeter profile is ~10km, approximately twice the length of normal undulation crests as seen in Figure 11.
a–b The elevation profiles across two small lakes previously identified from radio-echo sounding data ( Reference SteedSteed, 1980). These profiles are found on track 3 in Figure 2.
Ice-sheet reference surfaces
A surface that is flat in two dimensions is of value as a height-reference surface for radar altimeters (Reference Gorman, Drewry, Guyenne and HuntGorman and Drewry, 1984). The desirable criterion is that the cross-track slope is small, <0.05 m km−1, or can be modelled accurately. This is needed because repeat tracks can vary in location in the cross-track direction by up to ± 1 km. Knowledge of the cross-track surface slope allows a correction for the cross-track vertical displacement to be applied, and the determination of the slope is the main source of error in the use of land-reference surfaces.
The Vostok lake is ideal for a reference surface, since the surface slopes are both low (0.1 m km−1) and uniform. The retracked-height data can be averaged along-track to improve the precision, and so, given that the wet tropospheric correction is negligible in this region, precisions of a few centimetres should be achievable for relative radial-orbit error calculations. This is assuming, of course, that the surface properties of the snow do not change significantly. Detailed analysis of repeat waveform data will be required to establish the effect of, for example, fresh snowfall or possible seasonal variation in surface penetration.
The area also has the potential of an absolute orbit reference but this would require an independent estimate of the surface elevation (for example, using Global Positioning System) and a complete evaluation of all the biases involved in the altimeter observations. The deployment of a transponder could help in this regard.
Summary and Conclusions
ERS-1 is providing a new view of Antarctic topography. This paper examines the area of the Vostok subglacial lake to determine whether glaciological parameters may be extracted from the height profiles. A comparison of the surface-elevation contours with the location of subglacial water, as determined from RES data, shows good agreement. A search for lakes similar to that at Vostok, based on the surface gradient and standard deviation of surface heights over the Vostok lake, reveals that within the 82° S latitudinal limit of ERS-1 the Vostok lake is unique in the extent of its areal coverage. Most lakes are much smaller, a few kilometres across, and give rise to a “pock mark” in the surface topography.
Large-and intermediate-sized lakes (i.e. >10km) can be identified by a low-amplitude undulation at the upstream grounding line, similar to that seen on ice shelves. This undulation may be used as a signature for the detection of lakes in the 20 Hz, LBR, retracked radar-altimeter data. On a single ground track, three such lakes may have been found with diameters of 10–20 km. We have shown that the observed surface undulation may be fitted, in part, by a model similar to elastic bending of the ice; a model which is sensitive to the ice thickness. The surface undulations are a response to the geometry of the basal rock at the grounding line. Because the geometry will vary according to the lake studied, a generic model function to extract an ice-thickness parameter will be only moderately successful.
With a limited sub-set of the LBR data, we have identified the signature of possible subglacial lakes with dimensions as small as 10 km across using individual elevation profiles. However, profiles over smaller lakes, ~5 km across, such as two we have found coincident with radio-echo sounding data, show no unique undulation signature, thus 10 km seems to be the limit of detection using radar altimetry. Once a full 35 d cycle of LBR data is available, an almost complete survey of subglacial lakes, >10km across, up to 82° S can be conducted. It may be possible to detect smaller lakes using the 176 d repeat cycle mission of ERS-1, through the construction of a complete three-dimensional map of the surface.
The comprehensive mapping of the location of subglacial lakes will provide further information on basal melting of the ice sheet. Such information will aid models of the ice-sheet flow and mass balance. The flat area produced by a large subglacial lake can be used as a height-reference surface to help improve the knowledge of altimeter satellite orbits.
Acknowledgements
We gratefully acknowledge the U.K. SERC for funding of this work, and ESA for the supply of the data. We would like to thank our colleagues at MSSL, C. S. M. Doake and others at the British Antarctic Survey, for their helpful comments and contributions.
The accuracy of references in the text and in this list is the responsibility of the authors, to whom queries should be addressed.



