Implications
Sugarcane is an important forage source for feeding dairy cows in tropical countries. However, its high concentration of indigestible fiber leads to lower energy intake, which can both increase negative energy balance and decrease milk production in early lactation. In this context, the use of supplementary fat can be an alternative to increase energy density of sugarcane-based diets; however, fat supplementation can promote adverse effects on performance, digestion and metabolism. Soybean oil (SBO) inclusion at 44.3 g/kg of dry matter (DM) in sugarcane-based diets can increase milk production and improve the milk fatty acid (FA) profile, without adverse effects on digestion and metabolism.
Introduction
Sugarcane is a forage commonly fed to cattle in tropical environments and often used as the main dietary fiber source (Oliveira and Millen, Reference Oliveira and Millen2014). However, its use for high yielding dairy cows is usually associated with supplementary feeding with high amounts of concentrates, leading to a high proportion of non-fiber carbohydrates (NFC) in the diet (Oliveira et al., Reference Oliveira, Detmann, Campos, de, Pina, dos, Souza and Costa2011). Furthermore, sugarcane fiber contains a high proportion of indigestible NDF (iNDF) and low potential digestible NDF (pdNDF) at about 250 and 270 g/kg of DM, respectively (Daniel et al., Reference Daniel, Capelesso, Cabezas-Garcia, Zopollatto, Santos, Huhtanen and Nussio2014). The high iNDF concentration usually leads to lower dry matter intake (DMI) and, consequently, more concentrate is needed when compared to corn silage-based diets (Oliveira et al., Reference Oliveira, Detmann, Campos, de, Pina, dos, Souza and Costa2011). Under these circumstances, the supplementation with fat sources is an alternative that can increase energy concentration of the diet without increasing the NFC concentration.
The use of vegetable oils, such as SBO, has known adverse effects on rumen fibrolytic microbes, which can consequently decrease DMI, fiber digestion and milk production (Yang et al., Reference Yang, Bu, Wang, Hu, Li, Wei, Zhou and Loor2009; Rodrigues et al., Reference Rodrigues, de Paula, Rennó, Fontes, Machado, de, Valadares Filho, Huhtanen and Marcondes2017). Previous research indicated that SBO inclusion did not increase energy intake or milk production for late lactation cows (Rodrigues et al., Reference Rodrigues, de Paula, Rennó, Fontes, Machado, de, Valadares Filho, Huhtanen and Marcondes2017). However, studies evaluating SBO for early lactation cows observed decreased milk fat without effects on DMI and milk production (Fatahnia et al., Reference Fatahnia, Nikkhah, Zamiri and Kahrizi2008). The early lactation period is characterized by a negative energy balance, and there are no studies evaluating the use of sugarcane at this lactation stage. Fat supplementation effects on milk production and composition can be dependent on fat inclusion rates, basal diet characteristics (e.g. forage species) and lactation stage (Rabiee et al., Reference Rabiee, Breinhild, Scott, Golder, Block and Lean2012). Thus, SBO supplementation should be evaluated for dairy cows fed sugarcane in early lactation.
We hypothesized that SBO supplementation increases energy intake and milk production in early lactation cows fed high concentrate sugarcane-based diets. We aimed to measure the performance, digestion and metabolic variables in early lactation dairy cows fed different concentrations of SBO in sugarcane-based diets. Secondarily, we aimed to find an optimum range of SBO inclusion with positive effects on performance and without adverse effects on digestion and metabolism.
Material and methods
Experimental design
Fourteen primiparous (545±17.2 kg BW) and eight multiparous (629±26.7 kg BW) Holstein dairy cows were used. For 21 days before expected calving, all animals were fed a sugarcane-based diet supplemented with refined SBO (150 g of CP and 20 g SBO/kg DM). The study was designed to be analyzed using 24 animals; however, the data of two primiparous cows were removed due to babesiosis and dystocia followed by caesarean. The study was conducted according to a randomized block design. After calving, cows were randomly assigned within the two parity groups to the diets (Table 1). The study was performed from calving until 84 days in milk, divided into three periods of 28 days each.
Ingredients and chemical composition of the experimental diets for early lactation dairy cows

SBO concentration: LSBO=low soybean oil; MSBO=medium soybean oil; HSBO=high soybean oil; DM=dry matter; NFC=non-fiber carbohydrates.
Diets and management
The cows were housed in individual stalls (3.5×5.0 m) with rubber powder beds and free access to water and feed bunks. Diets were formulated to meet the requirements of dairy cows averaging 600 kg of BW and 30 kg/day of milk production, according to Nutrient Requirements of Dairy Cattle (NRC) (2001) with increasing concentrations of refined SBO (g/kg of DM): control (0 g/kg), low (LSBO; 15.7 g/kg), medium (MSBO; 44.3 g/kg) and high (HSBO; 73.4 g/kg) (Table 1). To get iso-nitrogenous diets, the proportions of maize and soybean meal were changed among treatments (Table 1). A fixed roughage to concentrate ratio of 40 : 60 was used. Sugarcane (variety RB-867515) was harvested daily in the afternoon and chopped before the morning feeding. Sugarcane stems had an average soluble content of 18.0±1.68°Brix. Concentrate oxidation was prevented by preparing a single batch of concentrate at the beginning of each experimental period and adding an antioxidant (butylhydroxytoluene). Cows were milked twice daily at 0550 and 1450 h, and fed total mixed ration individually after each milking. Intake was calculated by manually weighing the offered feeds and collected orts. Diets were offered on an ad libitum basis (target 100 g refusal/kg fed) and the amount offered was adjusted daily.
Samplings and measurements
Intake and digestibility
Samples of soybean meal, corn meal and SBO were taken in each batch of concentrate and stored at −20°C until analysis. To adjust the forage to concentrate ratio of the diets, the sugarcane DM was quantified weekly. To estimate intake and digestibility of nutrients, samples of sugarcane and orts were taken from days 12 to 16 of each experimental period, pooled per cow and period while fresh and stored at −20°C until analysis. A total of eight spot fecal and urine samples were collected at 9 h intervals starting at 0900 on day 12 of each experimental period (Sampaio et al., Reference Sampaio, Detmann, Valente, Costa, Valadares Filho, de and Queiroz2011). Fecal samples (300 cm3) were collected from the rectum and immediately oven-dried at 55°C and stored. Urine samples (200 ml) were collected by stimulating the vulva and then 10 ml was acidified with 40 ml of sulfuric acid (H2SO4, 1 ml/l) for creatinine, uric acid and allantoin analysis. Both urine and fecal samples were pooled by cow and period before analysis.
Performance
Milk production was measured daily. To estimate milk composition and FA profile, samples were collected from days 13 to 15 of each experimental period. A pooled sample by cow and period was made proportionally to production in each milking session and stored in duplicate (100 ml each) at −20°C until analysis. For milk urea nitrogen (MUN) analysis, 10 ml of milk was deproteinized with 5 ml of trichloroacetic acid (250 g/l), filtered and stored at −20°C until analysis. Cows were weighed at calving and every 14 days after morning milking. Body condition score (BCS) was determined by the same two persons on days 1 and 28 of each experimental period, according to Edmonson et al. (Reference Edmonson, Lean, Weaver, Farver and Webster1989). The BCS change and BW change were calculated as the difference between values at the beginning and end of each experimental period.
Blood metabolites
Blood samples were collected after morning milking session at 0, 2, 4, 7, 10, 14, 28, 42, 56, 70 and 84 days in milk. The samples were collected from the coccygeal vein using vacuum tubes for plasma (BD Vacutainer Sodium Fluoride®; 4 ml, Becton Dickinson, Juiz de Fora, Minas Gerais, Brazil) glucose analysis and serum (BD Vacutainer SST II Advance®; 8.5 ml, Becton Dickinson) analysis and were immediately centrifuged at 4°C (3000×g, 15 min). Plasma and serum were stored at −20°C until analysis.
Laboratory analyses
Samples of feeds, orts and feces were oven-dried at 55°C and milled through 2 and 1 mm screens (Wiley mill; A. H. Thomas, Philadelphia, PA, USA) before analyses. Samples of milk were freeze-dried and ground using a mortar and pestle. The DM and organic matter (OM) content of feeds, orts, feces and milk were analyzed using established Association of Official Analytical Chemists International (AOAC) (2005) methods number 930.15 and 942.05, respectively. Nitrogen content of feeds, orts, feces, urine and milk was analyzed according to AOAC (2005) method 984.13. The concentration of NDF of feeds, orts and feces was determined using heat stable α-amylase with a fiber analyzer ANKOM 220 (ANKOM Technology, Fairport, NY, USA), using AOAC (2005) method 2002.04, expressing the results without residual ash. The iNDF content of feeds, orts and feces was analyzed by 288 h of in situ incubations of 2 mm samples, using F57 (ANKOM Technology) bags. Due to the high fat content of the experimental diets and the formation of FA-salts in the rumen, acid hydrolysis with HCl was performed in all feeds, orts and feces before ether extraction (EE) according to AOAC (2005) method 2003.05. More details of the acid hydrolysis are described by Rodrigues et al. (Reference Rodrigues, de Paula, Rennó, Fontes, Machado, de, Valadares Filho, Huhtanen and Marcondes2017). The milk fat content was determined according to American Oil Chemists’ Society (2004) method Am 5-04.
Aliquots of feeds and milk were freeze-dried and milled with mortar and pestle. The FA profile was determined by the method described by Christie (Reference Christie1982), with adaptations by Chilliard et al. (Reference Chilliard, Rouel and Leroux2006). In brief, hexane (2 ml) was added to 130 mg of dried milk followed by 2 ml of 0.5M sodium methoxide solution. This mixture was vortexed and heated at 50°C for 15 min and then 75 µl of 12N HCl was added and allowed to react for 15 min at room temperature. To quantify losses during methylation, the stearic (C18:0) and nonadecanoic (C19:0) FA were used as standards. Fatty acids were quantified by gas chromatography (Shimadzu GC-2010 with automatic injection, Shimadzu Corporation, Kyoto, Japan) using a capillary column (SP-2560; 100×0.25 mm diameter, 0.02 mm thickness; Supelco, Bellefonte, PA, USA). The oven temperature was 70°C for 4 min, then increased at 13°C/min to 175°C and held for 27 min, before a further increase at 4°C/min until reaching 215°C, which was maintained for 31 min. Hydrogen (H2) was used as the carrier gas with a flow of 40 cm3/s. During the identification process, four standards were used to identify the FA formed during the biohydrogenation of unsaturated FA: standard C4-C24 of FA (Supelco® TM 37, Sigma-Aldrich, St. Louis, MO, USA), vaccenic acid t9-18:1 (V038-1G; Sigma-Aldrich), t10,c12-18:2 CLA (UC-61M 100 mg) and c9,t11-18:2 CLA (UC-60M 100 mg; NU-CHEK-PREP, Elysian, MN, USA).
Plasma concentration of glucose (K082) and serum concentrations of triglycerides (K117), cholesterol (K083), high-density lipoprotein (HDL; K071), total protein (K031) and albumin (K040) were measured using kits (Bioclin Diagnostics, Belo Horizonte, Brazil). Low-density lipoprotein (LDL) was estimated according to Friedewald et al. (Reference Friedewald, Levy and Fredrickson1972). Serum concentrations of non-esterified fatty acids (NEFA) was determined by a colorimetric method (FA115; Randox Laboratories Ltd, São Paulo, Brazil) and β-hydroxybutyrate (BHB) was determined by a kinetic enzymatic method based on oxidation of D-3-hydroxybutyrate to acetoacetate (RB1007; Randox Laboratories Ltd). The MUN, blood urea nitrogen (BUN), urinary urea nitrogen (K056), uric acid (K139) and creatinine (K067) were determined using commercial kits (Bioclin Diagnostics). An automatic biochemical apparatus (Mindray BS-200E; Shenzhen Mindray Bio-Medical Electronics Co. Ltd, Shenzhen, China) was used for all above described analyses. Analysis of allantoin in urine and deproteinized milk was performed by colorimetry according to Chen and Gomes (Reference Chen and Gomes1992).
Calculations
The composition of the diets was estimated using the analyzed composition of each ingredient and its proportion in TMR. The DMI and intake of each component was calculated based on the DM weight and analyzed composition of offered diets and orts. The iNDF was used as an internal marker to estimate fecal excretion of each nutrient. Total tract apparent digestibility of each nutrient was calculated as: 100×(intake (g)−excretion (g))/intake (g). The digestible organic matter intake was estimated by multiplying the OM intake by the OM digestibility. The NFC concentration was calculated as NFC = OM−(CP + NDF + EE). The pdNDF was calculated as NDF−iNDF.
The digestible energy intake (DEI) was calculated considering the digested nutrients and their caloric values, as DEI (MJ/kg)=(dNFC × 0.176)+(dNDF × 0.176)+(dCP × 0.234)+(dEE × 0.394), where dNFC is the digestible NFC, dNDF the digestible NDF, dCP the digestible CP and dEE the digestible EE (NRC, 2001). The metabolizable energy intake (MEI) was estimated considering the EE concentration according to NRC (2001) equation (2) to (10). The energy-corrected milk (ECM; kg/day) was calculated as: MP × [(38.3×fat)+(24.2×protein)+(16.54×lactose + 20.7]/3140, where MP is the milk production (kg/day) and fat, protein and lactose in milk units are g/kg (Sjauna et al., Reference Sjauna, Baevre, Junkkarinen, Pedersen and Setälä1990).
Total urine excretion was estimated based on the daily urinary creatinine excretion estimate of 1.06 mmol/kg BW0.75 (Chizzotti et al., Reference Chizzotti, Valadares Filho, Valadares, Chizzotti and Tedeschi2008). Total excretion of purine derivatives was calculated as the sum of allantoin and uric acid excreted in urine and milk. Absorbed purines were calculated from purine derivatives excretion (mmol/day) and BW (kg) using the equation (Verbic et al., Reference Verbic, Chen, MacLeod and Ørskov1990). Microbial nitrogen synthesis in the rumen (MNS) was calculated based on absorbed purines as: MNS (g N/day)=[(70×absorbed purines)/(0.83×RNA-N : N×1000)], where RNA-N : N is the ratio between purine-N and bacterial-N (0.1690±0.0073) described by Rodrigues et al. (Reference Rodrigues, de Paula, Rennó, Fontes, Machado, de, Valadares Filho, Huhtanen and Marcondes2017).
Statistical analysis
Statistical analysis was performed using the SAS MIXED procedure (SAS Institute Inc., Cary, NC, USA, version 9.4) according to a randomized block design:
 $$Y_{{ijklm}} {\equals}\mu {\plus}T_{i} {\plus}B_{j} {\plus}M_{k} {\plus}TM_{{ik}} {\plus}\delta _{{lm}} {\plus}e_{{ijklm}} $$
where μ is the overall mean, T i the fixed effect of treatment, B j the random effect of the parity group (block), M k the fixed effect of the measure, TM ik the fixed effect of the interaction between treatment and measure, δlm the random error between animals within treatment and e ijklm the random error between measurements within animals. Initially, the random interaction between treatments and blocks was included in the model; however, it was removed as it was not significant (P⩾0.27). The model considers the effect of measure (e.g. period, week or day) as a repeated measure considering each cow within a treatment as a subject. The best fitting covariance structures of the repeated measures were chosen according to the lower Akaike’s information criterion with correction. Denominator degrees of freedom were calculated using the Kenward–Roger approximation. The effects of SBO concentrations were tested with polynomial linear and quadratic contrasts. Significance of the effects were declared at P<0.05. When the effect TM ik was significant, the significance of SBO effects was evaluated using the slice statement.
Results
Intake, digestibility and microbial nitrogen synthesis
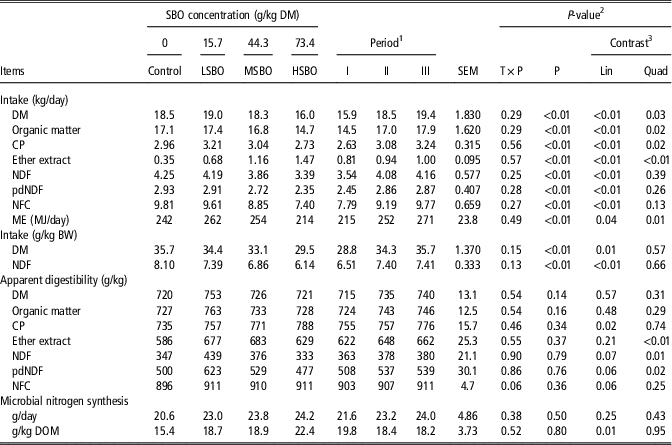
Data for intake, digestibility and MNS are shown in Table 2. No interactions between period and SBO levels were observed for intake and digestibility variables (P>0.06). The period affected all intake variables (P<0.01); however, it did not affect digestibility of nutrients (P>0.05). The DM (kg/day), OM, CP, EE and MEI were quadratically affected (P⩽0.05) by SBO increase. The CP digestibility was linearly affected (P=0.02), while EE, NDF and pdNDF were quadratically affected (P⩽0.02) by SBO inclusion. For the quadratic effect of SBO inclusion on MEI and pdNDF digestibility, the highest values of 262 MJ/day and 623 g/kg, respectively, were observed for LSBO diet, while the lowest values were 214 MJ/day and 477 g/kg for HSBO diet, respectively. Soybean oil inclusion did not affect MNS (P=0.25) but linearly increased efficiency of MNS per unit of digested OM (P=0.01).
Nutrient intake and apparent digestibility in early lactation dairy cows fed sugarcane-based diets with varying concentrations of soybean oil (SBO)

DM=dry matter; LSBO=low soybean oil; MSBO=medium soybean oil; HSBO=high soybean oil; pdNDF=potentially digestible; ME=metabolizable energy; NFC=non-fiber carbohydrates; DOM=digested organic matter.
1 Period: I, IIand III are 14, 42 and 70 days in milk, respectively.
2 T×P=effect of interaction between SBO concentration and period; P=effect of period.
3 Contrasts of linear (Lin) and quadratic (Quad) effect of SBO.
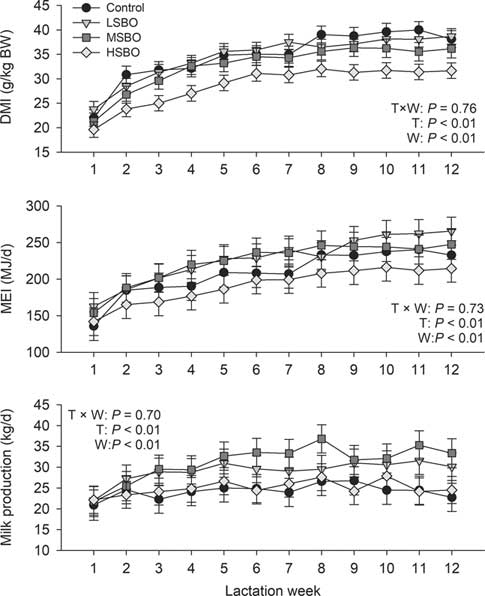
The interaction between lactation weeks and SBO inclusion did not affect (P⩾0.70) DMI, MEI and milk production (Figure 1). Soybean oil inclusion from control up to MSBO diet had greater (P<0.01) DMI than HSBO diet, and the MEI was greater (P<0.01) for LSBO and MSBO diets throughout lactation weeks (Figure 1). Overall, the MSBO and LSBO had greater (P<0.01) milk production than control and HSBO diets (Figure 1).
Weekly dry matter intake (DMI), metabolizable energy intake (MEI) and milk production in early lactation dairy cows fed sugarcane-based diets with varying concentrations of soybean oil (SBO) (low (LSBO), medium (MSBO) and high (HSBO) are SBO at 15.7, 44.3 and 73.4 g/kg of dry matter, respectively; T and W are effects of SBO concentration and lactation week, respectively).

Performance and milk composition
Data for performance and milk FA profiles are presented in Table 3. Milk production and ECM were quadratically affected by SBO increase (P⩽0.04) with the highest values for MSBO and LSBO diets, respectively. The MSBO, followed by LSBO, presented greater milk production than control and HSBO diets (Figure 1). Milk fat concentration decreased linearly (P<0.01) with SBO inclusion, with values 19.6% and 13.2% lower for MSBO and HSBO, respectively, when compared to the control diet. The concentration of FA derived from de novo synthesis in milk fat decreased linearly (P<0.01) with SBO inclusion. The c9,t11-18:2 CLA and t10,c12-18:2 CLA concentrations in milk fat increased linearly (P<0.01) and quadratically (P=0.02), respectively. Feed efficiency was affected by period (P=0.04) but not affected by SBO inclusion (P=0.13). The BW change decreased linearly (P=0.04) when SBO increased. The BCS change was affected by period (P<0.01) but not affected by SBO inclusion (P=0.53).
Production, milk fatty acids (FA) profile and energy balance in early lactation dairy cows fed sugarcane-based diets with varying concentrations of soybean oil (SBO)

DM=dry matter; LSBO=low soybean oil; MSBO=medium soybean oil; HSBO=high soybean oil; ECM=energy-corrected milk production; MUN=milk urea nitrogen; nd=not detected (the contrasts were estimated from LSBO until HSBO); SFA=saturated fatty acids; MUFA=monounsaturated fatty acids; PUFA=polyunsaturated fatty acids; BCS=body condition score.
1 Period: I, II and III are 14, 42 and 70 days in milk, respectively.
2 T×P=effect of interaction between SBO concentration and period; P=effect of period.
3 Contrasts of linear (Lin) and quadratic (Quad) effects of SBO concentrations.
4 Feed efficiency calculated as the ratio of milk production and DM intake.
Blood metabolites
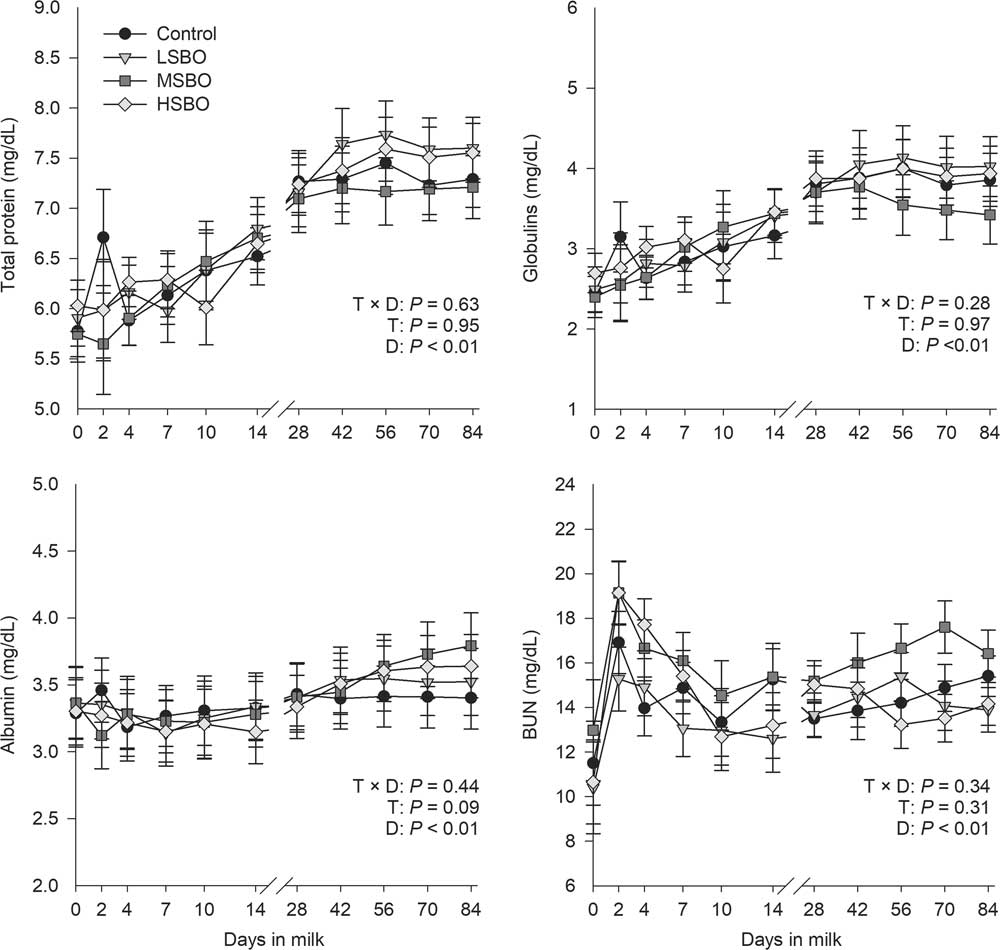
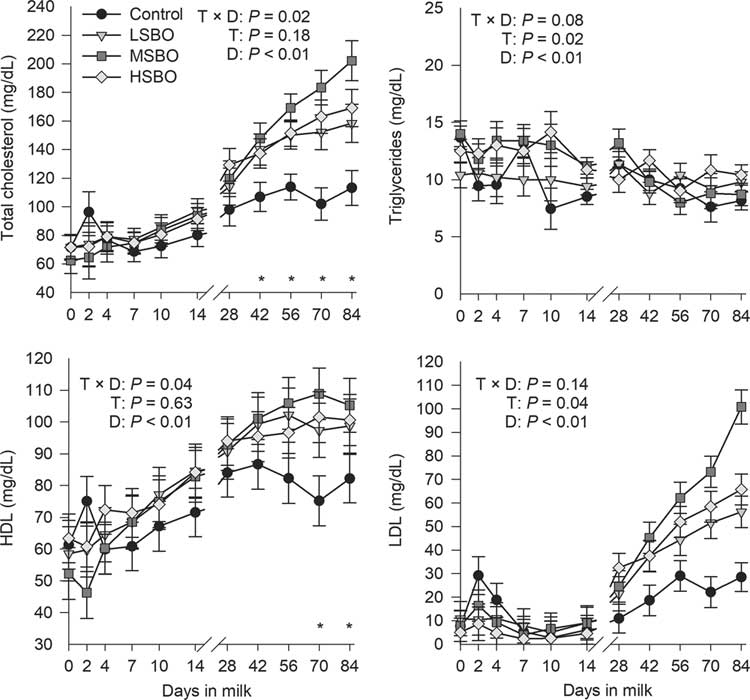
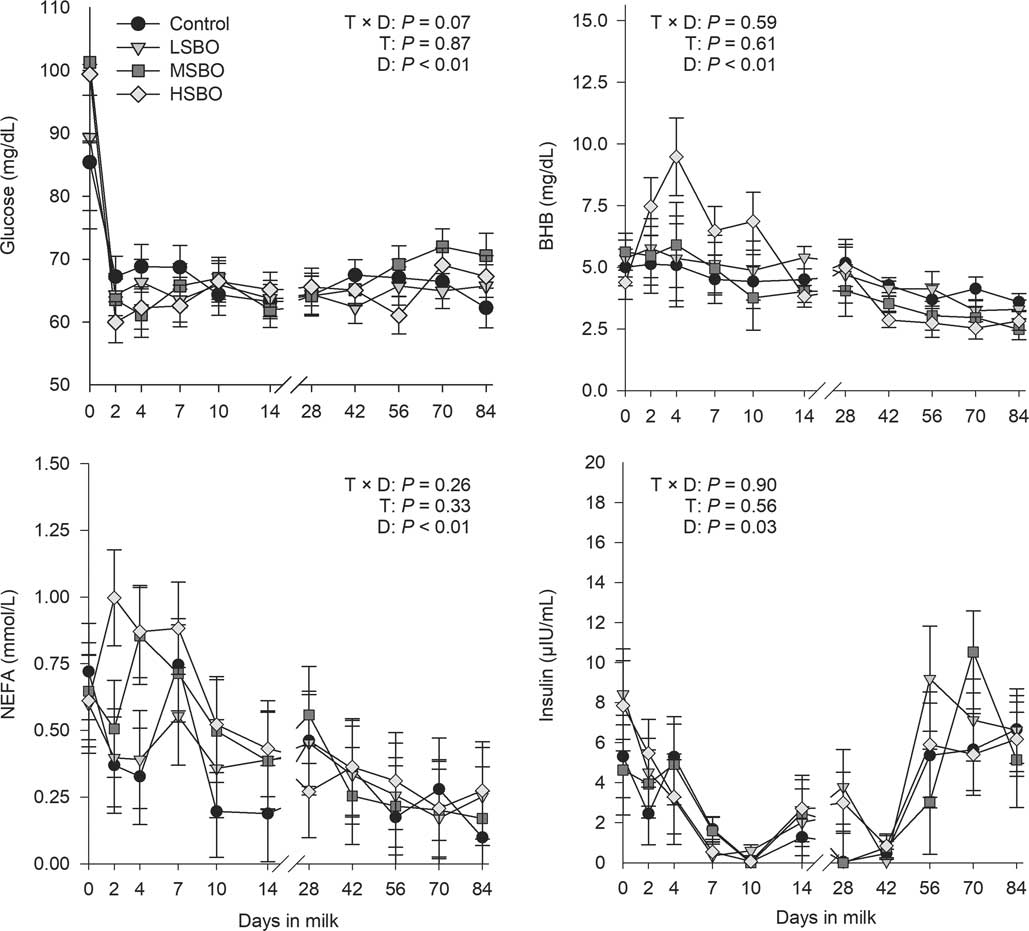
Soybean oil inclusion did not affect serum concentrations of total protein (P=0.95), globulin (P=0.97), albumin (P=0.09) or BUN (P=0.31; Figure 2). The interaction between days in milk and SBO concentration affected serum concentrations of total cholesterol (P=0.02) and HDL (P=0.04; Figure 3). Serum concentrations of total cholesterol and HDL were lower for control diet than SBO supplemented diets (P<0.05) from 42 to 84 and 70 to 84 days in milk, respectively (Figure 3). Soybean oil inclusion increased (P⩽0.04) serum concentrations of triglycerides and LDL (Figure 3). Soybean oil inclusion did not affect blood glucose (P=0.87), NEFA (P=0.33), BHB (P=0.61) or insulin (P=0.56; Figure 4).
Serum concentrations of total proteins, albumin, and globulins and blood urea-nitrogen (BUN) in early lactation dairy cows fed sugarcane-based diets with varying concentrations of soybean oil (SBO) (low (LSBO), middle (MSBO) and high (HSBO) are SBO at 15.7, 44.3 and 73.4 g/kg of dry matter, respectively; T and D are effects of SBO concentration and days in milk, respectively).

Serum concentrations of total cholesterol, triglycerides, high-density lipoprotein (HDL) and low-density lipoprotein (LDL) in early lactation dairy cows fed sugarcane-based diets with varying concentrations of soybean oil (SBO) (low (LSBO), middle (MSBO) and high (HSBO) are SBO at 15.7, 44.3 and 73.4 g/kg of dry matter, respectively; T and D are effects of SBO concentration and days in milk, respectively). *Significant effect of SBO (P<0.05).

Plasma concentration of glucose and serum concentrations of β-hydroxybutyrate (BHB), non-esterified fatty acids (NEFA) and insulin in early lactation dairy cows fed sugarcane-based diets with varying concentrations of soybean oil (SBO) (low (LSBO), middle (MSBO) and high (HSBO) are SBO at 15.7, 44.3 and 73.4 g/kg of DM, respectively; T and D are effects of SBO concentration and days in milk, respectively).

Discussion
In accordance with our hypothesis, SBO inclusion until MSBO diet increased MEI and milk production in early lactation cows fed high-concentrate sugarcane-based diets. This can provide relevant information for a more efficient use of fresh sugarcane in dairy production systems in tropical regions. However, the HSBO diet clearly impaired energy intake, fiber digestion and milk production and composition. Thus, optimal levels of SBO inclusion may be between the LSBO and MSBO diets.
Intake, digestibility and microbial nitrogen synthesis
Adverse effects of supplementation with vegetable oils on DMI can be both a consequence of hormonal regulating factors (Zapata et al., Reference Zapata, Salehi, Ambrose and Chelikani2015) and decrease in fiber digestibility and passage rate in the rumen (Rodrigues et al., Reference Rodrigues, de Paula, Rennó, Fontes, Machado, de, Valadares Filho, Huhtanen and Marcondes2017). In our study, the quadratic effect of SBO supplementation on DMI and pdNDF digestibility indicates potential improvements of fat supplementation on rumen function. In contrast to our results, SBO increase linearly decreased rumen digestibility and digestion rate of pdNDF, even for LSBO diet (Rodrigues et al., Reference Rodrigues, de Paula, Rennó, Fontes, Machado, de, Valadares Filho, Huhtanen and Marcondes2017). However, studies adding vegetable oils at 30 g/kg DM in dairy cow diets with adaptation periods longer than 14 days, as used by Rodrigues et al. (Reference Rodrigues, de Paula, Rennó, Fontes, Machado, de, Valadares Filho, Huhtanen and Marcondes2017), also observed increased NDF digestibility (Ueda et al., Reference Ueda, Ferlay, Chabrot, Loor, Chilliard and Doreau2003; Vazirigohar et al., Reference Vazirigohar, Dehghan-Banadaky, Rezayazdi, Krizsan, Nejati-Javaremi and Shingfield2014). This indicates that longer adaptation periods may be needed to observe improvements in pdNDF digestibility when supplementing vegetable oils at lower concentrations, such as in the LSBO diet. The increased pdNDF digestibility with SBO inclusion can be a consequence of decreased subacute rumen acidosis caused by replacing NFC by unfermentable substrates. This replacement can be highlighted as a useful strategy for formulating diets with fresh sugarcane as the main forage, which is intrinsically high in sucrose and with lower fiber digestibility than conventional forages, such as corn silage (Oliveira et al., Reference Oliveira, Detmann, Campos, de, Pina, dos, Souza and Costa2011). Besides this, the decrease in NFC concentration is important mainly in diets with high proportions of concentrate, which is usual for dairy cows in early lactation fed low quality forages.
Besides effects on fiber digestion, SBO addition in LSBO and MSBO diets increased MEI, most likely due to greater energy metabolizability of dietary EE rather than carbohydrates (NRC, 2001). The adverse effects of HSBO diet on DMI and OM digestibility explain its greater efficiency of MNS; however, mainly due to decreased fiber digestibility. Supplementation with vegetable oils have little influence on rumen MNS and changes in the efficiency of MNS as a consequence of fat supplementation are mainly associated with the decrease in rumen fermented OM (Doreau and Ferlay, Reference Doreau and Ferlay1995). Overall, SBO supplementation greater than the MSBO diet decreased DM and ME intake and pdNDF digestibility. Thus, MSBO can be considered the upper limit and, due to greater intake and digestibility values for LSBO, probably the optimal level to improve energy intake is between these diets.
Performance and milk fatty acid profile
Both control and HSBO diets can be considered as extreme diets due to their high NFC and EE concentrations, respectively. The weekly variation in milk production clearly demonstrates that control and HSBO diets did not follow LSBO and MSBO, mainly after the third lactation week. The lower milk production, ECM and BW change for HSBO diet indicates that its adverse effects on intake and digestion impaired performance and intensified the negative energy balance. Greater milk production and ECM were observed for MSBO and LSBO diets, respectively, which also demonstrates potential improvements of SBO inclusion on performance, probably as a consequence of increased DMI and MEI. Indeed, prediction models suggest that fat supplementation at about 35 to 40 g/kg of DM can increase ECM production (Huhtanen and Nousiainen, Reference Huhtanen and Nousiainen2012). The models proposed by Huhtanen and Nousiainen (Reference Huhtanen and Nousiainen2012) also indicated that increased milk production and ECM by fat supplementation can be a consequence of decreased dietary NFC concentration, mainly when greater than 350 g/kg DM as observed in our study. Divergent greater milk production and ECM production for LSBO and MSBO do not allow us to indicate the most promising inclusion rate; however, similar for intake variables, probably the most promising SBO concentration may be between them.
The ECM did not follow greater milk production for the MSBO diet, mainly due to milk fat depression. The effects of fat supplementation on milk fat have been widely described in the literature, and in our study may be mostly derived from the formation of t10,c12-18:2 CLA in the rumen (Rodrigues et al., Reference Rodrigues, de Paula, Rennó, Fontes, Machado, de, Valadares Filho, Huhtanen and Marcondes2017), which can decrease de novo synthesis and lipogenic activity in mammary glands (Shingfield et al., Reference Shingfield, Bernard, Leroux and Chilliard2010). The t10,c12-18:2 CLA in milk was detected only for MSBO and HSBO diets, which had lower concentrations of fat. An increased concentration of c9,t11-18:2 CLA in milk fat is desirable due to its potential beneficial effects on human health (Dilzer and Park, Reference Dilzer and Park2012). As LSBO and MSBO diets resulted in greater c9,t11-18:2 CLA, they can be highlighted as better options than control and HSBO when aiming to produce healthy dairy products. For instance, SBO supplementation at 26 g/kg DM, which is between LSBO and HSBO diets, can result in products with a lower thrombogenic index (Vargas-Bello-Pérez et al., Reference Vargas-Bello-Pérez, Fehrmann-Cartes, Íñiguez-González, Toro-Mujica and Garnsworthy2015). Thus, SBO supplementation between LSBO and MSBO can be beneficial not only for intake, digestion and performance, but also for the milk FA profile.
Blood metabolites
The absence of SBO effects on serum total protein, albumin, globulins and BUN was expected due to the adequate CP availability among diets. However, serum concentrations of total cholesterol and triglycerides, which are related to FA transport, were increased by SBO increase. In agreement with our results, Ye et al. (Reference Ye, Wang, Wang, Ye, Wang, Liu, Wang, Yang and Liu2009) observed an increase in total cholesterol and triglycerides when supplementing SBO for dairy cows at 20 g/kg DM. Blood LDL coupled with chylomicrons are responsible for transporting triglycerides, and hypercholesterolemia is a common physiological state in ruminants fed high amounts of fat (Bauchart, Reference Bauchart1993). This indicates that in our study the cow’s cholesterol metabolism was altered to improve transport of FA from the gut. The observed absence of SBO effects on plasma glucose, and serum BHB and NEFA, are in agreement with other studies supplementing with vegetable oils in dairy cows (Abdelqader et al., Reference Abdelqader, Hippen, Kalscheur, Schingoethe and Garcia2009). Supplementation with vegetable oils is known for a short-term decrease in serum insulin (Benson et al., Reference Benson, Reynolds, Aikman, Lupoli and Beever2002). In our study, the absence of an SBO effect on serum insulin may be related to the longer supplementation period and diet composition, which in our study had higher concentrations of NFC and energy availability. Although not significant, it is important to note the numerical peaks of NEFA and BHB for HSBO diet at 2 and 4 days in milk, respectively, which reinforce the effect of this diet on intensifying the negative energy balance. Overall, until MSBO diet the metabolism of dairy cows was not extremely affected, with only the HSBO as a potential risky inclusion rate.
Our results support the use of SBO supplementation as a strategy to improve energy intake, digestion and performance of dairy cows in early lactation; however, optimum levels may be between LSBO and MSBO diets. However, our results cannot be extrapolated for other tropical forage species. For instance, the adverse effects of SBO can be dependent on forage species for fiber digestibility (Rodrigues et al., Reference Rodrigues, Ramin, Huhtanen, Aru, Detmann and Marcondes2018) or milk FA composition (Sterk et al., Reference Sterk, Van Vuuren, Hendriks and Dijkstra2012). Thus, studies evaluating fat supplementation in diets based on other tropical forages are needed, and the optimum SBO inclusion rates between LSBO and MSBO, observed in our study, can support the design of future research.
Conclusions
Soybean oil inclusion at 15.7 g/kg of DM in sugarcane-based diets for early lactation dairy cows improve energy intake, milk production and CLA concentration without adverse effects on digestibility and milk fat concentration and metabolism. Although SBO inclusion at 44.3 g/kg DM had greater milk production, it markedly decreased milk fat concentration and ECM, and should be used cautiously. Soybean oil inclusion at 73.4 g/kg DM adversely affect energy intake, fiber digestion, performance and metabolism of early lactation dairy cows and is not recommended.
Acknowledgements
This study was supported by CNPq through funding of field and laboratory activities (479384/2013-4) and scholarships to J.P.P.R. at Federal University of Viçosa (141562/2013-7) and Swedish University of Agricultural Sciences (201754/2015-0). The INCT-CA, CAPES and FAPEMIG also supported this research. the authors thank Dr Pekka Huhtanen for advising J.P.P.R. and support with data analysis. This work was conducted as part of one of the first author’s PhD thesis.
Declaration of interest
The authors declare no conflicts of interest.
Ethics statement
The Committee of Production Animal Care and Use of the Federal University of Viçosa approved all animal feeding, management and procedures involved in this study (Protocol no. 072/2014).
Software and data repository resources
None of the data were deposited in an official repository.