Introduction
Studies of voter support for various policies, whether alcohol prohibition or other policies, generally assume that voter decisions are motivated entirely by substantive policy preferences. For instance, do voters support or oppose legalizing alcohol? This is a safe assumption when analyzing survey or referenda results in unitary political systems where decision making is centralized at one governmental level and there are no choices to be made regarding which of various levels of government should regulate a given policy. But in a federal system such as the United States, where some policies are regulated at the national level, others are determined at the state level, and still others are worked out in localities, voters have two sets of decisions to make when voting on a policy proposal. Voters have to consider not only whether they support a policy as a substantive matter (e.g., whether to prohibit alcohol) but also whether they prefer that a policy be regulated at the national level, by states, or even in localities. Therefore, when interpreting survey or referenda results on certain proposals at one governmental level, it is important to allow for the possibilities that these results may be picking up preferences on two different dimensions: substantive policy preferences and decentralization preferences.
Several recent studies have demonstrated the existence and importance of voter preferences regarding centralization/decentralization. The existence of these preferences is supported in part through experimental studies (Kam and Mikos Reference Kam and Mikos2007; though see Jacobs Reference Jacobs2017 for mixed evidence of such preferences). Individual preferences regarding intergovernmental responsibility for regulating policies are also evident in survey-based studies (Schneider and Jacoby Reference Schneider and Jacoby2013; Schneider et al. Reference Schneider, Jacoby and Lewis2011; Wolak Reference Wolak2016).
Other developments suggest that preferences regarding centralization/decentralization may influence voting on alcohol measures in particular. For instance, Arkansas voters recently rejected, by a 57–43 percent margin, a 2014 citizen-initiated ballot measure that would have replaced the current local-option policy, whereby decisions on alcohol prohibition are made at the county level, with a statewide policy permitting alcohol sales in every county. Amendment opponents argued not only that it would lead to wider availability of alcohol (signifying a policy preference) but also that it would deprive local communities of the opportunity to resolve these questions (signifying a decentralization preference) (Parr Reference Parr2014; Richman Reference Richman2014).
The strongest evidence that decentralization preferences play a role in voting on alcohol measures comes from the 1930s in votes taken during and after federal Prohibition. Voters in a number of states cast separate votes on whether to repeal federal Prohibition and then whether to prohibit or permit alcohol on a statewide basis and sometimes on whether to permit the legality of alcohol to be determined in particular counties or municipalities. For instance, voters in Alabama supported repeal of federal Prohibition in a 1933 referendum but opposed repeal of state prohibition in a 1935 referendum. This would seem counterintuitive for voters to favor alcohol legality across the nation but not in their own state. An alternative interpretation is that many voters in Alabama opposed federal regulation, believing it better for states or localities to decide this issue for themselves. Two years later, the Alabama state legislature permitted voters in particular counties to decide on legalizing alcohol in a 1937 referendum. In Alabama, therefore, and in some other states in the 1930s, individuals voting on federal Prohibition referenda and state prohibition referenda were led to consider whether they supported legalization of alcohol and also whether they wanted this decision to be made by the federal government or by state governments or localities. Some voters may have preferred policy to be made at a more local level, out of a belief that local officials are more responsive to citizen preferences and local policy making can better consider heterogeneity of citizen preferences. Other voters may have preferred more centralized decision making to secure uniformity of policy outcomes.
Separating policy preferences from decentralization preferences may not be straightforward. Yet failure to do so may impede interpreting empirical evidence determining which groups supported wet or dry policies, even aside from standard ecological fallacy issues. For example, certain voters may support federal repeal despite their opposition to alcohol availability, if their preference for decentralization outweighs their opposition to alcohol. These voters might then be misinterpreted to be supporters of wet policies based on simple examination of their votes. For example, only two states (North Carolina and South Carolina) that held referenda on repealing federal Prohibition failed to generate majority support for repeal. An overly simplified classification would render only these two states as majority dry supporters (along with possibly other states that refused to even hold a referendum) and the other states to all be majority wet supporters. As the case of Alabama makes clear, this may not be true.
Empirical studies have used aggregate county voting returns on state-level prohibition or repeal to test theories regarding preferences for wet or dry policies, by correlating county-level support to county demographics (Dinan and Heckelman Reference Dinan and Heckelman2005; Endersby Reference Endersby2012; Lewis Reference Lewis2008; Wasserman Reference Wasserman1989, Reference Wasserman1990).Footnote 1 The usual ecological fallacy arguments still apply, but Catholics and immigrants have been identified by the authors as key supporters of wet policies in nearly all studies. Some studies have also found that urban residents, Democrats, and higher-income earners supported wet policies, especially during the debate about prohibition repeal in the 1930s. Meanwhile, several studies have identified residents of rural counties and members of evangelical denominations as leading supporters of dry policies, although these findings regarding evangelicals were not borne out in a study examining repeal of federal Prohibition (Dinan and Heckelman Reference Dinan and Heckelman2014).
None of these studies consider the impact of decentralization preferences on voter support for alcohol prohibition, however. While it is important to do so, one difficulty is in finding a reasonable measure for decentralization preferences during the Prohibition era to be able to separate out these effects. To this end, we exploit a combination of referenda unique to the November 1933 Ohio ballot. As in most other states, Ohio voters were able to express their support for the Twenty-First Amendment to the US Constitution, which brought an end to federal alcohol prohibition. In submitting the Twenty-First Amendment for state ratification, Congress took advantage for the first, and thus far only, time of an option in Article V of the US Constitution whereby a federal amendment can be ratified in conventions in the states rather than by state legislatures. Ohio was one of 37 states to hold statewide elections between April and November 1933 to select delegates to these ratifying conventions. Along with many other states, the 1933 Ohio election also featured a vote on a state constitutional amendment to repeal its state prohibition. What is special about the 1933 Ohio election ballot is that it also featured a county home-rule amendment. We use the county home-rule referendum, where voters registered support or opposition to empowering counties to draft their own charters rather than relying on the state legislature to develop them, as a proxy for decentralization preferences. Admittedly, this falls short of a perfect test. An ideal measure might register voters’ preferences for devolving policy to localities and fostering a diversity of policy outcomes in contrast to a centralizing policy authority and thereby standardizing policy outcomes. But in the absence of a referendum in any state that posed this question so starkly, home-rule referenda are the best proxy that we have for voters’ preferences on decentralization in the early twentieth century.
As we show, controlling for decentralization preferences changes some findings regarding voter preferences for wet and dry policies and helps explain some anomalies regarding determinants of support for Prohibition and its repeal. These efforts to disentangle substantive policy preferences and decentralization preferences might also be useful in other policy areas where scholars have drawn lessons from survey or referenda data but without accounting for the role of decentralization preferences.
Review of the Literature
Scholars in recent decades have analyzed county-level election returns on referenda held in the late 1800s and early 1900s to adopt statewide prohibition. In some states during this time, legislatures simply passed prohibition statutes without submitting them to a popular referendum. But prohibition measures were generally submitted to a popular vote, whether because legislators thought such a controversial policy should have the support of the people expressed in a direct fashion or because prohibition measures were framed as constitutional amendments, which in all but one state (Delaware) must be ratified by citizens.
Alcohol prohibition referenda, especially referenda held in 30 states in the 1900s and 1910s (Lewis Reference Lewis2008: 382), have been the subject of several studies that have generated conclusions about which groups supported wet or dry policies. Most scholars have examined elections in a single state: Iowa in 1917 (Ryan Reference Ryan1983), Missouri in 1918 (Wasserman Reference Wasserman1989), California in 1918 (Wasserman Reference Wasserman1990), and Texas in 1919 (Endersby Reference Endersby2012). Lewis (Reference Lewis2008) undertook the most comprehensive study, drawing on county-level returns in referenda in 28 states between 1900 and 1919.
Although most studies have analyzed adoption of Prohibition, some have focused on repeal. Upon adoption of the Eighteenth Amendment to the US Constitution in 1919, the sale and manufacture of alcohol was prohibited nationwide. When support for Prohibition declined in the early 1930s, opponents persuaded Congress to approve the Twenty-First Amendment and submit the amendment for ratification in state conventions held in 1933. Delegates to these Twenty-First Amendment ratifying conventions were, in most states, chosen in statewide elections where voters also generally cast votes instructing delegates to either approve or reject the amendment. Munger and Schaller (Reference Munger and Schaller1997) and Dinan and Heckelman (Reference Dinan and Heckelman2014) analyzed state-level election results on voting to repeal the federal Prohibition amendment. Other studies analyzed county-level returns on prohibition-repeal measures in the 1930s, whether the federal repeal amendment (Endersby Reference Endersby2012) or state repeal measures in Oregon (Dinan and Heckelman Reference Dinan and Heckelman2005) or Texas (Endersby Reference Endersby2012).
These studies have reached broadly consistent conclusions about certain determinants of prohibition support and opposition but have arrived at conflicting conclusions in other respects. Most studies have found that areas with high numbers of immigrants supported wet policies, whereas areas with high numbers of native-born Americans backed dry policies (Dinan and Heckelman Reference Dinan and Heckelman2005; Endersby Reference Endersby2012; Ryan Reference Ryan1983; Wasserman Reference Wasserman1989, Reference Wasserman1990). Areas with a large number of Catholics have also been shown in most studies to back wet policies (Dinan and Heckelman Reference Dinan and Heckelman2014; Wasserman Reference Wasserman1989).
Scholars have reported mixed results regarding preferences of evangelicals, generally understood as encompassing Baptists, Methodists, and Presbyterians and occasionally other denominations such as Disciples of Christ. Several studies focusing on the 1900s and 1910s found that areas with high numbers of evangelicals were more likely to support adoption of state prohibition (Lewis Reference Lewis2008; Wasserman Reference Wasserman1989, Reference Wasserman1990). But studies focusing on prohibition repeal in the 1930s have reached mixed conclusions, with one analysis of a state repeal amendment finding that areas with high numbers of evangelicals were more likely to oppose repeal (Dinan and Heckelman Reference Dinan and Heckelman2005) but an analysis of the federal repeal amendment not finding a significant relationship between evangelical populations and opposition to repeal (Dinan and Heckelman Reference Dinan and Heckelman2014).
Studies have also reached mixed conclusions about other factors, depending in part on whether the focus is on adoption of Prohibition or its repeal. In terms of class differences, scholars have generally found that areas with high numbers of lower-class voters opposed adoption in the 1910s and supported repeal in the 1930s (Endersby Reference Endersby2012); but areas with large numbers of upper-class voters have been shown, in one case, to have supported adoption (Endersby Reference Endersby2012) and, in another study, to have supported repeal (Dinan and Heckelman Reference Dinan and Heckelman2014). In terms of income differences in particular, although the poor were generally thought to favor alcohol legalization, it has been argued that by the 1930s the wealthy started to view legalization and taxation of alcohol as an alternative means to help stave off the growing threat of a potential federal income tax (Okrent Reference Okrent2010). As for partisanship, studies have found no connection between support for the Republican Party and adoption of prohibition in Iowa in 1917 (Ryan Reference Ryan1983) or Missouri in 1918 (Wasserman Reference Wasserman1989) or its repeal in Oregon in 1933 (Dinan and Heckelman Reference Dinan and Heckelman2005); but a borderline significant correlation was found regarding presidential party voting and support for federal repeal across 37 states (Dinan and Heckelman Reference Dinan and Heckelman2014).
Scholars have also reached a range of conclusions about preferences of voters in urban and rural regions. Some studies analyzing enactment of state prohibition found that when controlling for other factors, urban areas were more supportive of wet policies and rural areas were more supportive of dry policies (Endersby Reference Endersby2012). Some other studies of prohibition repeal reached similar conclusions (Dinan and Heckelman Reference Dinan and Heckelman2005, Reference Dinan and Heckelman2014). But other studies have concluded that when controlling for immigrant population, urban/rural residence is not correlated in a significant fashion with support for wet and dry policies. This is a central finding of Wasserman (Reference Wasserman1989, Reference Wasserman1990) based on particular state prohibition referenda in the 1910s. Lewis (Reference Lewis2008) reaches a similar conclusion in his multistate study of prohibition enactment in the 1900s and 1910s. Endersby (Reference Endersby2012) concluded that whereas urban/rural residence was significant in explaining adoption of prohibition in the 1910s, it was not significant in explaining repeal in the 1930s.
None of these studies took account of voters’ decentralization preferences when advancing conclusions about voters’ support for wet and dry policies. Dinan and Heckelman speculated that some groups may have decentralization preferences that could account for some of the conflicting conclusions in these studies. Focusing on the behavior of evangelical voters, “[F]rom a fiscal federalism standpoint, evangelicals may have preferred control at the local level and therefore were more willing to support state than federal regulations” (2014, 650). But no formal testing was presented. We undertake an inquiry along these lines here, focusing on votes on prohibition repeal in Ohio in 1933 and making use of a vote on county home rule in the same election, which allows us to separate prohibition preferences from decentralization preferences.
Ohio’s 1933 Votes on Prohibition and Home Rule
Ohio’s November 7, 1933 election featured votes on five ballot questions. Three are of particular interest for this study. Ohio voters had an opportunity, first, to vote on a slate of delegates to a state convention charged with determining whether to ratify the Twenty-First Amendment to the US Constitution and instructing delegates to either support the amendment (to end federal Prohibition) or oppose it (so as to continue federal Prohibition). Ohio voters also considered four statewide measures at the same election. Next on the ballot, after the federal amendment, was a legislature-referred state constitutional amendment to repeal the state prohibition amendment adopted in 1918, a year before adoption of the federal Prohibition amendment. That is, passage of the Twenty-First Amendment only repealed federal Prohibition and left it to states to decide how to regulate alcohol; the purpose of this 1933 state constitutional amendment was to repeal state prohibition. Ohio was one of many states that had in place such a state prohibition amendment or statute dating in most cases to the 1910s. The question for voters in Ohio and other states in the 1930s was whether to keep statewide prohibition or repeal the policy. In fact, some states chose to retain state prohibition for some time after repeal of federal Prohibition; Mississippi did not repeal state prohibition until 1966 (McGirr Reference McGirr2016: 249). In other states voters chose to repeal state prohibition with the expectation in many, though not all, cases that the legislature would follow up by adopting a local-option policy, whereby residents of counties could decide whether to permit alcohol sales within their jurisdiction. In short, there were various options on the table in the 1930s and subsequent years regarding the degree to which alcohol policy was centralized and uniform at the state level or rather was decentralized to the local level and in ways that permitted a diversity of outcomes within the state.
Also on the Ohio ballot, in order of appearance, were three other state measures: a property-tax limit, a county home-rule measure, and an old-aged pension program. Taking up each of these in turn, a citizen-initiated amendment sought to reduce the existing limit on the property tax from 1.5 percent to 1 percent of the value of the property. Another citizen-initiated amendment sought to allow counties to frame and amend their own charters.Footnote 2 Finally, a citizen-initiated statute proposed to grant a pension to all persons above the age of 65 with annual incomes of less than $300.
Returns published in Election Statistics of 1934 indicate that all five measures passed, albeit by varying margins and with varying degrees of voter participation.Footnote 3 Overall support and turnout for federal repeal were both slightly stronger than for state repeal. Federal repeal passed 71.2 percent–28.8 percent while state repeal passed 68.4 percent–32.2 percent. Thus, at least some voters voted in support of the former but not the latter. This is consistent with two implications. Either some voters simultaneously favored federal repeal while wanting their own state to remain dry, thus splitting their vote across the two referenda, or had no preference on policy regarding alcohol but felt the decision should not be determined by the federal government, thereby voting for federal repeal but abstaining from the state vote. We therefore analyze both voter support for state repeal and voter turnout on the state repeal question.
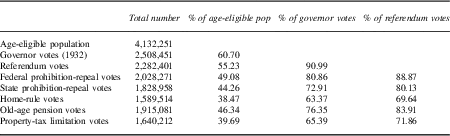
As shown in table 1, roughly half of the age-eligible population voted on federal repeal, a slight drop-off from the gubernatorial voter turnout rate of 60 percent the previous year. Although fewer persons voted on state prohibition repeal, and roll-off was greatest on home rule, this is not simply a case of voter fatigue. The old-age pension vote was next to last on the ballot but featured the highest turnout levels of all the state measures, despite resulting in the most lopsided outcome of all the referenda (passing by a margin of 72.5 percent–27.5 percent). Furthermore, more than 250,000 people voted on at least one of the other referenda without casting a vote on federal repeal.
Statewide turnout statistics

County Data for Determinants of State Repeal
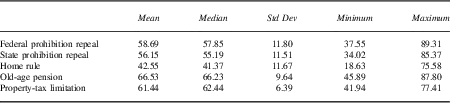
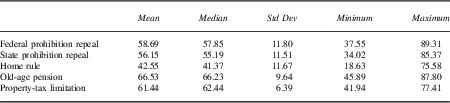
As mentioned previously, Ohio voters considered measures repealing federal and state prohibition in the same election. Even though both measures passed with more than two-thirds support rates, due to distributional asymmetries the average county-level support was significantly lower than the overall level of support, with both the mean and median levels falling below 60 percent for both measures. Distributional asymmetries appeared for all the referenda. In fact, the home-rule referendum passed by an overall margin of 53 percent–47 percent, yet both the mean and median level of support for home rule across the counties was just more than 40 percent. See table 2.
County-level referendum support descriptive statistics (N=88)
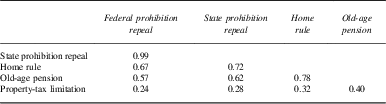
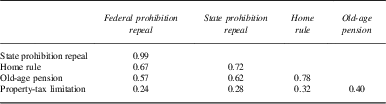
Although support for federal repeal was slightly higher overall than for state repeal (71 percent vs. 68 percent), the county-level correlation between the two is .99, suggesting it makes little difference which is used in regression analysis as our measure of repeal support. We present regression estimates based on state repeal, and from this point forward all references to prohibition repeal refer to the state repeal referendum unless otherwise specifically noted. Correlations at the county level for all referenda in the 1933 election are presented in table 3. Support for the property-tax limitation consistently shows the lowest correlations among any of the pairwise referenda considerations.
County-level referendum support correlations (N=88)
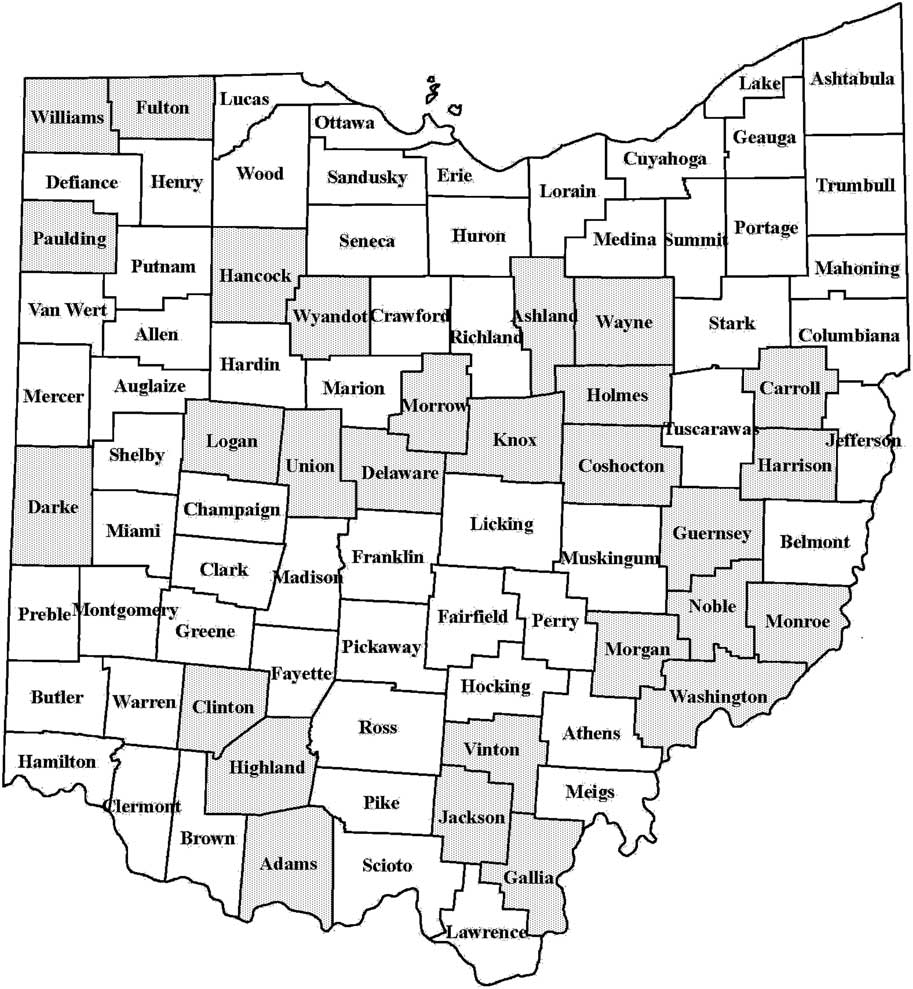
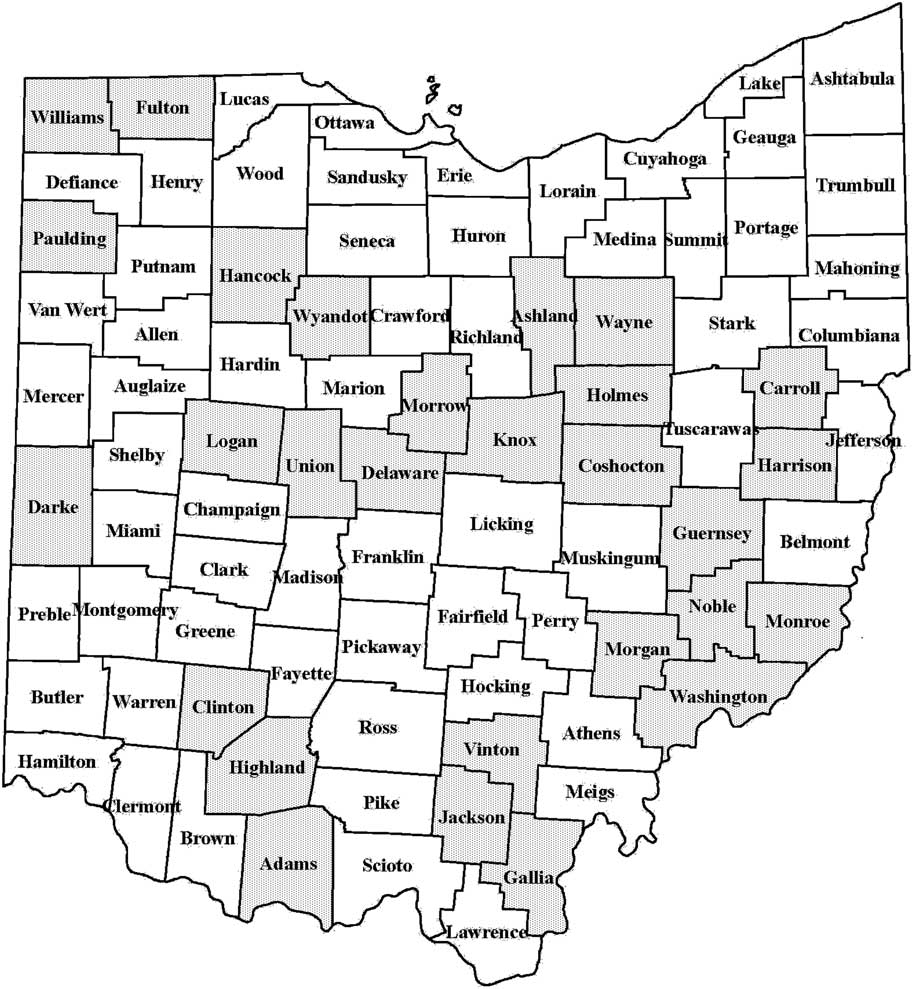
As shown in figure 1, although state repeal passed by a wide margin there was quite a bit of variation in support levels across the 88 counties.Footnote 4 In fact, one-third of the counties did not support repeal. These 28 counties are highlighted by shading in the map. Overall support ranges from a low of 34.0 percent in Morgan County to a high of 85.4 percent in Hamilton County, which includes Cincinnati. Otherwise, there appears to be little geographic concentration in support levels. Although Morgan County borders two other minority-support counties, one of them is basically split at 49.4 percent (Washington) and the three other bordering counties are all majority support. Hamilton is the most southwestern county, and the next three highest levels of support are clear across the state in the northernmost region: Lucas, Cuyahoga, and Erie, but none border each other, and Lucas even borders a minority-support county. The two counties closest to a toss-up are Greene (50.4 percent) and Washington (49.4 percent), and these counties are separated by several strongly supportive counties.
Support for state prohibition repeal in Ohio counties (counties <50 percent shaded).
To explain county-level variation in support for repeal, we include variables similar to that of Dinan and Heckelman (Reference Dinan and Heckelman2014) in a study of state-level support on federal repeal. That study included measures for gender, urbanization, immigration, wealth, partisanship, and religion. This guides our general specification design, but we modify a couple of those measures and also supplement that specification with an additional variable. Basic demographic data, including the number of females, urban residents, and foreign born in each county, are taken directly from the 1930 Census and converted to percentages of the total population. County-level income per capita data do not exist for this period, so we instead proxy wealth by the total value of assessed property in the county. Another change we made is rather than rely on presidential elections, which happen to be landslides in both 1932 and 1928, to measure partisanship, we utilize the Democratic vote share in the Ohio governor contest in the 1932 election, won by Democratic incumbent George White by a margin of 54 percent–46 percent.
Religion is captured by the percentage of Catholic and percentage of evangelical residents in each county. Our definition of evangelicals includes not only Baptists, Methodists, and Presbyterians, but also Disciples of Christ who represented a nontrivial portion (12 percent) of Ohio’s evangelical Protestants. In a study of Oregon, Dinan and Heckelman (Reference Dinan and Heckelman2005) found each of these groups to significantly oppose state prohibition repeal.
Religious data were not collected in the 1930 Census, but a special census of all religious bodies was conducted in 1926. This census separately enumerates eight Baptist sects, seven Methodist sects, and seven Presbyterian sects (among many others) that we initially group together with the population of Disciples, but also run supplemental regressions in which each of these major groups are kept distinct. We also separately tally the number of Catholics included in the special census.
Endersby (Reference Endersby2012) found that the percentage of illiterates was positively correlated with support for repeal in Texas counties. Previous studies had used illiteracy as a proxy for wealth or class (e.g., Wasserman Reference Wasserman1989) but Endersby found it to be statistically significant even when controlling for other proxies of county wealth (based on crop and retail values). We therefore also include the proportion of illiterates in the county, using data from the 1930 Census. Values range from 0.5 percent in Ashland and Morrow counties to 8.4 percent in Pickaway County.
Regression Analysis on Support for State Prohibition Repeal
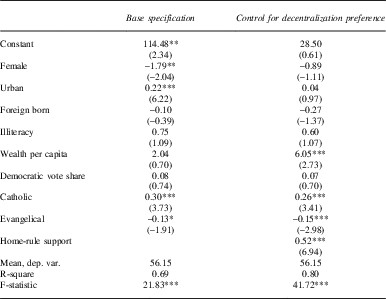
Regression results from OLS estimates with t-ratios based on heteroskedastic-corrected standard errors are presented in table 4, where the dependent variable represents the county-level percentage of votes in favor of state prohibition repeal.Footnote 5 Controlling for other factors, we find that counties with larger female populations were statistically significantly less likely to support repeal, consistent with Dinan and Heckelman’s (Reference Dinan and Heckelman2005) results on repeal support in Oregon. The marginal impact is also quite large, as a 10 percentage point increase in the female ratio corresponds to an 18 percentage point reduction in support for repeal. We also find that urban counties were significantly more likely to support repeal even when controlling for immigrant population, consistent with Dinan and Heckelman (Reference Dinan and Heckelman2005, 2014). This variable generates the highest level of statistical significance and largest overall impact as determined by the standardized coefficient estimate, contrasting with Endersby (Reference Endersby2012) who found a lack of statistical significance for the percent urban variable in Texas counties on federal repeal and found it was only weakly statistically significant for state repeal with only a modest marginal impact on support levels.
County-level support for state prohibition repeal (t-ratios)
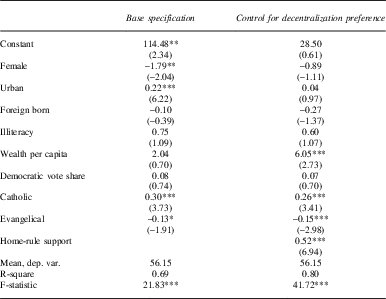
* significant at ≤10%; ** significant at ≤5%; *** significant at ≤1%.
Controlling for the other factors, we do not find either the share of the population that is foreign born or illiterate, the wealth of the county, or support for the Democratic Party in the most recent gubernatorial election to be important in explaining variation in repeal support. These variables are neither individually nor jointly statistically significant and their standardized coefficient estimates are all less than 0.1.
The percent Catholic in a county is, however, strongly related to repeal support, consistent with most previous studies. Although we find that counties with greater levels of evangelicals have lower levels of support for repeal, the marginal impact is small and only borderline statistically significant, falling between the strong association found in a study of repeal in Oregon (Dinan and Heckelman Reference Dinan and Heckelman2005) and the lack of association found in a study of federal repeal (Dinan and Heckelman Reference Dinan and Heckelman2014). In Ohio, a 10 percentage point increase in the evangelical population reduced county support for repeal by an average of only 1.3 percentage points.
As described previously, our evangelical measure comprises four broad sects: Baptists, Methodists, Presbyterians, and Disciples. It could be that our weak finding regarding the evangelical impact could be due to heterogeneous effects among the differing sects (Dinan and Heckelman Reference Dinan and Heckelman2005). We investigate this possibility by disaggregating the evangelical population into its separate sects. In this specification we find that only the Methodist category is statistically significant with a one standard deviation change in the Methodist population corresponding to a .25 standard deviation change in repeal support, whereas none of the other religious categories come close to statistical significance and generate standardized coefficients that are one-half to one-fourth that of the Methodist category. None of the other regression variables are affected by this change to the specification.
One might interpret these results as suggesting that urban residents and Catholics were significantly more likely to support wet policies whereas women and evangelicals, in particular Methodists, supported dry policies. Our concern, however, is that preferences regarding Prohibition reflect views regarding both alcohol and decentralization.
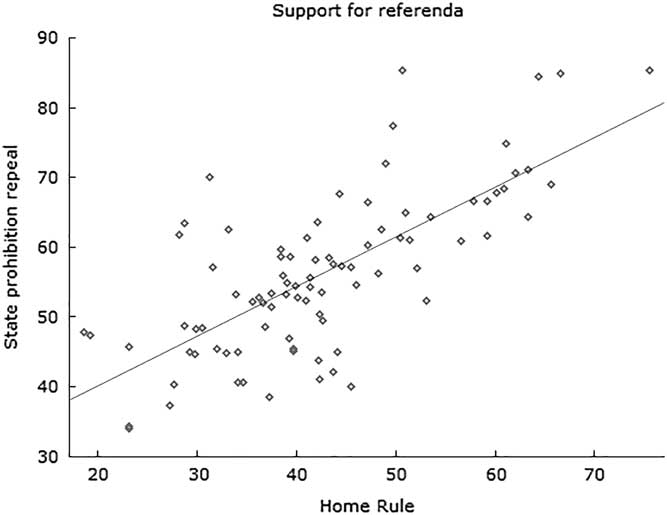
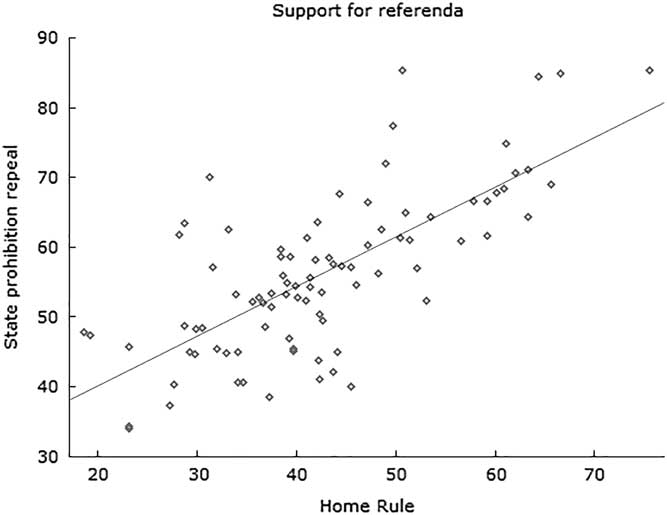
In contrast, it is reasonable to expect that support for home rule strictly reflects preferences regarding decentralization. Note that in 21 of the counties where majorities opposed repeal (shaded in figure 1) majorities also opposed home rule, and in only seven of the counties where majorities supported repeal did majorities oppose home rule. In the remaining 60 counties majorities supported both measures. There is a strong positive correlation of .72 between county support for home rule and for state prohibition repeal, as depicted in figure 2.
Scatter plot of county-level support for state prohibition repeal and home rule.
To better isolate preferences regarding alcohol, we next control for decentralization preferences by including the county vote share that supported home rule as an additional independent variable. That is, by treating support for home rule as a measure of support for decentralization in general, we are better able to determine the degree to which support or opposition to prohibition repeal can be attributable to preferences regarding standardization of policy at the state level or diffusion of policy responsibility to localities. Coefficient estimates for the other variables would then reflect marginal impacts on prohibition support beyond general support for decentralization. We stress here that inclusion of vote shares for home-rule support is simply to act as a control to net out decentralization effects from the other variables and is not intended to represent a causal effect of its own. Results are reported in the second column of table 4.
We find that, even after controlling for the other factors, support for decentralization in general (as shown by support for home rule) remains strongly correlated with support for state prohibition repeal, which would be expected to result in local option. Controlling for this support for decentralization eliminates the importance of both the female and urban variables but increases the statistical significance of wealth and evangelical population. We now find that wealthier counties were significantly more likely to support repeal at the margin, with both unstandardized and standardized coefficient estimates three times the size as found previously, consistent with the political economy view that the wealthy may have favored the legalization of alcohol as a way to generate additional tax revenue to help stave off the possibility of a new income tax.Footnote 6
Furthermore, disaggregating evangelicals into the four distinct denominations reveals that all but the percentage of Baptists are now significantly inversely correlated with repeal support, with p-values less than 0.05 and standardized coefficient estimates greater than 0.1 (in absolute value). The newly revealed impacts for the percentage of Presbyterians and Disciples would be consistent with the notion that such denominations may have favored both dry policies and decentralization; these preferences conflicted with each other when voting on state prohibition repeal, and their dry support was previously masked by failing to control for the level of decentralization support. That the percentage of Methodists was statistically significant and quantitatively important with and without the home-rule voting control might imply that, for this particular group of evangelicals, their preference for banning alcohol was stronger than any opposition to centralization.
Our findings suggest that voting on prohibition repeal (or its implementation) may conflate preferences on alcohol with preferences on decentralization. Some voters may have weighed both issues in determining how to vote; therefore, studies should not assume that voting behavior only reflects preferences on alcohol legalization. In particular, we offer an alternative explanation for some controversies in the literature. Wasserman (Reference Wasserman1989) argues that the previous conventional wisdom that urbanites supported repeal was misleading, and it was the settling of immigrants into urban areas that resulted in this correlation, not anything intrinsic to a rural/urban divide. Controlling for immigration (among other factors) he finds urbanization to not be statistically significantly related to prohibition vote returns. Our findings suggest an alternative explanation. Urbanization is not capturing an immigrant effect, but rather represents a preference of urbanites for decentralization. Similarly, women voters opposing repeal may have been signaling a preference for a standardized policy, rather than necessarily favoring prohibition in general, perhaps to avoid potential problems inherent in heterogeneous policies being adopted across counties (or states). We also find support for a conjecture (Dinan and Heckelman Reference Dinan and Heckelman2014) that a surprising finding from an earlier study that the size of the evangelical population in a state was not significantly related to support for federal prohibition repeal (in either a statistical or economically meaningful sense) may have been due to a lack of control for decentralization preferences.
Determinants of Turnout
We now explore which county demographics helped explain the decision to cast a referendum vote, as distinct from the question of which way to vote. The outcome of the vote would be influenced more heavily by those groups of voters who strongly supported or opposed the measure and took the time to come to the polls. Catholics may have strongly favored repeal, but if few of them voted, their preferences would be largely irrelevant to passage. More than half (56 percent) of the age-eligible population turned out to vote on the state repeal referendum, but the (unweighted) county average turnout on this measure was only 49 percent. In contrast, voter turnout on the home-rule referendum totaled nearly identical 42.6 percent for both the weighted and unweighted averages. Every county experienced at least some roll-off, with a high of almost 20 percentage point fewer votes in Noble County, to minimal difference in Geauga County (40.4 percent vs. 39.5 percent), with an (unweighted) average roll-off level of 6.75 percentage points.
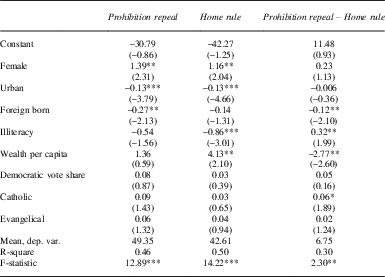
In table 5 we present regression estimates using similar specifications as before, except the dependent variable now represents county turnout rate on that referendum. We find a few differences between the two referenda. In particular, counties with larger foreign-born population shares recorded significantly lower participation on the prohibition-repeal vote but not on home rule, with both unstandardized and standardized coefficient estimates of much greater magnitude for an impact on prohibition-repeal turnout levels. The reverse was true for counties with greater levels of illiteracy. This might be attributed to the wording on the home-rule referendum being more cumbersome and confusing, whereas prohibition repeal was relatively straightforward. We also find that an increase in the wealth of a county would lead to more voting on home rule, perhaps with the idea of it being more important to protect their wealth and focus on local public goods. Urban counties tended to have higher rates of abstention on both measures, whereas counties with a greater share of females tended to have higher turnout for both. Neither partisanship nor religion had a statistically significant impact on the decision to vote for either measure, with each variable generating inconsequential marginal impacts. Perhaps if evangelicals, and in particular Methodists who were most strongly correlated with opposition to repeal, had turned out at greater rates than Catholics or other nonevangelicals, repeal in Ohio would have been more difficult to attain. Overall, as revealed by the R-square measures, roughly half of the variation in turnout for either measure is explained by this list of determinants.
County-level turnout (t-ratios)

* significant at ≤10%; ** significant at ≤5%; *** significant at ≤1%.
Despite the variation in roll-off, there is not surprisingly a strong correlation of 0.92 for turnout on these referenda across the counties. This might be because voters care similarly regarding both reforms, or the types of people who voted for one of the referendum are just more likely to vote in general. To better gauge differences in motivation, in the third column we subtract turnout level for home rule from the turnout level for repeal. Our new dependent variable thus directly measures roll-off from one amendment vote to the other. The marginal effects now represent impacts on differences in voting levels between the two referenda. Results are consistent with comparisons across the separate turnout regressions in the first two columns. In general, most groups voted to the same degree on both measures. Urban areas, for example, saw similar levels of lower turnout than rural areas for both referenda. Counties with more women saw higher turnout for both, with no significant roll-off on home rule. Increasing wealth in a county contributed more to voting on home rule than it did to voting on repeal. Immigrant populations held down voter turnout on repeal more than on home rule. Evangelicals voted at roughly the same rate as others for both measures. The exception is for Catholics. Although differences in the share of Catholics in a county did not appreciably affect turnout for either measure individually, there was an ever-slight contribution to the extent of roll-off that occurred on home rule. The impact, however, was only marginally statistically significant and quantitatively unimportant. A 10 percentage point increase in Catholics (which represents a 50 percent increase from the unweighted county average of 20 percent) would only increase roll-off by a little more than one-half a percentage point.
Conclusion
Our primary purpose has been disentangling policy preferences regarding alcohol prohibition from preferences about which level of government should regulate alcohol. Prior studies of referenda results have drawn conclusions about groups’ preferences for wet and dry policies without accounting for the possibility that voters’ decisions on these referenda were a product of both their substantive policy preferences and decentralization preferences. When we consider preferences on a county home-rule amendment in Ohio considered at the same time as a prohibition-repeal amendment in 1933, we are led to modify several conclusions drawn from prior studies of prohibition repeal and help resolve disputed questions in the literature.
Perhaps most important, prior studies have reached mixed conclusions about why urban areas supported prohibition repeal. Some studies have found no independent correlation; any support for repeal in urban areas is seen as a product of higher immigrant levels in urban areas. Other studies have found that urban areas were more supportive of repeal even when controlling for immigrant levels. Our study indicates that although urban areas in Ohio were supportive of prohibition repeal, over and above other characteristics of urban residence including immigration levels, this preference for repeal can be attributed to a preference for local decision making regarding alcohol. That is, urban counties backed repeal of state prohibition because they supported turning control over alcohol regulation to localities.
Decentralization preferences were also shown to influence voter decision making in other notable respects. Prior studies reported mixed findings regarding evangelicals’ support for prohibition repeal, with one study of state repeal finding that evangelicals opposed repeal but a study of federal repeal not finding a significant correlation. Our study of Ohio can help explain these varying conclusions. Once we consider evangelicals’ preferences regarding local decision making, we find that they clearly opposed legalizing alcohol.
Considering decentralization preferences also clarifies our understanding of the influence of gender on support for prohibition repeal. Women have been described in historical accounts as leading supporters of dry policies and were shown in one study to oppose repeal of state prohibition. Our study of Ohio suggests that women’s opposition to repeal may be a product of their opposition to devolving control of this policy to a local level.
We leave for future studies an investigation into the reasons underlying the decentralization preferences of these groups. Various explanations might be offered for why residents of urban areas and members of some evangelical denominations preferred policy to be devolved to a local level, whether because of an appreciation for heterogenous outcomes due to a more heterogenous population in the former case or a distrust of government authority in general in the latter case. Explanations might also be advanced for the preference exhibited by women for centralized policy making, which may have been a product of the way women’s suffrage was achieved in many areas only through a national constitutional amendment ratified less than a decade and a half earlier, thereby leading to an association of centralized policy making with support for women’s rights. These and other explanations for general preferences regarding decentralization or centralization of policy making might be tested in future studies. Our contribution in this article is to build on recent studies demonstrating the existence and importance of decentralization preferences (Kam and Mikos Reference Kam and Mikos2007; Schneider et al. Reference Schneider, Jacoby and Lewis2011), by showing that considering these preferences can help us better understand and interpret voting results on referenda on policy questions.
Although we have focused on decentralization preferences as they pertain to support for referenda legalizing alcohol, our findings also have important implications for interpreting—and set the stage for additional studies to be conducted regarding—studies of referenda on other policy questions where the policy has the potential to be addressed at different levels of government. For example, McDonagh and Price (Reference McDonagh and Price1985) study county-level support for women’s suffrage in Ohio and Michigan and conclude that, among other factors, Germans were more likely to prefer limiting the franchise to males due to the strong inverse correlation between the percentage of Germans in a county and overall levels of support for suffrage. Yet this could also be consistent with Germans preferring the question of suffrage to be addressed at the federal level rather than opposition to women voting per se.
The need for caution to avoid conflating voter preferences on the underlying substantive policy question and voter preferences on decentralization may also apply to scholarship on modern local referenda on, for example, determining minimum-wage levels. Some voters may prefer the local government to have the flexibility to decide for itself, whereas other voters may prefer the issue to be handled solely by the federal or state government. For example, the outcome in 2015 by Portland (Maine) voters to reject a referendum that would have boosted the minimum wage to $15 per hour has been presented as innate opposition to such increases, yet it may rather represent a belief that nonconformity with the rest of the state is harmful for local competitiveness. The same voters who opposed the referendum might support a statewide or even federal increase to the same level even though it would still apply to their city.
Views on decentralization can influence whether voters support certain referendum aside from their preference, if there is one, on the issue. The difficulty lies in developing adequate controls for decentralization preferences to ensure that any correlations (or lack of) with sociodemographic characteristics are properly interpreted.