







Introduction
High-speed transistors are needed for future wireless communication systems to operate successfully beyond  $[100]{GHz}$. Indium phosphide (InP) transistors, such as heterojunction bipolar transistors (HBTs) and high-electron mobility transistors (HEMTs), are attractive candidates for high-frequency applications because they offer not only high speed but also high output power and efficiency [Reference Markman and Schröter1].
Although InP transistors are one of the most promising technologies for high-frequency applications, it is worth to note that in many articles, for instance [Reference Urteaga, Griffith, Seo, Hacker and Rodwell2–Reference Rodwell, Urteaga, Mathew, Scott, Dino Mensa and Guthrie6], the way the maximum oscillation frequency  $f_{\mathrm{max}}$ of transistors is extracted raises questions regarding its reliability. It is observed that Mason’s gain curves seem to be dominated by artifacts. Despite the observed anomalies in Mason’s gain,
 $f_{\mathrm{max}}$ is extracted by extrapolating Mason’s gain
 $U$ to
 $[0]{dB}$ assuming a slope of
 $[-20]{dB}$ per decade. Values of
 $f_{\mathrm{max}}$ exceeding
 $[1]{THz}$ have been reported in [Reference Urteaga, Griffith, Seo, Hacker and Rodwell2, Reference Rode, Chiang, Choudhary, Jain, Thibeault, Mitchell and Rodwell3]. These figures were obtained by fitting the least-squares fit of the single-pole transfer function of Mason’s gain
 $U$ by measuring the scattering parameters up to
 $[50]{GHz}$. Off-wafer Line-Reflect-Reflect-Match (LRRM) calibration followed by on-wafer OPEN-SHORT de-embedding was implemented to correct the measured raw data in [Reference Rode, Chiang, Choudhary, Jain, Thibeault, Mitchell and Rodwell3]. Mason’s gain values demonstrated in [Reference Bolognesi, Flückiger, Alexandrova, Quan, Lövblom and Ostinelli4] were based on the same measured raw data, but de-embedded with different techniques. The three results for
 $f_{\mathrm{max}}$ that range from
 $[750]{GHz}$ to
 $[1.1]{THz}$ for a transistor with an emitter width of
 $[200]{nm}$ illustrate the uncertainty in determining
 $f_{\mathrm{max}}$. The extracted
 $f_{\mathrm{max}}$ value of
 $[755]{GHz}$ in [Reference Zach, Lind, Rodwell, Fang, Loubychev, Ying, Fastenau and Liu5] was claimed by performing an off-wafer probe-tip LRRM calibration up to
 $[67]{GHz}$, whereas on-wafer line-reflect-line calibration standards were used in [Reference Rodwell, Urteaga, Mathew, Scott, Dino Mensa and Guthrie6] to de-embed transistor scattering parameters, which yields
 $f_{\mathrm{max}}$ of
 $[1.08]{THz}$. It is important to note that the deviations in Mason’s gain from the expected behavior are observed not only for InP transistors but also in other technologies [Reference Fregonese, De Matos, Deng, Céli, Derrier and Zimmer7, Reference Zhang8].
Given the importance of  $f_{\mathrm{max}}$ as the figure of merit of the transistor, a reliable and accurate characterization of such high-speed transistors is critical. In the recent past, there has been considerable progress in this direction. It is now well understood that the frequency-dependent Mason’s gain
 $U(f)$ computed from calibrated on-wafer scattering parameter measurements is sensitive to on-wafer parasitic effects, coupling to neighboring structures, calibration inaccuracies, probe geometry, and other measurement uncertainties [Reference Fregonese, De Matos, Deng, Céli, Derrier and Zimmer7, Reference Davy, Deng, Virginie Nodjiadjim, Riet, Mismer, Ardouin and Maneux9, Reference Kanitkar, Doerner, Johansen, Heinrich and Flisgen10]. Our own investigations on InP HBTs featuring an emitter width of
 $[300]{nm}$ reveal the influence of probe-to-probe coupling and coupling to neighboring structures on transistor
 $f_{\mathrm{max}}$ [Reference Kanitkar, Doerner, Johansen, Heinrich and Flisgen10]. The electromagnetic (EM) field simulation results of realistic on-wafer environments employed with various probe topologies and on-wafer measurements of multiline Thru-Reflect-Line (mTRL) calibrated transistors emphasize the need for a more comprehensive on-wafer calibration technique for sub-THz transistor characterization. As a possible solution, [Reference Wei, Niu, Sweeney, Liang, Wang and Taylor11–Reference Fregonese and Zimmer13] reported and explained the use of a 16-term error model [Reference Butler, Rytting, Iskander, Pollard and Bossche14, Reference Silvonen15] for transistor characterization, while [Reference Cheron16] demonstrated an application of a cross-talk correction approach as second-tier calibration to improve sub-THz device characterization.
Our first result of on-wafer 16-term calibration for the characterization of InP HBTs was presented at the European Microwave Conference (EuMC) 2025 and was published in its proceedings [Reference Kanitkar, Doerner, Johansen, Heinrich and Flisgen17]. A direct comparison between the conventional 8-term mTRL calibration and the 16-term calibration carried out up to  $[67]{GHz}$ demonstrates that the 16-term calibration improves the way Mason’s gain is derived. In this extended paper, the 16-term calibration approach is expanded and validated by performing measurements up to
 $[110]{GHz}$. In addition, we present our approach to determine the scattering parameters of the actual on-wafer calibration standards. Using the raw measured scattering parameters and the precisely defined scattering parameters of these standards, 16-term calibration is verified by applying it to the raw scattering parameters of transistors under various bias conditions. A systematic analysis of the 16-term corrected scattering parameters is performed by comparing them with the conventional 8-term mTRL corrected scattering parameters, and thus the bias-dependent
 $f_{\mathrm{max}}$ of the down-scaled transistors is extracted.
Test structure layout
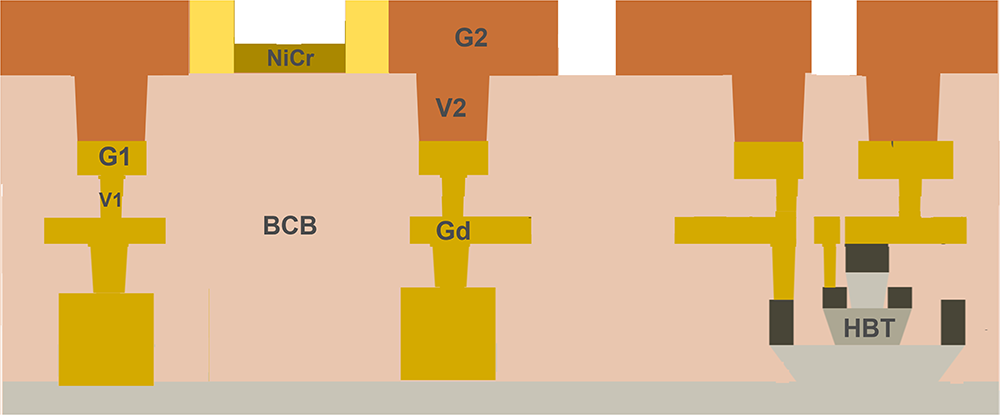
The passive calibration structures required for on-wafer calibration are realized in thin-film microstrip line (TF-MSL) configuration on FBH’s InP monolithic microwave integrated circuit (MMIC) stack, as depicted in Fig. 1. The width of the signal conductor is  $[12.8]{\mu m}$ and the thickness is
 $[4]{\mu m}$. It is labeled as layer G2. A ground layer is buried in
 $[7.5]{\mu m}$ benzocyclobutene (BCB) with
 $\varepsilon_{r} = [2.65]{}$. Coplanar pads in ground-signal-ground (GSG) configuration are realized at G2, facilitating on-wafer probing. All metalizations are made of gold.
FBH’s MMIC stack for fabrication of passive calibration structures and InP transistors.

Single-finger InP HBTs in common-emitter configuration are studied here. They are located below the Gd layer. The vertical interconnects bring the transistor’s base and collector terminals to the top layer G2, facilitating GSG probing. The test structure layout of the transistor is shown in Fig. 2(f).
Top view of on-wafer calibration standards showing (a) LINE ( $[150]{\mu m}$), (b) OPEN-OPEN, (c) LOAD-LOAD, asymmetric standards in terms of (d) OPEN-SHORT, (e) SHORT-OPEN, and (f) transistor test structure layout. InP substrate and BCB dielectric are not shown. The dashed lines depict the calibration reference planes.

The 16-term calibration algorithm [Reference Butler, Rytting, Iskander, Pollard and Bossche14, Reference Silvonen15] requires a minimum of five two-port standards including at least a pair of asymmetric standards to compute the 16 error terms. Moreover, these two-port calibration standards and the device under test (DUT) need to have constant pad-to-pad distances to accurately determine the cross-talk terms. The requirements are fulfilled by ensuring the pad-to-pad distance of  $[390]{\mu m}$ when designing the standards and layout of the transistor test structure. Two-port calibration standards such as a LINE of length
 $[150]{\mu m}$, an OPEN-OPEN (OO), a LOAD-LOAD (LL) and asymmetric standards in terms of OPEN-SHORT (OS), SHORT-OPEN (SO) are manufactured in the InP stack. They are shown in Fig. 2(a)–(e), respectively, from the top without depicting the InP substrate and the BCB dielectric, so that the metalizations are visible. To implement a conventional 8-term mTRL calibration, additional calibration standards such as a THRU standard of length zero, a SHORT-SHORT standard, and multiple LINE standards, e.g.,
 $[420]{\mu m}$,
 $[1250]{\mu m}$,
 $[1950]{\mu m}$,
 $[2850]{\mu m}$, and
 $[8500]{\mu m}$ are manufactured on the proposed stack. An additional asymmetric structure in terms of LOAD-OPEN (LO) is realized to validate the measurement accuracy and consistency.
On-wafer measurement setup
Two HBT devices are manufactured with an emitter area of  $[0.5 \times 6]{\mu m^2}$ (referred to as S500) and
 $[0.85 \times 6]{\mu m^2}$ (referred to as S850). The raw scattering parameter measurements of passive calibration standards and HBTs are conducted in two setups. Measurements up to
 $[67]{GHz}$ are performed using a Keysight PNA-X vector network analyzer and a pair of MPI Titan GSG probes with pitch
 $[100]{\mu m}$. The measurements are then performed up to
 $[110]{GHz}$. The
 $[110]{GHz}$ measurement setup consists of an Anritsu VectorStar vector network analyzer and MPI Titan GSG probes with pitch
 $[100]{\mu m}$. Both transistors are measured at
 $V_{\mathrm{CE}}$ =
 $[1.0]{V}$ and
 $[1.5]{V}$, and
 $I_{\mathrm{B}}$ =
 $[0.6]{mA}$ and
 $[0.8]{mA}$.
16-term calibration
Definition of standards
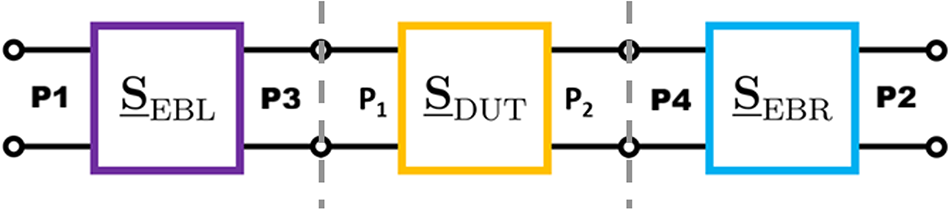
One of the most critical requirements of the 16-term calibration algorithm [Reference Butler, Rytting, Iskander, Pollard and Bossche14, Reference Silvonen15] is the description of standards used to determine 16 error terms. The scattering parameters of the actual two-port standards can be obtained by developing lumped element models of the standards [Reference Wei, Niu, Sweeney, Liang, Wang and Taylor11, Reference Wei, Niu, Sweeney and Taylor12] or using a combination of measured calibrated data and EM simulations [Reference Fregonese and Zimmer13]. Our approach involves the use of 8-term corrected scattering parameters of the standards to define the actual scattering parameters. For this purpose, the raw scattering parameters of a THRU of length zero, SHORT-SHORT as a reflect, and five multiple length LINE standards are used to compute the 8 error terms. The properties of the error networks  $\underline{\mathbf{S}}_\mathrm{EBL}\in\mathbb{C}^{2\times 2}$ and
 $\underline{\mathbf{S}}_\mathrm{EBR}\in\mathbb{C}^{2\times 2}$, shown in Fig. 3, are determined by the scikit-rf [Reference Arsenovic, Hillairet, Anderson, Forsten, Rieß, Eller, Sauber, Weikle, Barnhart and Forstmayr19] implementation of the mTRL algorithm. For the
 $[50]{\Omega}$ normalization of the corrected scattering parameters, the characteristic impedance
 $Z_{0}$ is determined by calculating the capacitance per unit length
 $C'$ [Reference Williams and Marks18]. The LOAD-LOAD standard, Fig. 2(c), is used to estimate
 $C'$. The
 $[50]{\Omega}$ renormalized error networks are then applied to the raw measurements of the two-port calibration standards (a)–(e) of Fig. 2. The reference planes after calibration are
 $[120]{\mu m}$ away from the edges of the pad. They are marked by dashed lines in Fig. 2.
Schematic representation of 8-term error model. Two-port networks  $\underline{\mathbf{S}}_\mathrm{EBL}$ and
 $\underline{\mathbf{S}}_\mathrm{EBR}$ constitute eight error terms. The dashed lines depict the calibration reference planes.

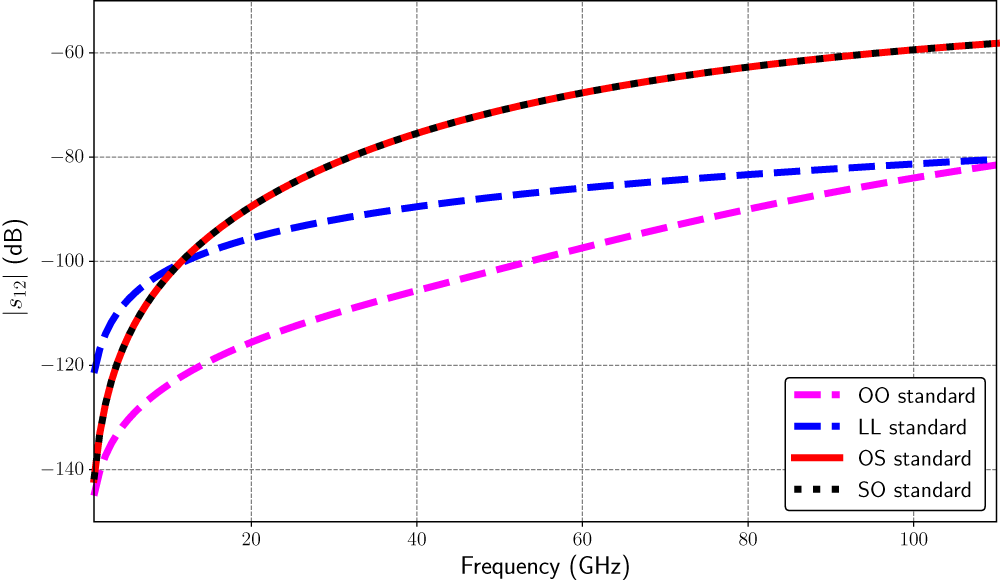
The direct use of the mTRL-corrected scattering parameters of the OO standards (Fig. 2(b)), LL (Fig. 2(c)), OS (Fig. 2(d)), and SO (Fig. 2(e)) as the actual scattering parameters required for 16-term calibration can lead to an error-prone estimation of the associated error terms. To determine the intrinsic cross-talk levels arising from the standards themselves, 3D electromagnetic (EM) simulations of the standards are performed considering the waveguide ports at reference planes. The scattering parameters are obtained using the frequency-domain full-wave solver of CST Studio Suite in the frequency range from  $[1]{GHz}$ to
 $[110]{GHz}$. The highest coupling levels of approximately
 $[-60]{dB}$ are observed for the OS and SO structures at
 $[110]{GHz}$. Figure 4 compares the intrinsic cross-talk levels resulting from EM simulations for standards OO, LL, OS, and SO.
Magnitude of intrinsic cross-talk for reflect standards OO, LL, OS and SO obtained using EM simulations considering waveguide ports at the reference planes.

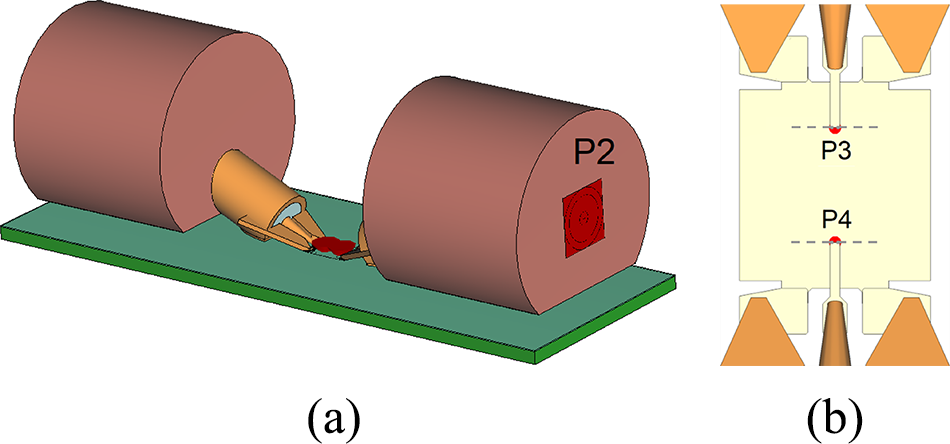
In addition, we performed four-port simulations of a passive on-wafer probing environment using probe models. Figure 5 shows a 3D model with waveguide ports at external ports  $P1$ and
 $P2$ and the top view of a structure with internal ports
 $P3$ and
 $P4$ located at the reference planes. The scattering matrix is denoted by
 \begin{equation}
\underline{\mathbf{S}}_\mathrm{IP} =
\begin{pmatrix}
\underline{s}_{\mathrm{IP},11} & \underline{s}_{\mathrm{IP},12} & \underline{s}_{\mathrm{IP},13} & \underline{s}_{\mathrm{IP},14}\\
\underline{s}_{\mathrm{IP},21} & \underline{s}_{\mathrm{IP},22} & \underline{s}_{\mathrm{IP},23} & \underline{s}_{\mathrm{IP},24}\\
\underline{s}_{\mathrm{IP},31} & \underline{s}_{\mathrm{IP},32} & \underline{s}_{\mathrm{IP},33} & \underline{s}_{\mathrm{IP},34}\\
\underline{s}_{\mathrm{IP},41} & \underline{s}_{\mathrm{IP},42} & \underline{s}_{\mathrm{IP},43} & \underline{s}_{\mathrm{IP},44}\\
\end{pmatrix}\in\mathbb{C}^{4\times 4}\text{,}
\end{equation}
where the subscript  $\mathrm{IP}$ indicates that the matrix refers to the structure with internal ports. The parasitic probe-to-probe coupling is predominantly described by the scattering coefficients
 $\underline{s}_{\mathrm{IP},12}$ =
 $\underline{s}_{\mathrm{IP},21}$,
 $\underline{s}_{\mathrm{IP},14}$ =
 $\underline{s}_{\mathrm{IP},41}$,
 $\underline{s}_{\mathrm{IP},23}$ =
 $\underline{s}_{\mathrm{IP},32}$,
 $\underline{s}_{\mathrm{IP},34}$ =
 $\underline{s}_{\mathrm{IP},43}$. The highest coupling of
 $[-35]{dB}$ is observed for the coefficients
 $\underline{s}_{\mathrm{IP},12}$ =
 $\underline{s}_{\mathrm{IP},21}$ at
 $[110]{GHz}$. To understand the influence of parasitic probe-probe coupling, we calibrate using the topology shown in Fig. 3 and select the eight error terms by choosing the respective coefficients from (1). The resulting two-port scattering matrices are defined as
 \begin{equation}
\underline{\mathbf{S}}_\mathrm{EBL} =
\begin{pmatrix}
\underline{s}_{\mathrm{IP},11} & \underline{s}_{\mathrm{IP},13} \\
\underline{s}_{\mathrm{IP},31} & \underline{s}_{\mathrm{IP},33} \\
\end{pmatrix}\in\mathbb{C}^{2\times 2}\text{,}
\end{equation}
 \begin{equation}
\underline{\mathbf{S}}_\mathrm{EBR} =
\begin{pmatrix}
\underline{s}_{\mathrm{IP},44} & \underline{s}_{\mathrm{IP},42} \\
\underline{s}_{\mathrm{IP},24} & \underline{s}_{\mathrm{IP},22} \\
\end{pmatrix}\in\mathbb{C}^{2\times 2}\text{.}
\end{equation}
(a) 3D EM model of the on-wafer environment with probes. The red area at the back of the right probe marks the external port  $P2$, whereas port
 $P1$ is hidden behind the left probe. (b) Top view of on-wafer structure with pads contacted by probes and internal ports
 $P3$ and
 $P4$ at reference planes.

The scattering matrices  $\underline{\mathbf{S}}_{\mathrm{EBL}}$ and
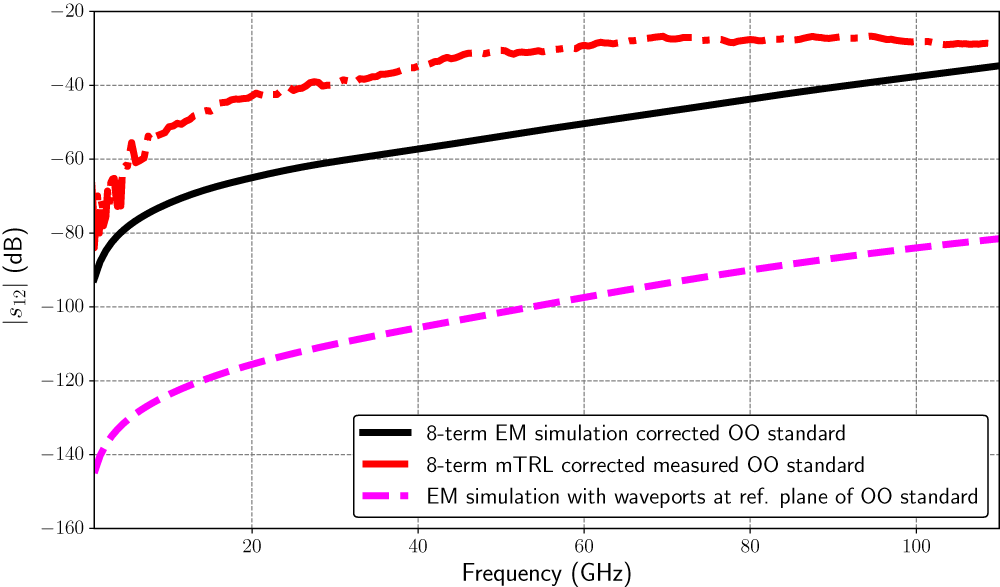
 $\underline{\mathbf{S}}_{\mathrm{EBR}}$ are applied on the scattering parameters of the OO standard obtained by performing EM simulations using the probe model. Figure 6 shows the comparison of the magnitude of transmission scattering parameters obtained from calibrated EM simulations by applying
 $\underline{\mathbf{S}}_{\mathrm{EBL}}$ and
 $\underline{\mathbf{S}}_{\mathrm{EBR}}$ with the mTRL corrected transmission scattering parameters obtained from measurements. The EM simulation results of the OO standard with waveguide ports at the reference planes are also included.
Magnitude of transmission scattering parameter of OO standard obtained from EM simulation calibration, 8-term mTRL calibration of measurements up to  $[110]{GHz}$ and EM simulations with waveguide ports at the reference planes.

The highest coupling levels of  $[-29]{dB}$ are observed in the measurements of the OO standard at
 $[110]{GHz}$. However, the intrinsic coupling levels of the OO standard are below
 $[-80]{dB}$. It is evident that the mTRL corrected scattering parameters of the standards are affected by the cross-talk arising from probe-to-probe coupling through air and through the substrate. In our previous investigations [Reference Kanitkar, Doerner, Johansen, Heinrich and Flisgen10], we demonstrated the influence of probe-probe coupling effects on the Mason gain of transistors. Therefore, the actual scattering parameters denoted as
 $\underline{s}_{\mathrm{act}}$ of the two-port structures OO of Fig. 2(b), LL of Fig. 2(c), OS of Fig. 2(d), and SO of Fig. 2(e) are defined as:
 \begin{equation}
\underline{s}_{\mathrm{act},11} = \underline{s}_{\mathrm{mTRL},11},
\end{equation}
 \begin{equation}
\underline{s}_{\mathrm{act},12} = \underline{s}_{\mathrm{act},21} = 0,
\end{equation}
 \begin{equation}
\underline{s}_{\mathrm{act},22} = \underline{s}_{\mathrm{mTRL},22},
\end{equation}
and the LINE standard, Fig. 2(a), is defined as:
 \begin{equation}
\underline{\mathbf{S}}^{\mathrm{LINE}}_\mathrm{act} = \underline{\mathbf{S}}^{\mathrm{LINE}}_\mathrm{mTRL}.
\end{equation}
Here,  $\underline{s}$ denotes the scattering parameters, and
 $\underline{\mathbf{S}}$ represents the scattering matrix.
Verification of measurement consistency and accuracy
We used the longest LINE standard to check the consistency of the measurements conducted on two setups. The pad-to-pad distance for the  $[8500]{\mu m}$ LINE standard is
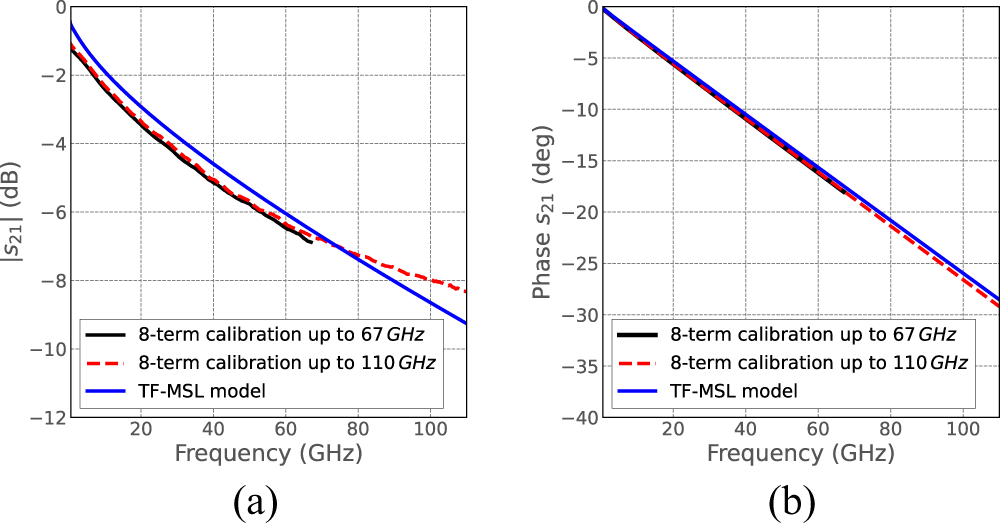
 $[8740]{\mu m}$. Figure 7 shows a good agreement between the magnitude and phase of the transmission parameter
 $\underline{s}_{\mathrm{21}}$ of the 8-term mTRL corrected LINE standard measured across two setups and the line properties of the analytical TF-MSL model [Reference Schnieder and Heinrich20]. The small discrepancies between the calibrated measurements and the TF-MSL model are attributed to manufacturing tolerances, which are not taken into account in the definition of model parameters.
(a) Magnitude and (b) phase of 8-term corrected transmission scattering parameter  $\underline{s}_{21}$ of
 $[8500]{\mu m}$ LINE standard measured at
 $[67]{GHz}$ setup (black curve) and
 $[110]{GHz}$ setup (red curve). The blue solid curve represents scattering parameter
 $\underline{s}_{21}$ obtained from analytical TF-MSL model [Reference Schnieder and Heinrich20].

To verify the accuracy of the measurements performed on two setups, a passive structure, which is not used to compute the error networks, is characterized. The raw scattering parameters of the asymmetric LOAD-OPEN standard, which has pad-to-pad separation of  $[390]{\mu m}$, are corrected by applying the 16-term error model. The properties of the error network
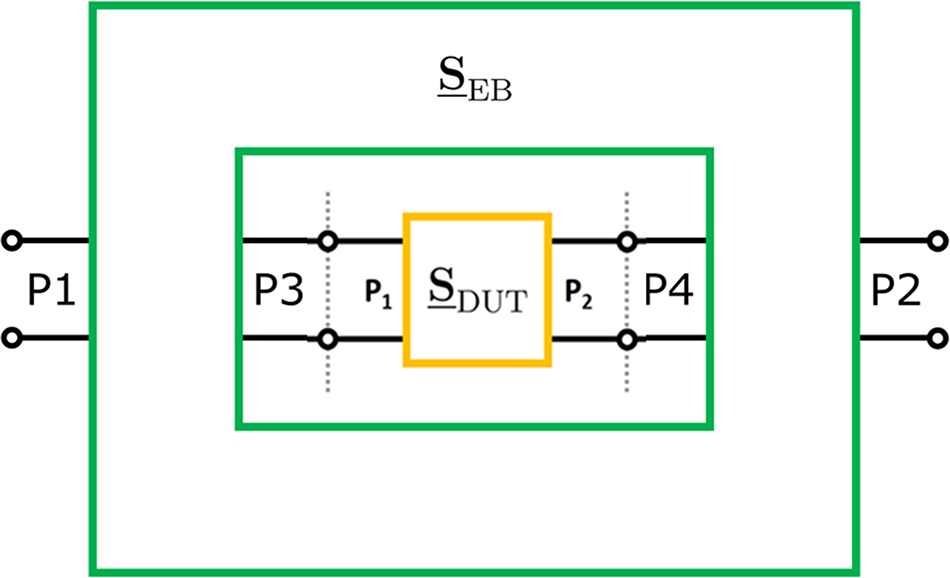
 $\underline{\mathbf{S}}_\mathrm{EB}\in\mathbb{C}^{4\times 4}$ depicted in Fig. 8 are determined by the scikit-rf [Reference Arsenovic, Hillairet, Anderson, Forsten, Rieß, Eller, Sauber, Weikle, Barnhart and Forstmayr19] implementation of the 16-term algorithm [Reference Butler, Rytting, Iskander, Pollard and Bossche14, Reference Silvonen15]. The algorithm computes the error terms based on the raw measured scattering parameters of the structures (a)–(e) of Fig. 2 and the actual scattering parameters of these structures defined in the Definition of standards section. The 16-term corrected scattering parameters are compared with the 8-term corrected scattering parameters. For this purpose, the two error networks
 $\underline{\mathbf{S}}_\mathrm{EBL}\in\mathbb{C}^{2\times 2}$ and
 $\underline{\mathbf{S}}_\mathrm{EBR}\in\mathbb{C}^{2\times 2}$ obtained by the mTRL calibration algorithm are applied to the raw scattering parameters of the LOAD-OPEN standard. Figure 9 represents the magnitude of the corrected scattering parameters of the LOAD-OPEN standard. It can be observed that both the 8-term calibration and the 16-term calibration agree well up to
 $[50]{GHz}$. The differences in the reflection scattering parameters are negligible (
 $[ \lt 1]{dB}$). The magnitude of the transmission parameters is well below
 $[-30]{dB}$ for the 8-term correction and below
 $[-40]{dB}$ for the 16-term correction throughout the full frequency range. The measured average noise level is
 $[-83]{dB}$ with the highest noise level of
 $[-70]{dB}$ measured at
 $[110]{GHz}$. The noise floor is recorded under the same measurement settings. The low noise levels indicate that the measured scattering parameters are less susceptible to noise and distortions. In the case of passive device characterization, the 16-term calibration performs equally well as the 8-term calibration, and the small deviations are of less significance to the system’s overall performance.
Schematic representation of 16-term error model. Error network  $\underline{\mathbf{S}}_\mathrm{EB}$ constitutes sixteen error terms. The dotted lines depict the calibration reference planes.

Magnitude of 8-term corrected (red and black curves) and 16-term corrected (blue and magenta curves) scattering parameters of a two-port asymmetric LOAD-OPEN (LO) standard measured on two setups.

Results
Evaluation of transistor scattering parameters
The error network  $\underline{\mathbf{S}}_\mathrm{EB}\in\mathbb{C}^{4\times 4}$ obtained from the 16-term error model [Reference Butler, Rytting, Iskander, Pollard and Bossche14, Reference Silvonen15] is applied to the raw transistor measurements. To understand the correction of the transistor measurements in the on-wafer probing environment, 8-term corrected scattering parameters of the transistor are obtained by applying the error networks generated from the mTRL algorithm to the raw transistor measurements. The transistor is biased at
 $V_{\mathrm{CE}} = [1.5]{V}$ and
 $I_{\mathrm{B}} = [0.6]{mA}$. The measured collector currents
 $I_{\mathrm{C}}$ are
 $[16.5]{mA}$ and
 $[11.0]{mA}$ for S850 and S500, respectively. The direct comparison between the 8-term corrected and the 16-term corrected scattering parameters of the device S850 shows small but noticeable differences in both magnitude and phase. They are depicted in Fig. 10(a) and (b), respectively. The reflection parameters
 $\underline{s}_{11}$ and
 $\underline{s}_{22}$ deviate beyond
 $[25]{GHz}$. Among the four scattering parameters, the forward transmission parameter
 $\underline{s}_{21}$ is the least affected parameter. The highest deviation of more than
 $[0.5]{dB}$ is observed in the magnitude of the output reflection coefficient
 $\underline{s}_{22}$ while the phase of
 $\underline{s}_{22}$ has a difference of about
 $5^{\circ}$ in the frequency band of
 $[50-70]{GHz}$ when measured up to
 $[110]{GHz}$. One of the potential reasons for the observed differences is probe cross-talk. The influence of probe cross-talk effects on the transistor
 $f_{\mathrm{max}}$ is discussed in detail in our previous work [Reference Kanitkar, Doerner, Johansen, Heinrich and Flisgen10]. The trends observed for the S850 are also observable for the down-scaled transistor. Figure 11(a) and (b) represent the magnitude and phase of the 8-term corrected and 16-term corrected scattering parameters for S500, respectively. In the case of down-scale devices, the difference in the magnitude of the input reflection coefficient
 $\underline{s}_{11}$ rises to
 $[0.9]{dB}$ and the maximum difference of
 $6^{\circ}$ is observed in phase of output reflection coefficient
 $\underline{s}_{22}$.
(a) Magnitude and (b) phase of 8-term (red and black curves) and 16-term corrected scattering parameters (blue and magenta curves) of S850 measured up to  $[67]{GHz}$ and up to
 $[110]{GHz}$.

(a) Magnitude and (b) phase of 8-term (red and black curves) and 16-term corrected scattering parameters (blue and magenta curves) of S500 measured up to  $[67]{GHz}$ and up to
 $[110]{GHz}$.

Extraction of transistor properties
Scattering parameter measurements, while valuable, provide an incomplete basis for transistor characterization. The true behavior of the transistor can only be realized by determining its figures of merit such as current gain  $f_{\mathrm{T}}$ and maximum oscillation frequency
 $f_{\mathrm{max}}$. Typically, circuit designers utilize only a subset, often about half of these quantities, for oscillator and amplifier design. Therefore, accurate and reliable estimation of these quantities is critical from a circuit designers perspective. Among the two quantities, the determination of
 $f_{\mathrm{T}}$ is straightforward and insensitive with respect to artifacts arising from the on-wafer measurements. The corrected scattering parameters are converted to a hybrid parameters and
 $\underline{h}_{21}$ parameter is then extrapolated to
 $[0]{dB}$ to obtain the short-circuit current gain
 $f_{\mathrm{T}}$. The extraction of
 $f_{\mathrm{T}}$ does not show severe anomalies in its behavior, and the value can be reliably extracted from both 8-term and 16-term calibrations. Fig. 12(a) and (b) demonstrate the short-circuit current gain
 $\underline{h}_{21}$ for S850 and S500, respectively.
Short-circuit current gain  $\underline{h}_{21}$ deduced using 8-term corrected and 16-term corrected scattering parameters up to
 $[110]{GHz}$ of (a) S850 and (b) S500 biased at
 $V_{\mathrm{CE}} = [1.5]{V}$ and
 $I_{\mathrm{B}} = [0.6]{mA}$.

In contrast, the Mason gain computation of the transistor is critical. The frequency-dependent Mason’s gain  $U(f)$ is calculated from corrected data as [Reference Gupta21]:
 \begin{equation}
U(f) = \frac{|(\underline{s}_{21} / \underline{s}_{12}) - 1|^2}{2k|\underline{s}_{21}/\underline{s}_{12}|- 2 Re[\underline{s}_{21}/\underline{s}_{12}]},
\end{equation}
where the stability factor  $k$ of an active two-port can be determined as:
 \begin{equation}
k = \frac{1 - |\underline{s}_{11}|^2-|\underline{s}_{22}|^2+|\underline{s}_{11}\underline{s}_{22}-\underline{s}_{21}\underline{s}_{12}|^2}{2|\underline{s}_{12}\underline{s}_{21}|}.
\end{equation}
The mTRL calibration based on the 8-term error model is not able to completely account for on-wafer parasitic effects, especially probe cross-talk effects, to a sufficient extent. Thus, the corrected data obtained from 8-term mTRL calibration is itself notorious to on-wafer parasitic effects, resulting in error-prone Mason’s gain. On the other hand, the additional 8 error terms in the 16-term error model account for cross-talk and other parasitic effects in its error correction algorithm, leading to a reasonably stable  $f_{\mathrm{max}}$ estimate irrespective of the measurement setup. Fig. 13(a) and (b) represent Mason’s gain and extracted
 $f_{\mathrm{max}}$ estimation from 8-term corrected and 16-term corrected scattering parameters for S850. A logarithmic representation of Mason’s gain, Fig. 13(a), can obscure the true behavior of
 $f_{\mathrm{max}}$. In contrast, a more commonly used representation,
 $\sqrt{U} \times f$, as shown in Fig. 13(b), reveals its underlying characteristics. It should be noted that an 8-term calibration underestimates
 $f_{\mathrm{max}}$ values up to approximately
 $[70]{GHz}$. Active-device stability factor
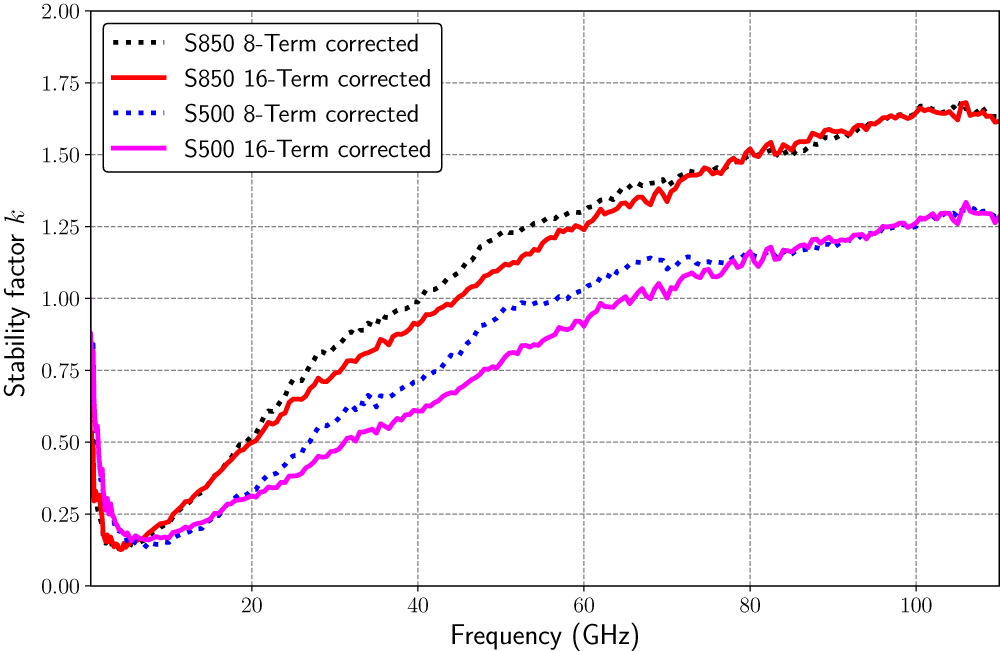
 $k$, see Fig. 14, derived using (9) shows the mid-frequency band divergence between values derived using 8-term and 16-term calibration. The
 $|\det \underline{\mathbf{S}}|$ remains below
 $[0.5]{}$ throughout the measured frequency range. The stability factor
 $k \gt 1$ and
 $|\det \underline{\mathbf{S}}| \lt 1$ indicates that the devices are unconditionally stable, i.e., the device will not oscillate regardless of input and output impedance. As frequency increases, the stability margin increases; emphasizing the fact that the extracted
 $\sqrt{U} \times f$ curves are not dominated by stability related artifacts. To our understanding, the underestimation in 8-term calibrated Mason’s gain is due to the presence of probe cross-talk effects. On the other hand, the 16-term calibration remains well behaved beyond
 $[40]{GHz}$. In the case of HBTs,
 $f_{\mathrm{max}}$ is a function of the total base-collector junction capacitance. As the operating frequency increases, the junction capacitance dominates and introduces negative feedback that forms the RC time constant with the base resistance, reducing the power gain [Reference Rudolph22]. It is worth noting that the 8-term corrected and 16-term corrected
 $\sqrt{U} \times f$ curves meet at higher frequencies. The observations hold for the down-scaled transistors as well. Fig. 15(a) and (b) demonstrate Mason’s gain and the estimated
 $f_{\mathrm{max}}$ for S500, respectively. Similar observation is reported in [Reference Fregonese and Zimmer13] for SiGe HBTs using on-wafer 16-term and TRL calibration, where the TRL calibrated
 $\sqrt{U} \times f$ suddenly drops at 60 GHz, attributing to the probe coupling, and converges at higher frequencies with a 16-term corrected
 $\sqrt{U} \times f$ curve.
(a) Mason’s gain in logarithmic scale and (b)  $\sqrt{U} \times f$ representation of
 $f_{\mathrm{max}}$ deduced using 8-term corrected scattering parameters (red and black curves) and 16-term corrected scattering parameters (blue and magenta curves) measured up to
 $[67]{GHz}$ and up to
 $[110]{GHz}$ of S850 biased at
 $V_{\mathrm{CE}} = [1.5]{V}$ and
 $I_{\mathrm{B}} = [0.6]{mA}$.

Stability factor  $\mathrm{k}$ determined using 8-term corrected and 16-term corrected scattering parameters measured up to
 $[110]{GHz}$ for S850 and S500.

(a) Mason’s gain in logarithmic scale and (b)  $\sqrt{U} \times f$ representation of
 $f_{\mathrm{max}}$ deduced using 8-term corrected scattering parameters (red and black curves) and 16-term corrected scattering parameters (blue and magenta curves) measured up to
 $[67]{GHz}$ and up to
 $[110]{GHz}$ of S500 biased at
 $V_{\mathrm{CE}} = [1.5]{V}$ and
 $I_{\mathrm{B}} = [0.6]{mA}$.

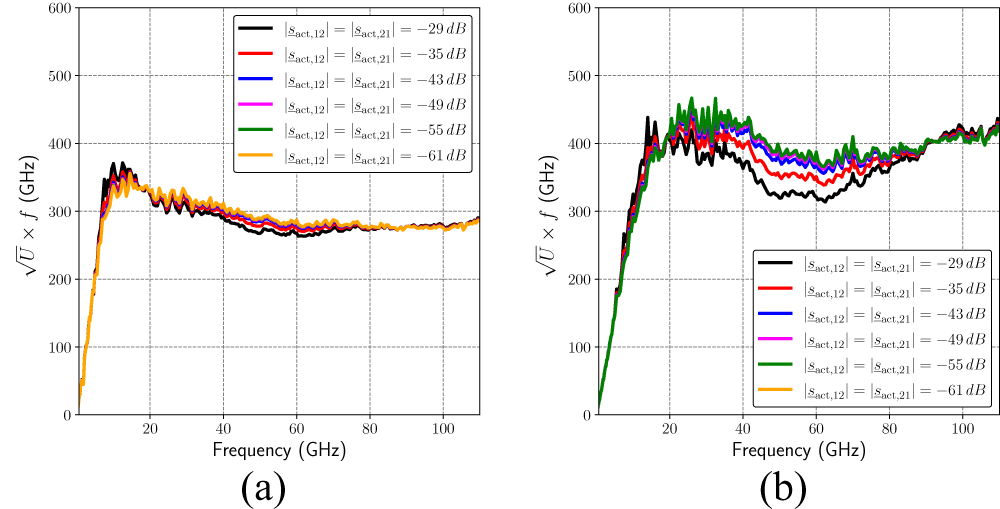
Furthermore, the sensitivity of the extracted  $f_{\mathrm{max}}$ value against the 16-term corrected scattering parameters is systematically analyzed. For this purpose, the constraint imposed by
 $\underline{s}_{\mathrm{act},12} = \underline{s}_{\mathrm{act},21} = 0$ on the actual scattering parameters of the OO standard is relaxed, and its impact on transistors
 $f_{\mathrm{max}}$ is evaluated. Figure 16 shows the
 $\sqrt{U} \times f$ curves for S850 and S500. The extraction of
 $f_{\mathrm{max}}$ in advanced transistor nodes is severely affected by cross-talk, which acts as the primary mechanism that distorts Mason’s gain. Mason’s gain is determined using 16-term corrected scattering parameters by imposing varying cross-talk levels for the OO standard. The black curves correspond to the mTRL corrected scattering parameters of the OO standard with the magnitude of the transmission parameters equal to
 $[-29]{dB}$ at
 $[110]{GHz}$. The Masons’s gain results in an equal response without any significant improvement for coupling levels below
 $[-61]{dB}$. Therefore, the coupling levels of the OO standard are varied from
 $[-29]{dB}$ to
 $[-61]{dB}$. Absolute cross-talk levels for other standards LL, OS, and SO are assumed to be zero, as discussed in the Definition of standards section.
 $\sqrt{U} \times f$ deduced using 16-term corrected scattering parameters for (a) S850 and (b) S500. 16-term corrected scattering parameters are obtained by imposing varying cross-talk levels for actual scattering parameters of OO standard.

Bias-dependent evaluation of transistor properties
When designing RF circuits such as oscillators and amplifiers, circuit designers often pay attention to the current and power limitations of a transistor and choose bias conditions accordingly. Therefore, bias-dependent characterization of sub-THz transistors becomes critical for efficient circuit functioning. The bias conditions are chosen according to FBH’s InP-based circuit design requirements. The two transistor configurations, S850 and S500, are further characterized with bias  $V_{\mathrm{CE}}$ =
 $[1.0]{V}$ and
 $[1.5]{V}$ at
 $I_{\mathrm{B}} = [0.6]{mA}$ and
 $[0.8]{mA}$ using an 8-term calibration and a 16-term calibration. It should be noted again that the determination of transistor
 $f_{\mathrm{T}}$ is robust against the calibration algorithm. In contrast, extraction of
 $f_{\mathrm{max}}$ is critical, as discussed in the previous section. Figure 17 illustrates the
 $\sqrt{U} \times f$ deduced using the 8-term and 16-term corrected scattering parameters for S850 and S500 at
 $V_{\mathrm{CE}}$ =
 $[1.5]{V}$ and
 $I_{\mathrm{B}}$ =
 $[0.8]{mA}$, respectively. Figs. 18 and 19 show the
 $\sqrt{U} \times f$ deduced using 8-term calibration and 16-term calibration under varying base currents for S850 and S500, respectively. At
 $V_{\mathrm{CE}} = [1.0]{V}$,
 $\sqrt{U} \times f$ computed using the 8-term corrected scattering parameters does not exhibit significant anomalies at lower frequencies, i.e., measurements up to
 $[67]{GHz}$. This behavior contrasts with observations at
 $V_{\mathrm{CE}}$ of
 $[1.5]{V}$, where noticeable irregularities arise under the same calibration technique. These results highlight the susceptibility of Mason’s gain computation to inaccuracies when relying on 8-term calibration.
 $\sqrt{U} \times f$ deduced using 8-term corrected scattering parameters (red and black curves) and 16-term corrected scattering parameters (blue and magenta curves) measured up to
 $[67]{GHz}$ and up to
 $[110]{GHz}$ at
 $V_{\mathrm{CE}} = [1.5]{V}$;
 $I_{\mathrm{B}} = [0.8]{mA}$ for (a) S850 and (b) S500.

 $\sqrt{U} \times f$ deduced using 8-term corrected scattering parameters (red and black curves) and 16-term corrected scattering parameters (blue and magenta curves) measured up to
 $[67]{GHz}$ and up to
 $[110]{GHz}$ at
 $V_{\mathrm{CE}} = [1.0]{V}$;
 $I_{\mathrm{B}} = [0.6]{mA}$ for (a) S850 and (b) S500.

 $\sqrt{U} \times f$ deduced using 8-term corrected scattering parameters (red and black curves) and 16-term corrected scattering parameters (blue and magenta curves) measured up to
 $[67]{GHz}$ and up to
 $[110]{GHz}$ at
 $V_{\mathrm{CE}} = [1.0]{V}$;
 $I_{\mathrm{B}} = [0.8]{mA}$ for (a) S850 and (b) S500.

Tables 1 and 2 compare the  $f_{\mathrm{max}}$ values extracted under various bias conditions using an 8-term calibration and a 16-term calibration for S850 and S500, respectively. The
 $f_{\mathrm{max}}$ values are extracted by taking the mean of the
 $\sqrt{U}\times f$ values beyond
 $[30]{GHz}$ using measurements up to
 $[110]{GHz}$. For devices with a larger emitter width, S850, the choice of calibration technique has a negligible impact on the extracted transistor properties, as both calibration techniques yield comparable mean
 $f_{\mathrm{max}}$ values with a standard deviation below
 $[12]{GHz}$. The maximum deviation between the extracted mean values of
 $f_{\mathrm{max}}$ is
 $[3.7]{GHz}$, observed at
 $V_{\mathrm{CE}}$ =
 $[1.5]{V}$ and
 $I_{\mathrm{B}}$ =
 $[0.8]{mA}$. In contrast, for devices with downscale, S500, the discrepancy between extracted
 $f_{\mathrm{max}}$ values using 8-term calibration and 16-term calibration increases significantly, reaching approximately
 $[22]{GHz}$ at
 $V_{\mathrm{CE}}$ =
 $[1.5]{V}$. Moreover, the standard deviation of the extracted
 $f_{\mathrm{max}}$ value increases to
 $[50]{GHz}$ around a mean value of
 $[410]{GHz}$ at
 $V_{\mathrm{CE}}$ =
 $[1.5]{V}$ and
 $I_{\mathrm{B}}$ =
 $[0.8]{mA}$.
It is important to note that the  $\sqrt{U} \times f$ characteristics deduced using the 16-term calibration exhibit a smoother behavior without the pronounced fluctuations (drops or rises) compared to the observed curves obtained using the 8-term calibration. Consequently, the standard deviation of the extracted
 $f_{\mathrm{max}}$ values using a 16-term calibration remains below
 $[16]{GHz}$ for all measured bias conditions. It should be noted that second-order effects such as distributed access line effects and substrate effects are neglected while computing mean
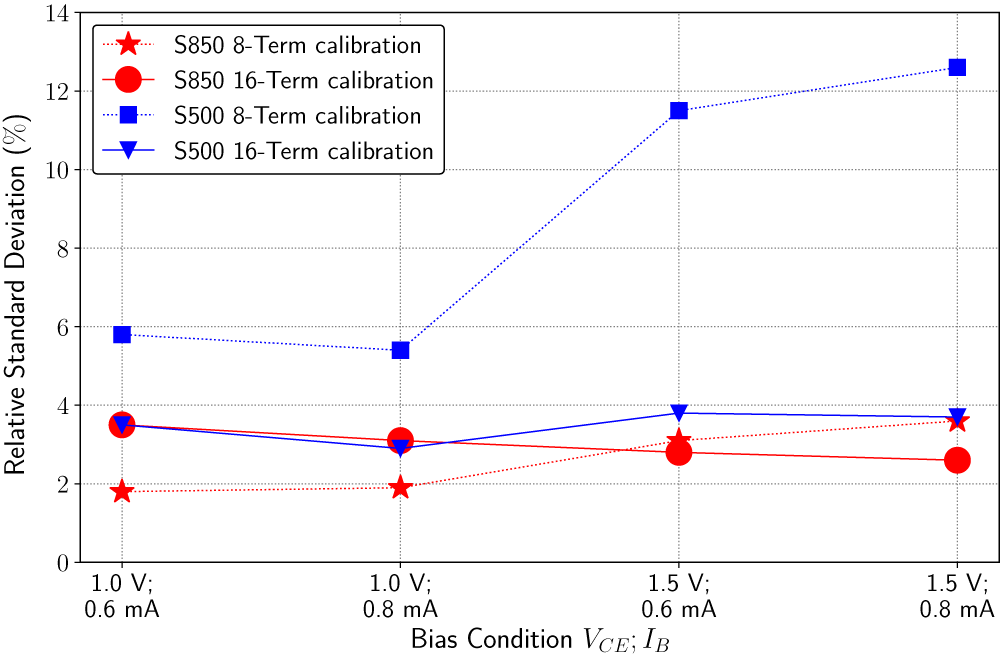
 $f_{\mathrm{max}}$ values. Figure 20 shows the relative standard deviation of S850 and S500 against bias conditions. The relative standard deviation for the extracted
 $f_{\mathrm{max}}$ values using 16-term calibration remains below
 $[4]{\%}$ for both devices. In contrast, when 8-term calibration is applied, the relative standard deviation increases to as high as
 $[12]{\%}$ for S500. Overall, these results indicate that the 16-term calibration provides a more reasonably stable estimation of
 $f_{\mathrm{max}}$ for scaled InP HBTs under a wide range of operating conditions. However, the sensitivity of the extracted
 $f_{\mathrm{max}}$ to the intrinsic scattering parameters of the active device requires further systematic investigation. Moreover, because the accuracy of the 16-term calibration depends on the description of its standards, a precise modeling of standards can further reduce the uncertainties in the
 $f_{\mathrm{max}}$ estimation.
Extraction of  $f_{\mathrm{max}}$ values for S850 using measurements up to
 $[110]{GHz}$

Table 1 Long description
Extraction of fmax values for S850 using 8-term mTRL calibration and 16-term calibration by conducting measurements up to 100 GHz.
Extraction of  $f_{\mathrm{max}}$ values for S500 using measurements up to
 $[110]{GHz}$

Table 2 Long description
Extraction of fmax values for S500 using 8-term mTRL calibration and 16-term calibration by conducting measurements up to 100 GHz
Relative standard deviation of the  $f_{\mathrm{max}}$ values extracted using 8-term calibration and 16-term calibration for S850 and S500 against measured bias conditions.

Conclusion
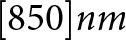
This paper focuses on RF characterization of down-scaled InP HBTs by conducting on-wafer measurements. HBTs featuring emitter widths of  $[850]{nm}$ and
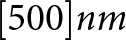
 $[500]{nm}$ are investigated by performing measurements up to
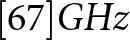
 $[67]{GHz}$ and up to
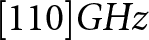
 $[110]{GHz}$. The raw transistor measurements performed at
 $V_{\mathrm{CE}}$ of
 $[1.0]{V}$ and [1.5]V, and
 $I_{\mathrm{B}}$ of
 $[0.6]{mA}$ and
 $[0.8]{mA}$ are corrected for by the 16-term calibration approach. A detailed methodology for the description of calibration standards, required for the successful implementation of 16-term calibration, is presented. The 16-term corrected transistor properties are compared with the conventional 8-term mTRL calibration. The conclusions are listed below:
• The conventional 8-term mTRL calibration results in an under- or overestimation of the
 $f_{\mathrm{max}}$ value when measured only up to
$[67]{GHz}$. The anomalies are more pronounced for down-scaled transistors. However, the
$\sqrt{U} \times f$ curves arising from the 8-term calibration and the 16-term calibration converge to each other at higher frequencies. Therefore, it is recommended to measure the scattering parameters up to the highest frequency possible to determine a reasonable
$f_{\mathrm{max}}$ value using the conventional 8-term mTRL calibration.
• The 16-term calibration is able to account for on-wafer parasitic effects to a larger extent. As a consequence, the
$\sqrt{U} \times f$ curve deduced from 16-term calibration remains stable throughout the frequency range and reproduces a relatively consistent estimate of the
$f_{\mathrm{max}}$ value under different circumstances, such as bias conditions and the technology node.• The statistical analysis of the two calibration techniques used to extract the values of
$f_{\mathrm{max}}$ indicates that the 16-term calibration is essential for the accurate characterization of devices with smaller emitter width.


Acknowledgements
The authors thank S. Schulz for on-wafer measurements.
Funding statement
This work was supported in part by the Deutsche Forschungsgemeinschaft (DFG) under grants FL 1201/1-1 and HE 1676/25-1. Also, parts of the work were performed in the framework of the European Partnership on Metrology (EPM) project under grant 23IND10 OnMicro. The 23IND10 OnMicro project was co-financed by the Horizon Europe Research and Innovation Program of the European Union and by the Participating States. With regard to the InP transistor process, funding by the German BMBF through the Research Fab Germany (FMD) under reference FMD02 and within the project 6G-RIC (reference 16KISK024) is gratefully acknowledged.
Competing interests
The authors declare none.

Abhijeet Kanitkar (Member, IEEE) received the B.E. degree in Electronics and Telecommunication Engineering from India in 2012 and the M.Sc. degree in Micro and Nano Systems from the Technical University of Chemnitz, Chemnitz, Germany, in 2018. Since 2022, he has been a Scientific Researcher with the Ferdinand-Braun-Institut für Höchstfrequenztechnik (FBH), Berlin, Germany. He is currently pursuing the Ph.D. degree at the Technical University of Berlin, Berlin, Germany. His current research focuses on the on-wafer characterization of InP transistors for the accurate and reliable extraction of transistor figures of merit. Since December 2025, he has been an Affiliate Member of the IEEE MTT-S TC-3 Microwave Measurements Committee.

Ralf Doerner received the Dipl. Ing. degree in Communications Engineering from the Technische Universität Ilmenau, Ilmenau, Germany, in 1990. Since 1989, he has been working on microwave measuring techniques. In 1992, he joined the Ferdinand-Braun-Institut für Höchstfrequenztechnik (FBH), Berlin, Germany. His current research is focused on calibration problems in on-wafer millimeter-wave and sub-millimeter-wave measurements of active and passive devices and circuits. Further research activities include nonlinear characterization of microwave power transistors and noise characterization and modeling of microwave devices.

Tom K. Johansen (Member, IEEE) received the M.S. and Ph.D. degrees in Electrical Engineering from the Technical University of Denmark, Kongens Lyngby, Denmark, in 1999 and 2003, respectively. In 1999, he joined the Technical University of Denmark, where he is currently an Associate Professor. From September 2001 to March 2002, he was a Visiting Scholar with the Center for Wireless Communication, University of San Diego, San Diego, CA, USA. He has spent several external research stays with the Ferdinand-Braun-Institut für Höchstfrequenztechnik (FBH), Berlin, Germany. His current research interests include high-frequency integrated circuit design, sub-THz electronics, and packaging techniques.

Wolfgang Heinrich (Life Fellow, IEEE) received the Ph.D. and Habilitation degrees from the Technical University of Darmstadt, Darmstadt, Germany, in 1987 and 1992, respectively. Since 1993, he has been with the Ferdinand-Braun-Institut für Höchstfrequenztechnik (FBH), Berlin, Germany, where he is the Head of the Microwave Department and the Deputy Scientific Director. Since 2008, he has also been a Professor with the Technical University of Berlin, Berlin. He has authored or co-authored more than 400 peer-reviewed publications and conference contributions. His present research interests include MMIC design with an emphasis on GaN and InP power amplifiers, and millimeter-wave (mm-wave) and sub-mm-wave integrated circuits and packaging.

Thomas Flisgen received the Diploma degree in Electrical Engineering/Telecommunications Engineering from the Hochschule Niederrhein, Krefeld, Germany, in 2007, and the master’s and Ph.D. degrees in computational engineering from the University of Rostock, Rostock, Germany, in 2009 and 2015, respectively. From 2017 to 2018, he was a scientist for wakefields and impedances with Helmholtz-Zentrum Berlin. From 2018 to 2024, he was the head of the electromagnetic field simulation group with the Ferdinand-Braun-Institut für Höchstfrequenztechnik (FBH), Berlin, Germany. Since autumn 2024, he is a Full Professor at the Brandenburg University of Technology and holds the Chair of Electromagnetic Field Theory.



















 Open access

