Well-developed interest group systems foster many benefits;Footnote 1 they help ‘make democracy work’ by promoting efficiency and responsiveness on the part of governments and they foster opportunities for social and political engagement among citizens.Footnote 2 Yet prominent scholars have argued that the interest group sector has been transformed by the rise of more professionalized, advocacy-oriented groups that focus on attracting financial support from ‘chequebook’ members while de-emphasizing the personal involvement of individuals in their organizations.Footnote 3 To what extent are these changes reflected in communities? If it is true that contemporary interest groups rely more heavily on financial capital than they do on human capital, then we might expect those groups to be more prevalent in communities with an abundance of financial resources. Ironically, more affluent communities are also those that are least in need of the benefits that a strong interest group system offers, reinforcing the widely held belief that the interest group system is biased in favour of the wealthiest members of society.Footnote 4
In this article, we examine whether this intuition is correct. We ask whether interest groups are more prevalent in communities with more financial resources and probe the extent to which human capital is also sufficient for supporting a strong interest group sector. Comprehensive explanations for the wide variation in interest group strength across communities in the United States are lacking, despite the demonstrated significance of such groups in providing a host of individual and community-level benefits. The few studies examining this question provide a less than satisfactory account of the factors that explain why more groups locate in one area than in another; in part, this is because scholars typically focus on only certain kinds of interest organizations, such as specific types of charities,Footnote 5 or gay and lesbian rights groups,Footnote 6 groups that lobby,Footnote 7 or groups within a single state.Footnote 8
Gray and Lowery offer the most extensive analysis of the factors that influence the prevalence of groups at the state level.Footnote 9 They show that the number and type of interest groups lobbying in a state can be explained in part by political and economic variables, including government spending, continuity in the political environment (i.e. changes in the partisan control of the government), and the gross state product. However, Gray and Lowery focus only on a subset of groups that have a registered state lobbyist, which means they exclude many organizations that exert political influence beyond directly lobbying state governments. Lowry extends this scope of analysis to examine the factors affecting the prevalence of all organizations across states.Footnote 10 He finds that education – one potential source of human capital – is a consistent and important predictor of the number of groups in a state.
Our study expands on this extant research in two ways. First, we take a more disaggregated approach to this scope of inquiry by examining the factors that serve to enhance or diminish the strength of the interest group sector in 195 American media markets.Footnote 11 Secondly, we focus on a range of indicators to determine the relative effects of two factors on interest group density: the pool of individuals with the capacity to provide funding to groups (a community's financial capital) and the pool of individuals with the capacity to volunteer for local organizations (a community's human capital). Our findings indicate that human capital plays a far more important role than financial capital in affecting the strength of a community's interest group sector, shedding light on a robust debate among political scientists as to the relative importance of funding versus the presence of individuals willing to invest in organizational life.Footnote 12 What our analysis suggests is that communities with the most financially secure populations are not especially advantaged in terms of the capacity to create strong group sectors. In fact, financial deficits can be overcome to a significant degree in the presence of sufficient supplies of potential volunteers and conditions that provide residents with the incentive to invest in their communities.
We begin by outlining the consequences of strong interest group sectors for American communities. We then consider the relative importance of financial capital and human capital in promoting vibrant interest group sectors. We follow by presenting our analysis of the factors that explain interest group prevalence across 195 American communities (as defined by media markets), before concluding with a reflection on the significance of these findings for broadening our understanding of the contextual factors that foster (or inhibit) a strong interest group sector.
The value of strong interest group sectors
In this article, we are interested in the strength of a community's interest group sector as measured by the number of non-profit organizations per capita.Footnote 13 Although many non-profit groups may not have been formed for primarily political purposes (and may be limited by their tax status in the extent to which they can formally lobby government), many are concerned with agenda setting and legislative outcomes and all have the opportunity to play distinct roles in mobilizing citizens and in providing elected officials with information. Non-profit organizations may, therefore, play a significant role in shaping public policy and enhancing the quality of civic life.Footnote 14 Accordingly, robust interest group sectors supply more benefits to their communities than anaemic ones.
Among the noteworthy contributions of interest groups is their capacity to represent diverse interests by mobilizing and informing citizens, thereby strengthening democracies.Footnote 15 Voluntary associations may engender trust among citizens,Footnote 16 reinforcing social and community ties.Footnote 17 To some extent, groups may enhance democracy because they stimulate individuals to participate in other organizations and civic activities.Footnote 18
Strong associational systems may also promote more responsive and efficient governments.Footnote 19 Interest groups behave as intermediaries between citizens and policy makers, conveying essential information between the public and its government. Group members share valuable information about the problems endemic to (or newly arising within) their localities with the groups to which they belong.Footnote 20 Groups are far more likely than the average citizen to possess expert familiarity with a policy area, information and other resources enabling them to craft or weigh in on policy solutions to those problems. For this reason, nonprofits – even those that do not formally lobby the government – may be brought into the political arena by legislators or bureaucrats or even seek other avenues to influence the policy process. In fact, although lobbying is not the primary activity of non-profit organizations, as Berry notes:
The strategy of nonprofits is to use their expertise to build ongoing relationships with those in government. As officials interact with non-profit leaders, they will come to appreciate their knowledge of issues and policies and come to respect them for the way they administer government-sponsored programs. As trust builds, the non-profit hopes it will be increasingly integrated into the governmental process.Footnote 21
Thus, as a result of their expertise and proximity to constituent concerns, interest groups, including nonprofits, are often invited to share their insights with elected officials at all levels of government for the purposes of policy making. Interest groups also monitor the responsiveness of elected officials and can alert voters when they secure, or fail to secure, resources for their community.Footnote 22 Presumably, the representation of communities is enhanced when more groups are available to monitor elected officials and become trusted sources for policy makers on the many issues that may concern those locales.
In addition to heightening accountability in the foregoing ways, groups also provide a vehicle for citizens to influence their government by directly lobbying public officials and office holders or mobilizing others to lobby at their behest. While most citizen groups do not employ professional lobbyists, many types of interest groups are increasingly employing ‘outside lobbying’ tactics – mobilizing their members and/or the public to influence legislators.Footnote 23 While there is only limited evidence of their direct influence on congressional roll-call voting, interest groups do appear to influence government actions that are beyond public view.Footnote 24 For example, Hall and Wayman find that interest groups are successful in prompting their congressional supporters to become more involved in committee deliberations and in behind-the-scenes committee negotiating.Footnote 25 A community with a dense network of groups may be more likely to engage in either insider or outsider lobbying activities, in part because groups within the network can share their expertise and allocate scarce resources more efficiently when there are more of them.Footnote 26 Finally, many types of interest groups contribute to their communities by applying for government grants,Footnote 27 and communities with a higher density of interest groups draw more federal grants.Footnote 28
Among their many contributions to civic life, then, interest groups stimulate citizen engagement in the political process, both among their own members and within the polity, more generally speaking. Groups do this, at least in part, by furnishing members (and their communities) with salient information and by engaging in mobilization. Groups – even those that are not typically active in the political process or in lobbying – also act as information conduits between the public and elected officials. Furthermore, they garner attention to and resources for their communities from policy makers. As a result, areas with stronger interest group sectors have more engaged populations and receive more federal assistance at the macro level. Although strong interest group sectors appear to engender highly desirable sociopolitical outcomes, the factors that promote such sectors are not well understood. We turn to this question in the following section.
Explaining interest group sector strength: financial or human capital?
Research on interest group formation and maintenance conventionally focuses on case studies or survey research of limited numbers of organizations and highlights relatively idiosyncratic factors such as the intervention of patrons willing to fund an organization's endeavoursFootnote 29 or the exertions of entrepreneurial leaders willing to take on the burden of organizing.Footnote 30 We draw from these theories in developing our expectations about the relative importance of a community's financial and human capital for supporting a strong interest group sector. For the most part, these surveys and case studies of individual interest groups tend to emphasize the importance of financial resources. Specifically, this work has found that patrons or large donors figure prominently in the life of individual interest groups.Footnote 31 Institutional or individual patrons with a particular interest in a group's mission may provide essential material resources such as telephone lines, offices and cash to provide seed money or to fund ongoing costs of organizing.
Contributions of patrons or donors are nonetheless unlikely to sustain groups alone; typically, groups also rely on other sources of income, including their ability to cultivate new donors and retain existing ones.Footnote 32 In fact, for many interest groups, public donations constitute a substantial proportion of their budget.Footnote 33 According to the National Centre for Charitable Statistics, approximately a quarter of the revenue reported by public charities in 2004 came from individual contributions. Members, donors and sympathisers – groups’ constituencies – arguably comprise interest groups’ most critical resource. To sustain themselves, even interest groups that are primarily focused on lobbying must also attend to many other costly functions that pertain to their constituency, such as governance and grassroots activities that inform, mobilize, solicit contributions and canvass constituents’ preferences about policy issues and concerns.Footnote 34 To thrive, groups require resources outside the political realm, such as supportive constituencies.Footnote 35 Simply put, resources beget resources – in order for groups to engage in the political system, they must sustain their operational functions. An accounting of the strength of the interest group sector in a community must therefore consider the prevalence of financial resources among local constituencies that groups may draw upon.
Consonant with the prevailing wisdom of micro-level studies of interest group formation and survival, the vitality of the interest group sector in a locale should be strongly influenced by the public's capacity to act as donors or patrons; in other words, a community's financial capital. However, monetary donations are not the only way that citizens can support interest groups; they may also benefit from the supply of human capital present in a community. Communities with greater stocks of human capital are those that house an abundance of individuals who are available and motivated to volunteer their time and skills to form and support groups.
Survey research has found that an individual's propensity to volunteer is affected by how embedded he or she is in the community. Putnam notes that the literature is quite clear on this point: ‘frequent repotting disrupts root systems. It takes time for a mobile individual to put down new roots. As a result, residential stability is strongly associated with civic engagement.’Footnote 36 ‘Root systems’ are also likely to be affected not only by residential mobility, but also by such features as commute times; indeed, ‘the evidence suggests that each additional ten minutes in daily commuting times cuts involvement in community affairs by 10 percent’, according to Putnam.Footnote 37 More time in the car may mean less time to spend in local organizations. Perhaps most intriguing, however, is the fact that long drives to work affect all members of the community – non-commuters as well as commuters.Footnote 38 Thus, a community's supply of human capital will be particularly sensitive to how stable and embedded residents are and how much discretionary time they have available to contribute to organizations.
Research on volunteering also tends to stress the importance of age and education.Footnote 39 With regard to the latter, more educated individuals tend to be more aware of community problems, more empathetic, and more confident, which stimulates them to become more involved in associations.Footnote 40 Age is also important. Individuals tend to be more self-oriented in young adulthood, but become more focused on community and group causes as they enter middle age.Footnote 41 This is also the period during which they have the greatest capacity to volunteer. Thus, communities with more educated and more middle-aged citizens should provide more human capital for supporting groups.Footnote 42
Which of these factors – financial capital or human capital – is more important in predicting interest group density? Nownes and Neeley argue: ‘The data suggest we should reject any strong version of Jack Walker's argument about the importance of patrons in group mobilization.’Footnote 43 Nevertheless, Skocpol argues that the civic life of Americans has been transformed over the past half-century by the rise of more professionalized, advocacy-oriented groups and a decline of fellowship organizations.Footnote 44 One consequence of the trends that Skocpol and others point to is the rise of ‘chequebook’ membership, where membership is characterized by a monetary contribution rather than interaction with other members.Footnote 45 The trend towards chequebook membership is consequential for civic participation and engagement in public life and voluntary organizations. As groups become increasingly professional and hire trained and experienced staff to run their organizations, co-ordinate their fund-raising efforts and foster ties with government, they become less reliant on volunteers from the community and more reliant on financial contributions. As a result, we might expect that financial resources, according to the rationale of chequebook membership, will be a better predictor of the robustness of an interest group sector than a population's human capital. Communities that can supply more financial capital, then, may also support more groups. Yet Lowry demonstrates that the percentage of college-educated citizens in a state is a more consistent predictor of interest group strength than income, suggesting that human capital may be at least as important as financial capital in affecting the strength of a community's interest group sector.Footnote 46 In the following section, we describe our approach for determining the relative importance of each factor in affecting interest group sector strength.
Analysing interest group sectors across American communities
The theoretical and empirical boundaries of the term ‘interest group’ vary widely among scholars;Footnote 47 as discussed above, however, we maintain that a more inclusive definition of non-profit interest groups best captures the significance of a community's interest group sector. Accordingly, our dependent variables are the number of non-profit organizations per 1,000 citizens in each community and the gross per capita revenues of these organizations. In this sense, we agree with Berry and Arons who argue that even with the disincentive to lobby built into the 501(c)3 status, nonprofits are best characterized as interest groups.Footnote 48 We began by including all organizations with a 501(c)3, 4, 5, 6, 7, 8, or 19 classification. Other 501(c) classifications (which include institutions such as credit unions and life insurance groups) were excluded from the analysis and we removed schools and hospitals since these entities behave more as institutions than interest groups in their communities and in relation to their local governments.Footnote 49 We also removed churches from the dataset since they are generally exempt from filing the Form 990 tax documents that we use to collect data on the organizations. As a result, the NCCS data do not provide a comprehensive measure of the prevalence of religion-based organisations.Footnote 50
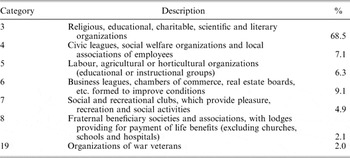
Following Powell and Steinberg,Footnote 51 who argue that employing Internal Revenue Service (IRS) data is a reliable means of measuring numbers of non-profit organizations, we employ a dataset created by the National Council of Charitable Statistics (NCCS), which includes each 501(c) organization that filed a 990 form with the IRS for 2002. According to the Internal Revenue Code, any non-profit organization with revenue over $25,000 is required to file a 990 form with the IRS, but many organizations whose revenues do not meet this bar also file this form. The data from the NCCS include information about where each group is located and the budget for the organization.Footnote 52 After removing schools, churches and hospitals from the dataset, 315,224 organizations remained (for a distribution of groups by 501(c) subsection, see Appendix 1).
We used this information to create a measure of how many groups were located in each of 195 media markets across the United States and what the total gross revenue for those groups was.Footnote 53 We use the media market as our unit of analysis because doing so provides us with an inclusive measure that provides an approximate designation of American communities. An analysis at the county level is too disaggregated – indeed, many metropolitan areas (or even smaller communities) span several counties. In addition, county boundaries were created in different ways in each state, which means they are not standardized across states. For example, Georgia has 101 more counties than California despite the fact that California is larger and more populated. Thus, a higher level of aggregation is appropriate. Metropolitan statistical areas (MSAs), another common unit of analysis, are also limited in that they exclude a significant portion of the United States – approximately two-thirds of all counties do not fall within an MSA. Thus, an analysis that uses MSAs as the unit of analysis excludes a significant (less urban) portion of the US population. We use the media market as our unit of analysis because markets are created at a higher level of aggregation while also including nearly all US counties. Nevertheless, to demonstrate the robustness of our central findings, we also present the results from a county-level analysis of our data.
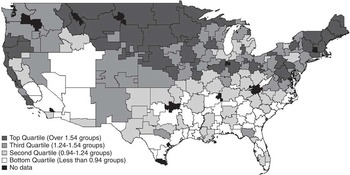
According to our data, the number of groups in a market varies dramatically. For example, the North Platte (NE) and Laredo (TX) markets have fewer than a hundred organizations located in their area while the New York City market is home to over 28,000 organizations. Of course, much of this variance is driven by population differences across these markets, which is why we use a per capita measure of interest group sector strength. Based on this measure, the average market has 1.24 groups per 1,000 residents. However, Figure 1 demonstrates that the strength of the interest group sector also varies substantially across markets. Interest group strength appears to be greatest in a band of communities stretching from the Northeast, through the upper Midwest and into the Great Plains. The West Coast also includes a number of communities with strong interest group sectors. In contrast, markets in the South are much less likely to have strong interest group sectors. Overall, the market with the weakest interest group sector is Laredo, which has fewer than 0.4 groups per 1,000 residents. At the other extreme, the market with the strongest sector is Burlington (VT), which has 2.28 groups per 1,000 people. To put that figure in perspective, if Burlington was the size of New York City, it would have more than 46,000 groups; if Laredo had New York City's population, it would have fewer than 7,700 groups. Thus, the strength of the interest group sector varies substantially across different communities.
Distribution of interest groups across US media markets
Note: The shaded regions relate to the number of groups per 1,000 residents.

As noted above, we expect that a community's financial and human capital will explain a significant amount of the variance in interest group sector strength. We discuss these measures and introduce our control variables below. Each variable is created from US Census data, unless otherwise noted.Footnote 54
Financial Capital
The first set of factors we include in our model captures the capacity of a community's population to contribute financially to the interest group sector. Specifically, interest groups will be better positioned to attract financial contributions from communities with higher income populations. We include two measures of a market's income. The first is simply the median income in a market and the second is the percentage of the population in that market that earns more than $200,000 per year.Footnote 55 The latter variable captures the pool of potential group patrons in a market while the former provides a measure of a community's contributor base. We expect markets with higher incomes to have more patrons and contributors and, as a result, more groups (see Appendix 2 for an analysis using an alternative measure of financial capital).
Human Capital
The human capital available in a community is a function of the population's residential mobility, commuting times, education and age. Residential mobility is measured as the percentage of the population that has moved to an area from out of state during the past year. As people live in a community for a longer period, they tend to invest more in that community. Thus, communities with more stable populations are likely to provide a better source of potential members and organizers for groups compared to areas with more transient publics. In-migration rates ranged from 2.5 per cent in the Fresno-Visalia market to over 27 per cent in Las Vegas. We expect cities like Las Vegas to have fewer groups given that a significant share of their residents is composed of newcomers to the community.
While the number of hours that people spend working tends to be fairly consistent across different communities, the time spent getting to and from work differs dramatically across different areas. The community with the shortest commute is the Cheyenne market, where only 10.6 per cent of the public has a commute time longer than 30 minutes; on the other hand, over 50 per cent of the New York market has a commute time of at least 30 minutes. A population that spends more time commuting to and from work will have less time to offer to interest group organizations seeking volunteers. Therefore, we expect that interest group organizations will be more prevalent in communities with shorter commute times.
We also include the percentage of a community's adult population that is college-educated and the percentage that is middle-aged (35–64 years old). The percentage of college-educated citizens varies significantly from El Centro-Yuma (AZ), where less than 11 per cent of adults over 25 years of age have a bachelor's degree, to Charlottesville (VA), where over 43 per cent of adults are college-educated. The size of the middle-aged population ranges from 29 per cent in Laredo (TX) to almost 42 per cent in Alpena (MI). We expect that markets with more college-educated and middle-aged populations will be able to support more interest groups.Footnote 56
Control Variables
In addition to the measures of financial and human capital, we also control for a number of community characteristics that may influence the strength of the interest group sector. Following the work of Gray and Lowery and of Boehmke,Footnote 57 we expect that political opportunities are likely to be central to understanding variation in interest group density.Footnote 58 Many interest groups are interested in securing access to political institutions – to gain information, to lobby and/or to obtain funding, for example – and we hypothesize that locating in the vicinity of governmental entities reduces the costs of obtaining those benefits. We employ two measures to capture political opportunities. First, we include a dummy variable for whether a market includes a state capital since groups are more likely to form near seats of governments. This variable is also set to 1 for Washington, D.C. Of the 195 markets we include in this analysis, about a quarter include a capital. Secondly, we also include the number of city or town governments in a market based on similar reasoning. Since more populated markets are more likely to have large numbers of towns and cities, we use the number of municipal governments per 1,000 citizens in the market. The information on municipalities was compiled from the 2002 US Census of Governments. The number of municipal governments per capita ranges from 0.005 in the Las Vegas market (which has just seven municipal governments) to 2.62 in the Minot–Bismarck–Dickinson (which has 199 local governments), with the average market having 0.24 cities per 1,000 residents.
Interest groups must also compete with churches for volunteers. Indeed, individuals who belong to a congregation often spend time not only in worship, but also engaging in community service and other activities sponsored by the church. Thus, communities with more church members may be less able to provide the volunteer capacity necessary to support a vibrant interest group sector.Footnote 59 Church membership ranges substantially with just 24 per cent of those in the Medford (OR) market belonging to a congregation while over 78 per cent of those in the Lafayette (IN) area are church members.Footnote 60 We expect that as church membership increases in a community, there will be fewer interest groups per capita.
Citizens who live in urban settings may face different costs or incentives for forming and joining organizations compared to those living in suburban or rural areas. Specifically, the size and density of cities may create a barrier to citizens creating relationships with others that people living in rural areas do not face.Footnote 61 Since citizens in these locales are less likely to know their neighbours or encounter people they know in public places, they may also be less likely to join with these people to form organizations.Footnote 62 Indeed, Oliver finds that citizens living in urban areas are much less likely to report having attended a meeting of a voluntary organization compared to those living in less populated areas.Footnote 63 He argues that this is a consequence of the fact that citizens in urban areas have fewer social ties, making it harder for organizations to recruit members.Footnote 64 Therefore, we include a variable to control for the percentage of the population living in an urban area. The average market has 65.7 per cent of its population living in urban areas, but this varies from just 22.7 per cent in Presque Isle (ME) to 99.6 per cent in Miami (FL).
Another factor that may affect the presence of organizations in a particular area is the heterogeneity of the population. More diverse environments may depress the vitality of organizations. Citizens tend to prefer interactions with people who are similar to them, particularly with regard to race or ethnicity.Footnote 65 In fact, trust is lower in areas that have high levels of racial and ethnic diversity, and citizens are less likely to participate in groups with people of other races or ethnicities.Footnote 66 Thus, we expect to find fewer organizations in areas that have higher levels of racial and ethnic diversity. To measure the racial and ethnic heterogeneity of a market, we use the percentage of each market's population that is non-Hispanic white. The average market is 86.2 per cent white.Footnote 67
Finally, it may be the case that more liberal communities support more interest group organizations. As governments adopt more activist policies, they also create more like-minded constituencies that benefit from those policies. These groups will have an incentive to mobilize and form organizations to lobby for the continuation and expansion of such policies. Indeed, Boehmke finds that liberal states tend to have more interest groups than states that are more conservative.Footnote 68 To capture the liberalism of a media market, we use the 2000 presidential vote for the Democratic candidate, Al Gore. In the average market, the vote for Gore was 44.7 per cent; however, that value ranged from just 22.2 per cent in Amarillo (TX) to 68.4 per cent in San Francisco.
Results
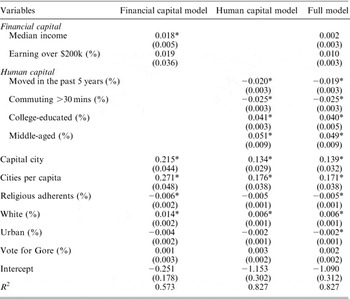
Table 1 presents the results from three nested models estimating the number of interest groups per 1,000 citizens across all 195 media markets. Since our dependent variable is continuous, we use ordinary least squares regression with Huber/White robust standard errors to account for heteroscedasticity. The financial capital variables are highly correlated with some of the human capital measures (particularly the percentage who are college-educated and the percentage with commutes longer than 30 minutes); therefore, we estimated three separate models to understand fully the contribution that each set of variables makes to interest group strength. The first model only includes the financial capital variables. The second model includes just the human capital variables, and the third model is the full model, which includes both sets of covariates. Comparing the coefficients and R 2 values across these models provides support for the notion that financial capital is of little importance when it comes to supporting a strong interest group sector. While median income is statistically significant and in the expected direction in the first model, it is no longer significant after the addition of the human capital variables in the full model. In fact, the coefficient for median income loses over 85 per cent of its value, dropping from 0.018 in the first model to 0.002 in the full model (while the standard error remains unchanged). This indicates that much of the effect being credited to median income in the first model was actually the result of bias caused by omitting the human capital measures. Once those measures were added to the model, the coefficients for the financial capital variables were quite small and did not approach conventional levels of statistical significance.
OLS Models Estimating the Number of Interest Groups Per Capita (Robust Standard Errors in Parentheses)

Notes: N = 195 markets, *p < 0.05.
Also notable is the fact that while the model including only the financial capital variables (Model 1) explained just 57 per cent of the variance in interest group sector strength, the human capital model explained nearly 83 per cent of the variance in the dependent variable. In fact, the full model, which included both the financial and human capital variables, produced no appreciable change in the R 2 over the model that excluded the financial capital variables. Once we have accounted for the human capital in a particular market, adding measures of financial capital adds virtually no explanatory power to the model. These patterns suggest that the existing work suggesting that groups rely mostly on patrons and contributors for their survival does not easily translate to the community level. We will return to this point in the conclusion.
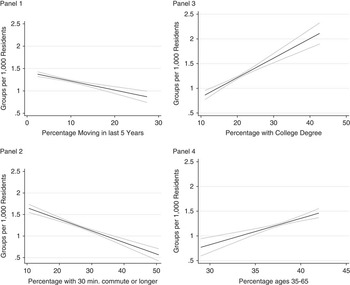
While financial capital appears largely unrelated to a community's interest group sector strength, each of the coefficients for the human capital variables is statistically significant and in the expected direction. Furthermore, the substantive effects of these variables are quite large. Figure 2 presents the effect of each of these variables on the predicted number of groups per capita while holding the other variables in the model at their means. The figure also includes 95 per cent confidence intervals surrounding those predictions. The first panel in the figure shows that areas with more transient populations tend to support fewer interest groups than those with more stable populations. On the one hand, markets where only 6 per cent of the population had moved within the past year had a predicted 1.30 groups per 1,000 residents. On the other hand, when 11 per cent of residents had moved to the area within the past year, the market supported 1.20 groups per capita. To put this figure into perspective, consider that for the median size market in our analysis (Evansville, IN, population 734,837), this would amount to a difference of seventy-four organizations. Since people are more likely to invest in communities (and the interest groups serving their communities) where they have lived for a longer time, populations with more stable populations tend to support stronger interest group sectors.
Effect of human capital on interest group sector strength
Note: Generated from the coefficients listed in Table 1, with all other variables held at their means.

The second panel in Figure 2 indicates that commute times also have a strong influence on the strength of a community's interest group sector. Areas where only 20 per cent of workers face a commute longer than 30 minutes have a predicted 1.39 groups per 1,000 residents while those where 30 per cent have a commute longer than 30 minutes have just 1.12 groups per capita. In a market the size of Evansville, this would translate to a sizeable difference of nearly 200 groups. Thus, commute times play an important role in affecting the strength of the interest group sector across American communities as organizations appear more likely to form in areas where people spend less time in their cars and have more time to engage with groups.
Another strong effect in the model is that for the education variable. The third panel in Figure 2 demonstrates that a market where just 17 per cent of the population holds a bachelor's degree will support a predicted 1.10 groups for every 1,000 residents. On the other hand, a market where 24 per cent of the public has a college education will support 1.37 groups per capita. In a median-sized market, this would translate into a difference of 198 groups, which underscores the important effect that education has on interest group sector strength.Footnote 69 More educated citizens are more likely to volunteer their time; relatedly, more educated communities appear to support more interest groups.
Finally, research on voluntarism has found that middle-aged people are more likely to volunteer than those at other stages in their life. Our model finds that interest groups thrive in areas that have more middle-aged people. In fact, the predictions presented in the fourth panel of Figure 2 indicate that markets where 39 per cent of the residents are between 35 and 64 years of age have 0.11 more groups per capita than those where 37 per cent of the public falls into this age group. This would translate into an eighty-group difference in a market the size of Evansville; as with the other human capital variables in the model, this is a substantively significant effect.
Most of the control variables in the model also had statistically significant coefficients in the anticipated direction. Political opportunities are clearly important for fostering a strong interest group sector. The coefficient for the dummy variable for capital is positive and statistically significant, indicating that markets that include capital have 0.14 more organizations per 1,000 citizens than those that do not. The coefficient for the number of municipalities per capita is also statistically significant and positive. However, the effect of this variable was less pronounced. Moving from 0.06 cities per 1,000 citizens to 0.28 results in a predicted increase of just 0.04 groups per capita.
The coefficients for the percentage of urban variables and percentage of white variables are also statistically significant, indicating that more urban and racially heterogeneous markets tend to support fewer groups per capita than those with more rural and homogeneous populations. In addition to being statistically significant, both effects are quite strong. A market with a relatively small share (53 per cent) of its population living in urban areas supports 0.07 more groups per 1,000 citizens than a market with a relatively high percentage (79 per cent) living in an urban area. This would be equivalent to fifty-one fewer interest groups in a median-sized market. The effect for racial homogeneity is even larger – the change from a relatively low (75 per cent) to a relatively high percentage (93 per cent) of white citizens in a market leads to a 0.11 increase in the number of groups per 1,000 citizens. In a median-sized market, that would translate to an increase of eighty organizations. Since urban and heterogeneous environments tend to decrease the propensity of individuals to interact with their neighbours or join organizations, these locales tend to support fewer groups per capita than more rural and homogeneous communities.
The measure of church membership in a market was statistically significant and negative. The coefficient indicates that a market where 42 per cent of the population belongs to a church has 0.07 more groups per 1,000 citizens than one where 58 per cent belong. Thus, the interest group sector appears to suffer when a greater percentage of the population belongs to a church. Finally, the variable for presidential vote fell short of statistical significance, indicating that the ideological predispositions of a community do not appear to be an important factor affecting the vitality of that area's interest group sector.
Analysis of Interest Group Sector Revenue
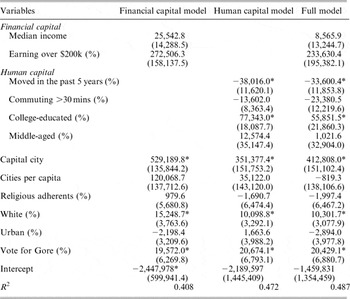
While the results presented in Table 1 provide fairly strong evidence to support the importance of human capital in promoting a strong interest group sector, it may be the case that some markets support numerous small organizations while others support a smaller number of large groups. To address this possibility, Table 2 estimates the same models as those presented in Table 1, except that the dependent variable in this case is the total amount of interest group revenue per 1,000 residents. Since larger groups will generally have larger budgets, this variable simply accounts for interest group sector strength as a function of how much gross revenue organizations have in each market. The use of this dependent variable is also more likely to advantage the financial capital variables since it directly captures the financial resources of organizations in each locale rather than their mere presence.
The results in Table 2 differ somewhat from those presented in Table 3, but our main conclusions remain the same. The reduced financial capital model has a lower R 2 value than the reduced human capital model (0.408 versus 0.472), indicating that the human capital variables do a better job of explaining interest group revenue per capita than the financial capital variables. Furthermore, the third model, which includes the financial and human capital variables, improves only slightly upon the reduced human capital model (R 2 = 0.487) and neither of the financial capital variables included in that model approach conventional levels of statistical significance. With regard to the human capital variables, education and residential mobility both have statistically significant and strong effects on interest group revenue. For each additional 1 per cent of a market's population that has a college degree, the model predicts that interest group sector revenue will increase by nearly $56,000 for each 1,000 citizens. Interest group sector revenue will decrease by $33,600 for each additional 1 per cent of the market that has moved in the past five years. However, the coefficients for the other human capital variables lack statistical significance, indicating that commute times and the percentage of the market that is middle-aged are less influential in affecting interest group sector revenue than they are in affecting the number of groups present in an area. Nevertheless, the results from the analysis of interest group sector revenue leads to similar conclusions as the analysis of the number of interest groups per capita – a community's human capital appears to be more important than its financial capital for supporting a strong interest group sector.
OLS Models Estimating Interest Group Revenue Per Capita (Robust Standard Errors in Parentheses)

Notes: N = 195 markets, *p < 0.05.
County-Level Analysis
As noted above, we chose the media market as our level of analysis since markets come closest to representing the boundaries of large communities while also incorporating nearly all of the United States. Nevertheless, we conducted a parallel analysis at the county level to ensure that our findings are not dependent on using market-level data.
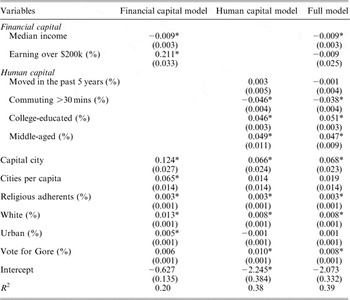
Table 3 presents the results from the county-level models that were estimated to replicate the analysis we presented in Table 1. Though the R 2 values are smaller for these models, they follow the patterns uncovered in the market-level analysis. The reduced financial capital model explains just 20 per cent of the variance in interest group sector strength while the reduced human capital model explains 38 per cent of the variance. Adding the financial capital variables to the human capital model (to produce the full model) results in little added explanatory power over the reduced human capital model. This supports our conclusions that human capital variables go farther in explaining the prevalence of interest groups relative to measures of financial capital.
OLS Models Estimating the Number of Interest Groups Per Capita at County Level (Robust Standard Errors in Parentheses)

Note: N = 2,957 counties.
With regard to the effects of the individual measures, most generate similar effects as in the market-level model. The percentage of college-educated in a county, the percentage of a county's population that is middle-aged, and the percentage commuting to work longer than 30 minutes all have strong and statistically significant effects on the strength of the interest group sector. However, unlike in the market-level model, the percentage of the county's population that had moved there within the past five years does not have a significant impact on interest group sector strength. The percentage of the county making over $200,000 still lacks statistical significance in the full county-level model, but the median income in a county is actually statistically significant and negative. Counties with higher median incomes actually support fewer groups, though the effect is not nearly as pronounced as those produced by the human capital measures.
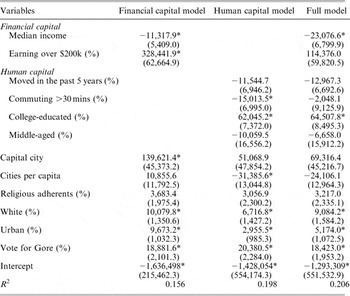
Finally, Table 4 replicates the analyses of interest group sector revenue at the county level. The main findings from Table 2 are also borne out in Table 4. While the R 2 square values are smaller for the county-level models, it is still the case that the reduced human capital model explains a larger share of the variance (about 20 per cent) in interest group sector revenue than the reduced financial capital model (about 16 per cent). Furthermore, adding the financial capital variables to create the full model results in little additional explanatory power. In the full model, the coefficient for the percentage of the county's population earning over $200,000 per year lacks statistical significance and while the coefficient for median income is statistically significant, it is in the opposite direction than expected. Thus, counties with higher median incomes actually generate less interest group sector revenue per capita. As in Table 2, the only human capital variable that was statistically significant in the full model was for education. The model estimates that for each additional 1 per cent of the county that has a college degree, interest group sector revenue will increase by more than $64,000 per 1,000 residents.
OLS Models Estimating Interest Group Revenue Per Capita at County Level (Robust Standard Errors in Parentheses)

Notes: N = 2,957 counties, *p < 0.05.
While there are some differences in the models estimated at the county level compared to the market level, the county-level analysis confirms the conclusions we drew from our market-level analysis. Overall, our analysis of interest group density sheds important new light on the nature of interest group sectors in the United States while qualifying the concerns of those who argue that individual citizens no longer constitute the backbone of the interest group sector.Footnote 70 By far the strongest influence on the strength of the interest group sector is the supply of human capital in a community. In contrast, a community's financial capital did not appear to contribute to interest group sector strength, even when the measure of strength was interest group sector revenue. Next, we consider the implications of our findings for the role that interest groups play in representing community interests in the American political system.
Conclusion
Robust interest group systems foster many benefits for the communities in which they are located, including the enhancement of representation at all levels of government, strengthening the link between citizens and elites, and providing opportunities for social and political engagement. Yet we know very little about the conditions that support healthy interest group sectors and why we might see variation in their prevalence from community to community. To address this lacuna, we employ a macro-level lens to examine a wide swath of interest groups and American communities. We demonstrate that interest groups are not merely found in communities with the most financial resources, or the deepest pool of potential individual patrons or donors. Indeed, our analysis points to the contrary – an area's financial resources had a statistically and substantively marginal influence in our model. Rather, the strength of an area's interest group sector appears to be influenced by factors more closely related to the supply of human capital in that area. In localities where a larger share of the population is rooted in the community, spends less time commuting to work, is more educated, and more middle-aged, interest groups are more likely to thrive. Our findings cast new light on the widely held assumption that interest groups are fuelled more by ‘chequebook’ members than group members who are able to invest their time and non-monetary resources in an organization. The results here suggest that human capital is equally important, if not more so, to the existence of a strong interest group sector.
While these findings are encouraging, they also beg the question of how we are to make sense of the seemingly incompatible findings that financial resources are crucial to the formation and survival of individual groups, but they do not appear to be central to the strength of an interest group system. We suggest two possible reasons for the disparity. First, a significant amount of research on interest groups is focused on national-level organzations, groups within a single state, or those with a high profile in their communities.Footnote 71 Yet, in measuring the strength of an interest group system, we take into account all types of groups, large and small, national and local. It may be the case that patrons and contributors are particularly crucial for the maintenance and survival of a certain subset of organizations that attract more attention from scholars, but these dynamics may not apply to a broader conception of groups.
Secondly, research in other areas has often demonstrated that different levels of analysis often yield significantly different findings. This point is highlighted by Erikson, Mackuen and Stimson in The Macro Polity: ‘Although the electorate is simply the sum of voters, our knowledge of the individual voter turns out not to be a reliable guide for generalizing to the electorate and its role in democratic politics.’Footnote 72 Likewise, Gray and Lowery argue that ‘if we are to understand interest-group populations, we must employ theories designed to answer population-level questions’.Footnote 73 Our findings suggest that existing micro theories about interest group formation and maintenance may be ill suited to explain why some areas sustain a higher density of interest groups than others. Communities with more human capital tend to foster favourable environments for interest groups because they provide more resources for these organizations. Thus, our analysis indicates that future studies on the formation and maintenance of interest groups should consider not just the particular groups that may be the foci of the study, but also characteristics of the communities in which those organizations form, exist and thrive.
Finally, our findings provide a more encouraging assessment of the state of the interest group system in the United States than is sometimes reflected in the literature. The financial wealth of a community does not appear to be strongly related to that community's capacity to support a strong interest group sector. This finding is significant since strong interest group sectors have consistently been shown to encourage more active and engaged polities and areas with a greater density of organizations tend to attract more government support.Footnote 74 While by no means eliminating the bias in the interest group universe – after all, the presence of a more educated population suggests a significant bias in its own right – our analysis suggests that communities with less financial resources can overcome those deficiencies if they have a strong base of human capital to offer.
Appendix 1
Distribution of Groups by 501(C) Subsection

Appendix 2 Results from alternative specifications of models
A possible concern with our measures of financial capital is that while median income and the percentage of residents earning more than $200,000 per year may provide a reasonable approximation of a community's potential for funding interest groups, it does not directly measure the community's propensity to donate. To capture a market's propensity to donate to charitable causes, we rely on data provided by Lifestyle Market Analyst. The publication includes marketing data compiled by Price Waterhouse on a number of lifestyle factors and presents summary information about those data at the media market level. One measure asks people whether they contribute financially to charitable causes. In the average market, 50.8 per cent of the public reported donating to charitable causes. The least charitable market was Laredo, where only 35.2 per cent of the population reported donating, while Washington, D.C., had the most charitable population, with 58.5 per cent reporting they made donations. We are not fully able to vet the quality of this data, which is why we did not include it in the analysis presented in the model. However, we use it here as one way of testing the possibility that we are not fully operationalizing the concept of financial capital.
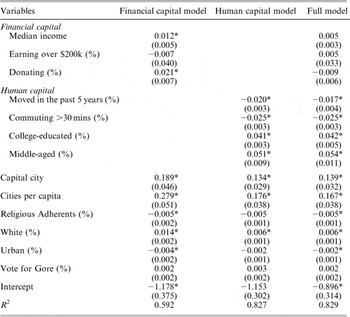
Table A2 presents the models from Table 1, with the charitable donation measure added to the set of financial capital variables. Overall, the addition of this variable results in almost no change in the substantive results. The coefficient for charitable donors in a market is statistically significant and positive in the reduced financial capital model, indicating that the presence of more donors in a market does increase the prevalence of interest groups. However, once we incorporate the human capital variables, the coefficient on this variable actually changes signs and loses statistical significance. And even with this additional measure of financial capital, the full model in Table A2 provides almost no improvement in fit over the human capital reduced model. We also tested interactions between this donation variable and the other financial capital measures, and adding those also failed to significantly improve the model's explanatory power.
OLS Models Estimating the Strength of the Non-profit Sector, with Added Measure for Percentage Making Charitable Contributions (Standard Errors in Parentheses)

Note: N = 195 markets.