I. INTRODUCTION
Silicon (Si) in its pristine diamond cubic (dc) phase can be transformed to different crystallographic structures through the application of mechanical stress.Reference Mujica, Rubio, Munoz and Needs1 Given its importance to electronic devices and microelectromechanical systems, and given that modifications of the Si crystallographic structure are connected to its performance-related properties, Si phase transformations have been intensively studied. At hydrostatic pressures of 10–16 GPa, Si undergoes a nonmetallic–metallic transition, as the dc structure of Si-I transforms to the denser body centered tetragonal (bct) β-tin structure of the Si-II phase.Reference Gupta and Ruoff2–Reference Hu, Merkle, Menoni and Spain4 Further compression leads to a sequence of transitions to other crystallographic phases.Reference Mujica, Rubio, Munoz and Needs1 On release of the hydrostatic pressure at ambient temperatures, the high-pressure phases do not recover to the dc structure but rather to other metastable phases in secondary phase transition processes. Slow decompression from the β-tin phase leads to the rhombohedral r8 (Si-XII) phase at about 10 GPa, which subsequently transforms to the body-centered cubic bc8 (Si-III) phase at about 2 GPa.Reference Crain, Ackland, Mclean, Piltz, Hatton and Pawley5
The possibility of generating large hydrostatic (and deviatoric) stresses when loading a sharp indenter onto sample surfaces, led researchers to suggest that indentation experiments could be used to study the phase transformation of materials,Reference Clarke, Kroll, Kirchner, Cook and Hockey6 especially in the case of Si, for which the hardness and the pressure needed to initiate the transformation to the β-tin phase are very similar.Reference Pharr, Oliver and Harding7 Initial evidence that indeed phase transformation processes took place during indentation experiments in Si was a large change in the electrical resistivity in a thin layer surrounding the indent.Reference Pharr, Oliver and Harding7–Reference Pharr, Oliver, Cook, Kirchner, Kroll, Dinger and Clarke9
With the introduction of instrumented indentation testing (IIT), which enabled the continuous measurement of force (load) and displacement during an indentation experiment, further evidence for phase transformation processes was found in an unusually large hysteresis in the load–displacement curvesReference Pharr, Oliver, Cook, Kirchner, Kroll, Dinger and Clarke9 and in discontinuities in the loading and unloading segments of such curves. Weppelmann et al.Reference Weppelmann, Field and Swain10 associated a change in slope of the loading curve with the phase transformation to the β-tin phase. Other groups found a plateaulike discontinuity in loading segments, or the so-called “pop-in” event.Reference Bradby, Willaims, Wong-Leung, Swain and Munroe11–Reference Ge, Minor, Stach and Morris14 Plastic flow initiated in the ductile β-tin phase, when the volume of the transformed material extends beyond the constrained region beneath the indentation contact, is believed to cause the pop-in event.Reference Bradby, Willaims, Wong-Leung, Swain and Munroe11 Discontinuities observed in the unloading segment of an indentation in Si are the so-called “elbow” and “pop-out” events. The elbow event, a gradual change of the unloading slope with decreasing depth, is associated with material expansion during a slow amorphization of the β-tin phase.Reference Domnich and Gogotsi15 The pop-out event, a pronounced force plateau in the unloading segment, is presumably caused by the expansion of material underneath the indenter during the r8 to bc8 transformation.Reference Domnich and Gogotsi15
To actually identify the structures generated in the phase transformation processes, many IIT studies using various auxiliary characterization techniques, such as atomic force microscopy,Reference Mylvaganam, Zhang, Eyben, Mody and Vandervorst16,Reference Ho, Chang and Lin17 scanning electron microscopy,Reference Pharr, Oliver and Harding7,Reference Kailer, Gogotsi and Nickel18,Reference Jang, Lance, Wen, Tsui and Pharr19 transmission electron microscopy,Reference Weppelmann, Field and Swain10,Reference Juliano, Domnich and Gogotsi12,Reference Ge, Domnich and Gogotsi20–Reference Haq and Munroe22 and Raman microspectroscopy,Reference Weppelmann, Field and Swain10,Reference Domnich and Gogotsi15,Reference Kailer, Gogotsi and Nickel18,Reference Jang, Lance, Wen, Tsui and Pharr19,Reference Gerbig, Stranick and Cook23–Reference Puech, Demangeot, Pizani, Domnich and Gogotsi26 were conducted in recent years. It was found that the phase transformation on pressure release is influenced by the unloading rate; at slow rates, a mixture of bc8 and r8 phases was detected, while for fast unloading rates, mostly amorphous silicon (a-Si) was detected in the residual contact impressions.Reference Domnich and Gogotsi15,Reference Jang, Lance, Wen, Tsui and Pharr19 The presence and distribution of residual phases in indentations can be linked to the crystallographic anisotropy and inhomogeneity of the stress distribution.Reference Zarudi, Zhang, Zou and Vodenitcharova21,Reference Gerbig, Stranick and Cook23 However, in conventional IIT experiments, the phase of the material is probed only after the completion of the indentation test (ex situ), which leaves room for speculation on the exact path of transformation, as the presence of intermediate phases cannot be directly observed.
Until recently, the only possibilities for in situ observations of indentation-induced phase transformation were based on measurements of the electrical resistance of the contact between a probe tip and the indented Si surface.Reference Gupta and Ruoff2,Reference Clarke, Kroll, Kirchner, Cook and Hockey6,Reference Gridneva, Milman and Trefilov8,Reference Pharr, Oliver, Cook, Kirchner, Kroll, Dinger and Clarke9,Reference Mylvaganam, Zhang, Eyben, Mody and Vandervorst16,Reference Eyben, Clemente, Vanstreels, Purtois, Clarysse, Sankaran, Mody, Vandervorst, Mylvaganam and Zhang27–Reference Mann, Van Heerden, Pethica, Bowes and Weihs29 The conductivity of Si phases can range from semiconductor- to metal-like,Reference Clarke, Kroll, Kirchner, Cook and Hockey6,Reference Malone, Sau and Cohen30 and hence variations in the contact resistance can be an indirect indicator for the transformation processes occurring within the contact region. In situ electrical measurements have determined that the semiconductor-like dc phase transforms during loading into material of more metallic (conducting) character,Reference Gupta and Ruoff2,Reference Clarke, Kroll, Kirchner, Cook and Hockey6,Reference Gridneva, Milman and Trefilov8,Reference Pharr, Oliver, Cook, Kirchner, Kroll, Dinger and Clarke9,Reference Bradby, Williams and Swain28 which is believed to be β-tin based on the transformation sequences observed in diamond anvil cell (DAC) tests.Reference Bradby, Williams and Swain28 During unloading, a sudden change in the contact resistance indicated further transformations in crystallographic structure, which is assumed to be connected to the formation of an r8-bc8 mixture or a-Si, dependent on the direction of change in the resistance.Reference Ruffell, Bradby, Williams and Munroe31 However, as multiple phases (sometimes with similar electrical properties) can coexist in the transformation region depending on the unloading conditions,Reference Domnich and Gogotsi15,Reference Jang, Lance, Wen, Tsui and Pharr19 the unambiguous identification of phases is very difficult with in situ electrical probing. To directly analyze indentation-induced Si phase transformations, a probe technique able to identify the crystallographic structure of various phases in situ, such as Raman spectroscopy, must be used.
Raman spectroscopy is a relevant characterization method, enabling determination of the kinetics and physics involved in the mechanical deformation of materials at the crystallographic and molecular level (e.g., strain build-up in crystal lattices, phase transformations, and changes in crystallinity). The utility of IIT and Raman spectroscopy has led researchers at NIST to explore the combination of these methods for in situ measurements, Raman spectroscopy-enhanced IIT, and to develop an indentation device that is coupled with a Raman microscope to conduct in situ spectroscopic and optical analyses of mechanically strained regions of transparent samples while conducting an IIT experiment.Reference Gerbig, Michaels, Forster, Hettenhouser, Byrd, Morris and Cook32 The initial configuration of Raman spectroscopy-enhanced IIT enabled us to collect in situ Raman spectra at one individual spatial location, a configuration referred to as in situ Raman microprobing, while conducting an indentation experiment.Reference Gerbig, Michaels, Forster, Hettenhouser, Byrd, Morris and Cook32 In situ Raman microprobing was recently used to study the indentation-induced phase transformation of Si thin films,Reference Gerbig, Michaels, Forster and Cook33 which marked, to our knowledge, the first direct observation of phase transformation processes for indented Si. In those in situ experiments, the formation of β-tin and another structure, then identified as the bct5 (5-fold coordinated body centered-tetragonal) phase, was observed, providing experimental evidence for the possibility of generating these phases under indentation conditions. During unloading, further transformation into the metastable bc8 and r8 structures was observed, indicating that bc8 can form simultaneously with the r8 structure in indentation tests rather than subsequently from r8 in a separate process as previously assumed.Reference Gerbig, Michaels, Forster and Cook33
However, in situ Raman microprobing only allows the collection of Raman spectra from a very small fraction of the entire contact area between indenter probe and sample, thus providing only very localized information. Therefore, the initial configuration of the Raman spectroscopy-enhanced IIT was recently refined to enable the collection of Raman spectra over an entire image, in situ Raman mapping (Raman imaging). This collection of spectra can then be analyzed to yield spatial maps of material quantities that can be extracted from the Raman spectra including crystalline phase and alignment, composition, or strain. The developed technique gives the opportunity for in situ Raman spectroscopic studies on the evolution of phase distributions and strain fields under contact loading and can thus provide critical experimental data necessary for the evaluation and refinement of existing theoretical models in this field.
In this study, Raman spectroscopy-enhanced IIT in the in situ Raman mapping configuration is used to study the generation and evolution of the phase transformation of Si while performing an IIT experiment analyzed to determine the average contact pressure and indentation strain. This is, to our knowledge, the first sequence of Raman images of a material undergoing phase transformation induced by mechanical deformation while held under a series of contact loads.
II. EXPERIMENTAL DETAILS
A. Experimental setup
The in situ Raman mapping experiments were performed using an IIT device developed at NISTReference Gerbig, Michaels, Forster, Hettenhouser, Byrd, Morris and Cook32 that is coupled with a custom laser scanning Raman microscope to conduct in situ spectroscopic analyses of mechanically deformed regions of optically transparent materials under contact loading.
The force transducer of the IIT device allows adjustment of experimental parameters, such as indentation loads and (un)loading rates. An incorporated displacement sensor allows for collection of force–displacement data comparable to conventional IIT instruments. The IIT device, along with a specimen holder featuring an aperture in the center, is mounted on the X–Y translation stage of an inverted optical microscope that is configured for Raman microscopy, allowing optical access to the mechanically deformed regions of transparent samples.
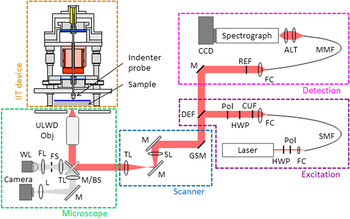
An earlier version of the Raman microscope, in which only the acquisition of point spectra (in situ Raman microprobing) was possible, has been described in some detail in an earlier study.Reference Gerbig, Michaels, Forster, Hettenhouser, Byrd, Morris and Cook32 A schematic diagram of the current optical layout is shown in Fig. 1. While many components of the current microscopy system are unchanged from the earlier version (inverted microscope platform, laser, spectrograph, and detector), addition of a scanning capability required a number of changes in the laser excitation and collection beam paths external to the microscope body; these new features are described herein.
Schematic diagram of the optical layout for the laser scanning Raman microscope component of the Raman spectroscopy-enhanced IIT device: ALT = achromatic lens telescope, BS = beamsplitter, CCD = charge coupled device, CUF = clean-up filter, DEF = dichroic edge filter, FC = fiber coupler, FL = field lens, FS = field stop, GSM = galvanometer scan mirrors (two axis), HWP = half-wave plate, L = lens, M = mirror, MMF = multimode fiber, Pol = polarizer, REF = Raman edge filter, SL = scan lens, SMF = single mode fiber, TL = tube lens, ULWD Obj = ultra-long working distance objective, WL = white light.

In the excitation beam path, a laser line filter (Semrock)34 was used instead of a transmission grating-slit assembly for the purpose of blocking light outside the desired laser bandwidth (e.g., Raman scattering from the transport fiber). A half-wave plate and polarizer were also added to allow for control of the linear polarization orientation of the excitation beam. A dichroic long pass Raman edge filter (Semrock)34 was used to inject the excitation beam into the common optical path. This filter passes the Stokes shifted Raman light into the collection beam path where a Raman edge filter was used to supplement the Rayleigh rejection of the dichroic edge filter.
The laser scanning was accomplished using two (X and Y) galvanometer scan mirrors placed at the entry to a so-called 4f imaging system (SL and TL in Fig. 1) wherein the scan mirrors were in a plane conjugate to that of the microscope objective pupil. As the scan mirrors and 4f imaging system were in the beam path common to the excitation and scattered light, the galvanometers acted to de-scan the scattered light as well. The galvanometer rotation angle to lateral scan range calibration was performed for each axis using a Ronchi grating sample of known pitch (Edmund),34 where the reflected laser light intensity was measured with a photodiode. Note that the use of laser scanning is a somewhat unusual arrangement for Raman microscopy as, given the relatively long Raman spectral acquisition times, sample scanning is the typical strategy. However, in this case, scanning the sample with the nanoindentation probe in contact would invariably compromise the quality of the force and displacement measurements.
B. Test specimen
The in situ mapping experiments were performed on a Si on sapphire (SoS) specimen (manufacturer: Valley Design Corp., Vera Cruz, CA),34 which is composed of a Si(100) film epitaxially grown on a sapphire (r-plane) substrate with both sides polished. The thicknesses of the film and substrate were 600 nm ± 60 nm and 530 µm ± 50 µm (uncertainties represent manufacturer specifications), respectively. The  $\left\langle {001} \right\rangle$ direction of the Si film was rotated away from the substrate normal by 5° ± 1° (angular uncertainties represent intrinsic measurement errors and mounting errors). The sample (20 mm × 20 mm) was cut from a SOS wafer with a slight misalignment of 3.5° ± 1° with respect to the directions
 $\left\langle {110} \right\rangle$ and
 $\left\langle {1\bar 10} \right\rangle$ of the film, as shown by electron backscattering diffraction measurements.
C. Indentation experiment
A series of Raman images from the contact region between the indenter probe and SoS sample were collected for increasing and decreasing contact loads in stepped indentation experiments. In these experiments, the indenter probe was brought into contact with the sample and a load of 42 mN applied and held constant for the time required to collect the Raman image of the region of interest (ROI). The applied indentation force was then increased (loading rate 6 mN/s) to 80 mN (without unloading) and a second Raman image of the same ROI was acquired. The indentation loads were increased twice more (to 119 and 159 mN, loading rate 6 mN/s) and another Raman image was recorded at each step. Afterward, the contact load was decreased stepwise (to 119, 80, and 45 mN, unloading rate 6 mN/s) until the indenter probe was no longer in contact with the sample. A Raman image was recorded at each of the unloading steps. The indenter probe used in the experiments was a conospherical tip made of diamond with a nominal tip curvature radius of 45 µm. The effective tip radius of curvature as a function of indentation depth was determined prior to the mapping experiments based on a published procedure.Reference Bushby, Jennet, Baker, Cook, Corcoran and Moody35
D. In situ mapping
To collect an in situ Raman image, a ROI of 20 µm × 20 µm was scanned. Twenty individual spectra were collected at evenly spaced locations along the 20 µm scan range in each direction, generating a 20 × 20 hyperspectral dataset. A custom LabView code was used to synchronize the laser scanner positions with the spectral acquisition. The collection time for an individual Raman spectrum was set to 15 s. (Although these images took several hours to acquire, tests of displacement and force stability have been performed which indicate that the system is sufficiently robust to perform such measurements.) The Raman measurements were all recorded with an 80x ultra-long working distance metallurgical objective (Olympus)34 with a numerical aperture of 0.75. Focusing through a sapphire substrate is clearly not the ideal use of a metallurgical objective and thus the lateral resolution is undoubtedly degraded below the diffraction limited value (∼520 nm) that might be achieved with this objective. A qualitative assessment of the recorded Raman images suggests lateral resolution in the range of 1 µm. The degraded depth resolution is of little consequence as the Si layer thickness is well below the depth of field of this objective even in the absence of the sapphire. The nominal illumination power of the 785 nm light source was set to 5 mW at the sample surface.
III. ANALYSIS
A. Determination of the contact pressure and indentation strain
To facilitate the analysis of the experimental data, the indentation force (specific to the experimental setup) was converted to the more “generalized” parameter of mean contact pressure. The mean contact pressure p i at the indentation force F i was calculated using the following equation:
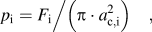 $${p_{\rm{i}}} = {{{F_{\rm{i}}}} \mathord{\left/ {\vphantom {{{F_{\rm{i}}}} {\left( {\pi \cdot a_{{\rm{c}},{\rm{i}}}^2} \right)}}} \right. \kern-\nulldelimiterspace} {\left( {\pi \cdot a_{{\rm{c}},{\rm{i}}}^2} \right)}}\quad {\rm{,}}$$
where a c,i is the radius of the circle of contact at the force F i. The indentation force F i was directly measured during the indentation experiment, which left the parameter a c,i to be determined. Models for the contact mechanics of an elastic-plastically deformed sphere-on-plane system established equations for calculating the contact radius during the loading and the unloading segments in an indentation experiment.
For the loading segment, the contact radius a c,i was calculated using the following equation (e.g., Ref. Reference Ge, Minor, Stach and Morris14):
 $${a_{{\rm{c}},{\rm{i}}}} = {\left[ {R_{\rm{i}}^2 - {{\left( {{R_{\rm{i}}} - {h_{{\rm{c}},{\rm{i}}}}} \right)}^2}} \right]^{0.5}}\quad {\rm{,}}$$
where R i is the effective radius of indenter tip curvature and h c,i is the contact depth (penetration depth below the circle of contact) at the indentation force F i. As mentioned earlier, the effective radius of the indenter tip curvature was determined prior to the mapping experiments. The contact depth h c,i was calculated with
 $${h_{{\rm{c}},{\rm{i}}}} = {h_{\rm{i}}} - {\delta _{\rm{i}}}/2\quad {\rm{,}}$$
where h i is the total displacement and δi is the elastic deformation at the indentation force F i. The total displacement h i was directly measured during the indentation experiment. The elastic deformation δi can be obtained for purely elastic unloading conditions from the following relationship:
 $${\delta _{\rm{i}}} = {h_{\rm{i}}} - {h_{{\rm{r}},{\rm{i}}}}\quad {\rm{,}}$$
where h i is the total displacement at the indentation force F i and h r,i is the residual indentation depth of the contact impression after unloading from indentation force F i. The assumption of purely elastic unloading appears to hold true at least up to the first stage (up to UL1) of the unloading segment in this indentation study. However, secondary phase transformation processes (transition from β-tin to r8, bc8 and/or a-Si) occurred further on into the unloading segment (between UL1 and UL2), as can be seen later in the study. The secondary phase transformation introduced an additional component of plastic deformation rendering the assumption of purely elastic unloading no longer valid. As a consequence, Eq. (4) requires the following modification:
 $${\delta _{\rm{i}}} = {h_{\rm{i}}} - {h_{{\rm{r}},{\rm{i}}}} - {h_{{\rm{pt}},{\rm{i}}}}\quad {\rm{,}}$$
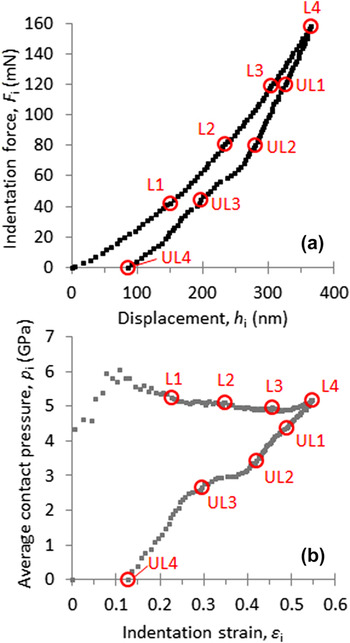
where h pt,i accounts for plastic deformation due to secondary phase transformation processes during unloading. In the literature,Reference Weppelmann, Field and Swain10,Reference Domnich and Gogotsi15,Reference Zarudi, Zhang, Zou and Vodenitcharova21,Reference Ruffell, Bradby, Williams and Munroe31 discontinuities in the unloading segment of Si samples, such as seen in the force–displacement curve in Fig. 2(a), were linked to the sudden growth of substantial volume of phases formed in secondary transformation processes. The size of this discontinuity might be used to estimate the extent of plastic deformation induced by secondary phase transformation during the unloading segment. Unloading from the maximum indentation force of 158 mN generated a discontinuity of the size of 20 nm [see Fig. 2(a)]. Compared to the maximum elastic deformation of 250 nm [as determined from Eq. (4)] at that indentation force, the contribution of the plastic deformation due to phase transformation appears to be rather small. Therefore, it was decided to calculate the elastic deformation according to Eq. (4) accepting that not accounting for the component h pt,i may lead to a slight overestimation of δi and consequently of a c,i. Values for the residual deformation h r,i required in Eq. (4) were determined for several indentation forces F i (including, but not only for, the forces at which Raman spectra were collected) in separate indentation tests. From the resulting h r,i versus F i data set, values for the residual deformation were determined by interpolations for the indentation forces not separately tested.
(a) Indentation force and displacement into the sample surface measured during the loading and unloading segments of the indentation experiment. (b) Average contact pressure and indentation strain calculated from the force–displacement data as described in Sec. III. A. The indentation forces, at which the indentation experiment was put on hold for Raman mapping, and the corresponding values for pressure and strain, are indicated with the markers L1 to L4 (loading segment) and UL1 to UL4 (unloading segment). The specific numerical values for the mechanical parameters at the various (un)loading stages are summarized in Table II. Data obtained for the hold periods of the indentation experiment, in which the Raman mapping was conducted, are not included in the figure.

For the unloading segments, the contact radius a c,i was determined as (e.g., Ref. Reference Field and Swain36)
 $${a_{{\rm{c}},{\rm{i}}}} = {a_{\max }}{\left( {{\delta _{\rm{i}}}/{\delta _{\max }}} \right)^{0.5}}\quad {\rm{,}}$$
where a max is the contact radius at maximum force of the indentation test, and δmax is the elastic deformation at maximum force of the test. The values for a max and δmax were calculated with the parameters determined at maximum indentation force using Eqs. (2) or (4), respectively.
The indentation strain εi along the loading direction was estimated using the following equation:
 $${\varepsilon _{\rm{i}}} = {{\left( {t - {t_{\rm{i}}}} \right)} \mathord{\left/ {\vphantom {{\left( {t - {t_{\rm{i}}}} \right)} t}} \right. \kern-\nulldelimiterspace} t}\quad {\rm{,}}$$
where t is the initial film thickness and t i is the actual (deformed) film thickness at the indentation force F i. The actual film thickness t i was determined from
 $${t_{\rm{i}}} = t - {h_{\rm{i}}}\quad {\rm{.}}$$
By using Eq. (7), it is assumed that the displacement measured during the indentation experiment was mainly (entirely) compensated with the elastic–plastic deformation of the film and, hence, elastic deformation of the substrate (if any) is negligible.
B. Analysis of Raman spectra
The individual Raman spectra were fitted using multiple-peak models with the Pearson VII functional form for observed peaks and an iterative optimization routine available in the Peak Analyzer function of the commercial software OriginPro 934; the position of the center wave number, height, and full width at half maximum (FWHM) of the various peaks were determined. The Raman spectra were fit over the range 200 to 600 cm−1, as the most relevant Si modes were found in this range. Also, the spectral range below 200 cm−1 is affected by the performance characteristics of the long pass Raman edge filter.
From the resulting hyperspectral datacube, 2-dimensional color fill contour images (Raman maps) were plotted, which showed the spatial variation of specific features (e.g., wave number of peak center) of individual Raman peaks. For better illustration, the original scan size of 20 µm × 20 µm was cropped to an image size of 13.5 µm × 13.5 µm.
IV. RESULTS
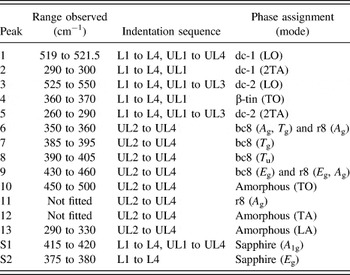
The remainder of this study is organized in the following fashion. The Results section will describe the indentation response of the sample for the full indentation cycle (Sec. IV. A) and spectral features and their respective spatial distributions that arise during the loading (Sec. IV. B) and unloading (Sec. IV. C) segments of the indentation cycle. The assignment of the observed Raman bands to the various Si phases formed during indentation will be described in detail in the Discussion section. The numbering scheme used to identify the band peaks, along with the observed Raman shifts, phase assignments, and the steps in the load–unload sequence where they are observed, are summarized in Table I.
Numbering scheme used to identify the Raman peaks, along with the observed Raman shifts, phase assignments, and the steps in the load–unload sequence in which they were observed within the contact area. The peaks related to the sapphire substrate are labeled with “S” for substrate.

A. Indentation response (full cycle)
Figure 2(a) shows the data recorded for the indentation force and displacement of the indenter probe into the SoS sample during the loading and unloading segments of the indentation experiment. The indentation forces, at which the indentation experiment was put on hold for Raman mapping, are indicated as loading stages L1 to L4 (loading segment) and unloading stages UL1 to UL4 (unloading segment). For clarity, data obtained for the hold periods of the indentation experiment, in which the Raman mapping was conducted, are not included in the figure.
The increase in the indentation force led to a continuous increase of displacement into the sample [Fig. 2(a)]. This is different from indentation studies conducted by other groups with spherical tips on Si samples, where plateaulike discontinuity (“pop-in” event) was found in the loading segment.Reference Weppelmann, Field and Swain10–Reference Juliano, Domnich and Gogotsi12,Reference Gerbig, Stranick, Morris, Vaudin and Cook37 Bradby et al.Reference Bradby, Williams and Swain28 suggested that the pop-in event is a manifestation of a sudden extrusion of highly plastic transformed material from underneath the indenter. As the contact region in this work was significantly larger, due to the larger radius of the indenter (nominal 45 µm) compared to the indenters (3.9–13.5 µm) in the above-mentioned studies, such material extrusion from underneath the indenter might not be feasible under the used experimental conditions. On unloading, a discontinuity (“pop-out” event) in the force–displacement curve was observed between the stages UL2 and UL3. It is believed that these pop-out events are related to the sudden growth of substantial volumes of high-pressure phases (r8 and bc8) during unloading.Reference Weppelmann, Field and Swain10,Reference Domnich and Gogotsi15,Reference Zarudi, Zhang, Zou and Vodenitcharova21,Reference Ruffell, Bradby, Williams and Munroe31
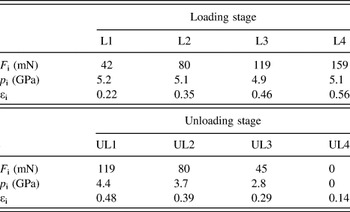
Based on the force displacement data, the average contact pressures and the indentation strains were calculated as described in Sec. III. A and are shown in Fig. 2(b). The values of average contact pressure and indentation strain corresponding to the stages L1 to L4 (loading segment) and UL1 to UL4 (unloading segment) are accordingly marked. Also, the specific numerical values for indentation force, contact pressure, and strain are summarized at the various (un)loading stages in Table II.
Values for average contact pressure p i and indentation strain εi and indentation forces F i, for the various (un)loading stages at which Raman images were collected.

After contact between indenter probe and sample, the contact pressure initially increased to about 6 GPa (at εi ∼0.1) and then decreased slightly to about 5.2 GPa at L1. An increase in the indentation force from L1 to L2 and onwards did not translate to a significant change of the average contact pressure during loading due to the actual geometry of the conospherical indenter tip. However, the indentation strain continuously increased during the entire loading segment. On unloading, contact pressure and strain decreased. A discontinuity related to the “pop-out” event in the force–displacement data [Fig. 2(a)] was observed between the stages UL2 and UL3.
B. In situ Raman mapping (loading segment)
Figure 3(a) shows a gray scale image of the intensity distribution of peak 1 under the first contact load L1 (Table II). The dark colored circular area marks the contact zone between the indenter probe and the SoS sample. Note the appearance of circular rings in this band intensity image emanating from the contact region; these are thought to be due to interference between the incident light and light scattered from the spherical indenter tip. They are not present in intensity images of residual indents where the tip is retracted away from the surface [see Fig. 4(c), UL4]. Figure 3(b) shows Raman spectra taken outside the contact region [location A, Fig. 3(a)] and inside the contact region [location B, Fig. 3(a)] at different stages in the indentation experiment. The spectrum taken outside the contact zone is shown as the lower black curve and is a representative of the pristine SoS sample. The adjacent red curve is the Raman spectrum taken at load L1 inside the contact region. The other (gray colored) Raman spectra were taken consecutively at the same location inside the contact region and showed the progression of the changes in the spectrum of the Si thin film in this particular location during further loading (L1–L4) followed by unloading (UL1–UL4). Figure 3(c) is an enlarged view of the Raman spectra taken of the pristine sample (black curve) and sample exposed to load L1 (red curve). Relevant peaks are labeled with numbers.
(a) Gray scale image (20 × 20 μm) showing the distribution of the intensity of peak 1 of the SoS sample held under contact pressure of 4.6 GPa (L1). The dark colored circular area marks the contact region between indenter tip and SoS sample. (b) Raman spectra taken at the indicated points show the difference in the Raman modes observed outside the contact region (black curve) and inside the contact region (red curve, L1). Also, Raman spectra taken consecutively at the same point inside the contact region during further loading (L2 to L4) and unloading (UL1 to UL4) show the progression of the phase transformation processes. The numbers mark the peaks associated with various Si phases. The spectra are offset along the intensity axis for better illustration. (c) Enlarged view of the Raman spectra taken of the pristine sample (black curve) and inside the contact region at L1 (red curve) for a spectral range of 200 to 450 cm−1.

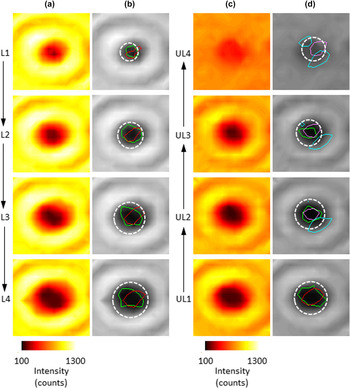
(a) Raman maps imaging the spatial variation of the intensity of peak 1 at different loading stages L1, L2, L3, and L4. (b) The intensity maps of (a) are shown as gray scale contour plots. (c) Raman maps imaging the spatial variation of the intensity of peak 1 at different unloading stages UL1, UL2, UL3, and UL4. (d) The intensity maps of (c) are shown as gray scale contour plots. Within the gray scale plots (b) and (d), colored contour lines of regions where high intensities of peaks 3 (green), 4 (red), 6 (magenta), and 10 (cyan) were detected are shown. The dashed white circular outline indicates the contact area as calculated by Eqs. (2) and (5). The image size is 13.5 µm × 13.5 µm.

The Raman spectra of the pristine SoS sample features four peaks [Fig. 3(b)]: Peak 1 at 520 cm−1 is the first-order longitudinal optical mode (LO) of the dc phaseReference Weinstein and Piermarini38; peak 2, observed at about 300 cm−1, is related to the second-order transverse acoustic (2TA) modes of the dc phaseReference Weinstein and Piermarini38,Reference Windl, Pavone, Karch, Schütt, Strauch, Giannozzi and Baroni39 ; peaks S1 and S2 (labeled “S” for substrate) located at 418 and 378 cm−1 can be assigned to the A 1g and E g modes of the sapphire substrate, respectively.Reference Kadleíková, Breza and Veselý40 In the center of the contact region (location B), significant changes in the Raman spectrum of the SoS sample were observed: Peak 3 appeared in the spectrum at 535 cm−1 and formed a shoulder on the right-hand side of peak 1. Peak 4 emerged at around 370 cm−1 forming a shoulder on the low frequency side of peak S2. Another peak 5 was observed at the low frequency side of peak 2 [Fig. 3(c)]. In the loading sequence, the center peak positions of both peaks 3 and 4 shifted continuously to higher wave numbers and the intensity (amplitude) of those peaks increased, whereas the intensity of peak 1 decreased with further loading. The amplitude of peak 5 also increased, but its center position shifted to lower wave numbers and its shape seemed to broaden. The data shown in Fig. 3(b) are representative of those that can be obtained with the in situ Raman microprobe configuration reported previously.Reference Gerbig, Michaels, Forster and Cook33 However, the new laser scanning capability reported here can be exploited to yield further insights on the spatial extent and evolution of the deformation processes through plotting 2D maps of relevant Raman data. As the intensity of the second-order phonon of the dc phase (peak 2) is significantly weaker than the first-order mode (peak 1), the analysis of the Raman data for the dc phase was focused on peak 1.
Figures 4(a) and 4(b) show two 13.5 µm × 13.5 µm images of the contact area for each loading stage in which the peak 1 height is plotted. The left image of the pair (a) is plotted with a color scale that facilitates observation of the changes in the signal intensity in the center of the contact area. The right image of the pair (b) is a gray scale image where the circumference (white dashed line) of the calculated contact area [Eq. (2)] was added to the image. Additionally, contour lines are plotted to indicate the regions where other peaks appear during the loading segment, including peak 3 (green) and 4 (red). Peak 5 was detected in the same region as peak 3. For the remainder of the manuscript, the contour lines mark the boundaries of the region where the intensity count for a specific peak was at least 100. A comparison of the intensity maps [Fig. 4(b)] reveals that the region of small peak intensity of peak 1 correlated rather well with zones where peaks 3(5) and 4 were detected during loading. With increasing indentation strain (the average contact pressure changes only marginally, Table II and Fig. 2), the region of reduced intensity of peak 1 and the areas of high intensities for peaks 3(5) and 4 grew larger. However, peak 1 was detected over the entirety of the scanned area, never reaching zero intensity.
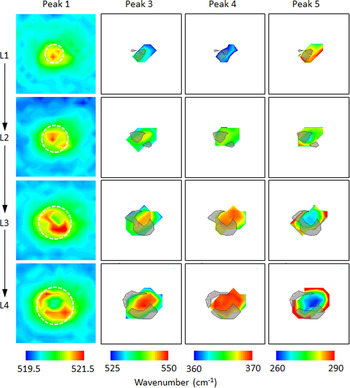
Figure 5 shows 13.5 µm × 13.5 µm images of the center wave number for peaks 1, 3, 4, and 5 for the loading sequence L1 through L4. As in Fig. 4, the circumference (white dashed line) of the calculated contact area is shown in the peak 1 images. Areas of high compressive strain for peak 1 (high center wave number shift) are shown as gray areas in the images for peak 3, 4, and 5 at the corresponding load. As observed in the map collected at L1 (Fig. 5), peak 1 was shifted locally to higher wave numbers. The calculated contact area (white line) was similar in size to the region exhibiting Raman shifts greater than 1 cm−1 in the map, which was assumed to indicate deformation of the dc Si structure, as variation in the Raman shift within the pristine Si material was measured to be as high as 0.5 cm−1. This variation might be related to the inhomogeneity of intrinsic strain across the SoS specimen. At contact load L1, the greatest Raman shifts for peak 1 were observed in the middle of the contact area. However, with further loading (L3, L4), the greatest Raman shifts for peak 1 were found in a ring-shaped zone closer to the rim of the contact area, whereas the center of the contact exhibited negligible Raman shifts. The outline of this ring-shaped zone was superimposed onto the wave number maps of peaks 3 to 5. As can be seen, the ring-shaped zone enclosed (partially) the region of the largest Raman shifts recorded for the newly formed peaks. With increased strain, Raman shifts toward greater wave numbers were observed for peaks 3 and 4, whereas shifts toward smaller wave numbers were recorded for peak 5.
Raman maps imaging the spatial variation of the center position of particular Raman peaks at different loading stages L1, L2, L3, and L4. The white circular outline indicates the contact area as calculated by Eq. (2). The outline of the high-compressive strain regions of peak 1 are highlighted as gray colored zones in the maps for peaks 3, 4, and 5. The white colored areas in the maps for peaks 3, 4, and 5 indicate the absence of that particular Raman band in the collected spectrum. The image size is 13.5 µm × 13.5 µm.

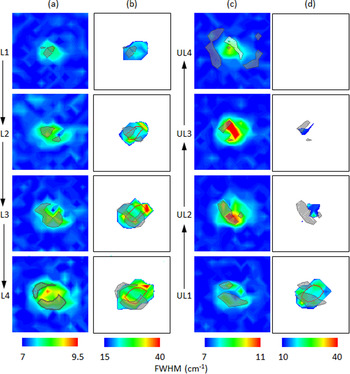
Figures 6(a) and 6(b) show two 13.5 µm × 13.5 µm images of the contact area for each loading stage where the FWHM peak widths are plotted for peaks 1 [Fig. 6(a)] and 3 [Fig. 6(b)]. Red contour lines show regions where peak 4 was observed while the high strain regions of peak 1 are indicated by gray (compressive) areas. Besides the shifting of the center peak position, a broadening of peak 1 by up to 2 cm−1 and significantly greater broadening of peak 3 was observed inside the contact region during loading.
Raman maps imaging the spatial variation in the line width (FWHM) of the peak 1 during (a) loading and (c) unloading and for peak 3 during (b) loading and (d) unloading. The outlines of the high-compressive and high-tensile strain regions of peak 1 are highlighted as gray and white colored zones in the maps for both peaks, respectively. Within the plots for peak 3, red colored contour lines of regions, where high intensities of peak 4 were detected, are shown.

C. In situ Raman mapping (unloading segment)
Figures 4(b) and 4(c) show two 13.5 µm × 13.5 µm images of the contact area for each unloading stage in which the peak 1 height is plotted. The left image of the pair (c) is plotted with a color scale that facilitates observation of the changes in the signal intensity in the center of the contact area. The right image of the pair (d) is a gray scale image where the circumference (white dashed line) of the calculated contact area [Eq. (2)] was added to the image. Additionally, contour lines are plotted to indicate the regions where other peaks were detected during the unloading segment, including peak 3 (green), 4 (red), 6 (magenta), and 10 (cyan).
Figures 6(c) and 6(d) show two 13.5 µm × 13.5 µm images of the contact area for each unloading stage where the FWHM peak widths are plotted for peaks 1 [Fig. 6(c)] and 3 [Fig. 6(d)]. Red contour lines show regions where peak 4 was observed while the high strain regions of peak 1 are indicated by white (tensile) and gray (compressive) areas.
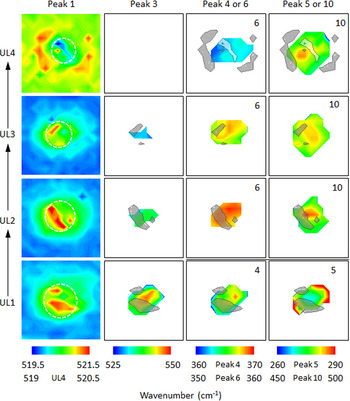
Figure 7 is the unloading sequence analogue to Fig. 5, showing 13.5 µm × 13.5 µm images of the center wave number for peaks 1, 3, 4 (UL1) or 6 (UL2 to UL4), and 5 (UL1) or 10 (UL2 to UL4) for the unloading sequence UL1 through UL4. As in earlier figures, the circumference (white dashed line) of the calculated contact area is shown in the peak 1 images. Areas of high compressive strain for peak 1 (high center wave number shift) are shown as gray areas in the images for peak 3, 4 or 6, and 5 or 10 at the corresponding load.
Raman maps imaging the spatial variation of the wave number of particular Raman peaks at different unloading stages UL1, UL2, UL3, and UL4. The white circular outline indicates the contact area as calculated by Eq. (5). The outline of the high-compressive strain regions (gray colored) and tensile strain regions (white colored) of peak 1 are highlighted in the maps of the other peaks. The white colored areas in the maps indicate the absence of that particular Raman band in the collected spectrum. The image size is 13.5 µm × 13.5 µm.

Initial unloading (unloading from L4 to UL1) did not result in major modifications of the spectral make-up for point B, besides changes in the Raman shifts for the various peaks [Fig. 3(b)]. However, on further unloading (UL1 to UL2), the Raman spectrum was significantly altered by the occurrence of the new Raman peaks 6 to 13. For the remainder of the manuscript, the analysis of the Raman data will be focused on peaks 6 and 10 from the peaks found during unloading. The formation of the new phases seemed to occur at the expense of structures associated with peaks 3 and 4 [Figs. 4(d) and 7]. Peak 4 was no longer detectable at UL2 and peak 3 occupied a smaller portion of the contact area at UL2 compared to UL1. This peak eventually completely vanished from the spectrum at UL3. Simultaneously, the regions occupied by structures associated with peaks 6 and 10 expanded with further unloading. Superimposing the intensity maps for the various peaks showed clearly that peak 6 was detected in the location previously occupied by the structure associated with peak 4 [red and magenta contours in Fig. 4(d)]. Furthermore, it can be seen that the largest intensities for peak 10 were found in two distinct locations adjacent to the detection region of peak 6 [cyan and magenta contours in Fig. 4(d)].
As previously mentioned, unloading resulted in changes of the Raman shifts for the various peaks (Fig. 7). Peaks 3 and 4 shifted back to smaller values and peak 5 returned to greater wave numbers. The center positions of peaks 6 and 10 shifted also to smaller wave numbers during unloading. For peak 1, unloading resulted mainly in a size reduction of the region where high wave number shifts were detected for this Raman mode. For the unloading stages UL2 and UL3, a significant broadening of peak 1 width was also observed locally [Fig. 6(c)]. After complete unloading, a shift toward wave numbers less than the values measured for the nondeformed material was observed for peak 1 inside the contact area, whereas shifts toward greater wave numbers were detected outside the contact area (Fig. 7, UL4).
V. DISCUSSION
A. Raman mapping (loading segment)
At the first contact load L1, the shifts of the LO mode (Fig. 5, peak 1) toward greater wave numbers indicated that the dc structure was exposed to compressive strainReference Anastassakis, Pinczuk and Burstein41 inside the contact area due to the mechanical load applied to the sample during indentation. However, the changes in the center frequencies of the LO mode were relatively small (∼2.5 cm−1) compared to the shifts (∼25 cm−1) found in other studies at comparable contact pressures in DAC tests.Reference Mernagh and Liu42,Reference Khachadorian, Papagelis, Scheel, Coli, Ferrari and Thomsen43 A broadening of the LO mode was also observed [Fig. 6(a)]. The increase of the FWHM of the LO mode was similar to values reported by other groups for bulk SiReference Debernardi, Baroni and Molinari44 and Si nanowiresReference Khachadorian, Papagelis, Scheel, Coli, Ferrari and Thomsen43 hydrostatically compressed at pressures comparable to those here. Also at the first contact load, three additional peaks [Fig. 3(b), peaks 3–5] were observed. In a previous study,Reference Gerbig, Michaels, Forster and Cook33 the pressure-dependent shift of a Raman mode identical to peak 4 in shape and location in the Raman spectrum was found to align reasonably well with experimental data and simulations from the literature for the transverse optical (TO) mode of β-tin. Therefore, the Raman mode in the previous study was associated with the β-tin phase and, hence, peak 4 was associated with the same crystallographic phase in this work. The LO mode for β-tin located at around 120 cm−1 (Refs. Reference Olijnyk45,Reference Gaál-Nagy, Schmitt, Pavone and Strauch46) was outside the detection range of the experimental setup.
Simulation studies suggestedReference Kim and Oh47,Reference Dubois, Rignanese, Pardoen and Charlier48 that the dc structure transforms to the β-tin structure by compressing the dc face-centered-cubic sublattices and shifting them relative to each other in opposite directions along the slip planes. In this tetragonal transformation, the angles of the unit cell remain unchanged, while the lengths of the unit-cell axes are contracted along the coincident dc [001] and β-tin [001] axes and extended along the coincident dc <110> and β-tin <100> axes, without breaking the bonds between atoms.Reference Kim and Oh47 The transformation leads to nearly ideal sixfold Si coordination with the two formed bonds in the [001] directions slightly longer than those from the original fourfold coordination.Reference Kim and Oh47
The presence of the β-tin phase (peak 4) indicates the presence of phase transformation processes in the contact area at the first contact load (p i: 5.2 GPa, εi: 0.22). The contact pressure at L1 is much less than the values (10–16 GPa) for the primary phase transformation of single crystal Si reported in quasi-hydrostatic DAC tests.Reference Gupta and Ruoff2–Reference Hu, Merkle, Menoni and Spain4 This confirms previous suggestions that a combination of isotropic compressive and shear strains (as in the case of indentation) induces phase transformation at much smaller stresses than those required for compression alone (as in DAC test) in semiconductors.Reference Gupta and Ruoff2,Reference Gilman49,Reference Durandurdu50 The observation is also in good agreement with a recently published model for the stress-induced phase transformation of microcrystalline Si films, which predicts a primary phase transformation event at a contact stress of 6.4 GPa and strain of about 0.2.Reference Han and Lin51
In indentation simulations, the formation of bct5 was observed.Reference Kim and Oh47,Reference Lin, Jian, Lai and Yang52–Reference Smith, Tadmor, Bernstein and Kaxiras54 Two Raman-active modes with E g and A 1g symmetries were predicted for the bct5 phase with wave numbers of 520 and 340 cm−1.Reference Boyer, Kaxiras, Feldman, Broughton and Mehl55 The calculated E g frequency for the bct5 phase is in the lower end of the wave number range of peak 3. The predicted center peak position of the A 1g mode for bct5 is located between peaks 4 and 5. However, with no information currently available (to our knowledge) about the relative intensity of the A 1g to the E g mode for bct5 or about the uncertainty in the prediction of peak positions for the bct5 modes, the likelihood of observing the A 1g mode cannot be assessed. Although peak 3 could be associated with the bct5 phase, as previously suggested,Reference Gerbig, Michaels, Forster and Cook33 it seems more likely that this peak is associated with another Si phase. The phase transformation did not extend through the entire film thickness of the Si thin film, as Raman modes of the dc phase were detected (with varying intensity) over the entire scan range. As the indentation-induced strain field is of extended size, the nontransformed dc lattice will exhibit locally variable states of deformation depending on its relative position in the strain field. As the collection depth of the experimental setup comprised the entire thickness of the sample (Si film and substrate), different deformation states of the residual dc lattice might have been probed simultaneously. It is proposed that peaks 3 and 5 also represented the first-order (LO) and second-order modes (2TA) of the dc lattice but at different strain levels than peaks 1 and 2.
The center positions of peaks 3 and 5 exhibited larger wave number shifts than those of peaks 1 and 2. The “softening” of TA modes is associated with instability of the structure to short-wave length shear distortions.Reference Weinstein and Piermarini38 Although the Raman shifts of the peak 3-LO and peak 5-2TA modes were comparable to values reported in other studies under comparable hydrostatic pressures,Reference Weinstein and Piermarini38,Reference Mernagh and Liu42,Reference Khachadorian, Papagelis, Scheel, Coli, Ferrari and Thomsen43 the increases of the width of these modes (Peak 3 – Fig. 6(b); Peak 5 – up to 40 cm−1, not shown) were much greaterReference Weinstein and Piermarini38,Reference Khachadorian, Papagelis, Scheel, Coli, Ferrari and Thomsen43,Reference Qin, Teo, Shen, Peng and Zhou56 presumably due to several lattice distortions as a result of the additional shear strains in indentation testing. In the remainder of the manuscript, the dc lattices identified with peaks 1 and 2 or peaks 3 and 5 were named dc-1 (low strain) and dc-2 (high strain), respectively.
With greater indentation strains (Table II), the zones of large Raman shifts (high strain) for both of the dc lattices, dc-1 and dc-2, grew larger and an increasing portion of the dc structure in the contact area was transformed to the high pressure phase (β-tin, peak 4), providing experimental evidence for previous predictions regarding the shear strain being the critical factor in initiating phase transformation rather than the compressive stress.Reference Gilman49,Reference Cheong and Zhang57 Furthermore, the dc-2 LO mode featured a significant broadening along the expansion fronts of the β-tin region [Fig. 6(b)].
However, with greater contact loads, portions of dc-1 lattice seemed to relax (less compressively stressed), as the relative Raman shift of this phase decreased in the center of the contact zone (Fig. 5, Peak 1, L4). At the same time, the relative Raman shifts for dc-2 and the β-tin modes increased, as the further indentation-induced strains appeared to be compensated by the deformation of the expanding, newly formed phase and the dc-2 lattice rather than by the dc-1 lattice in the contact zone. As a result, the region of the greatest Raman shifts of peaks 3 to 5 enlarged in the center of the contact zone.
B. Raman mapping (unloading segment)
As peaks 3 and 4 exhibited phonon hardening under pressure and peak 5 exhibited phonon softening under pressure (Fig. 5), the Raman shifts observed after the first partial unloading indicated a relaxation of the structure associated with these peaks (Fig. 7). Unloading to UL2 initiated another phase transition, due to the mechanical instability of the β-tin phase, as can be seen in the appearance of peaks 6 and 10 in Fig. 7. The spatial distribution of high strains in the dc1-lattice appeared to be modified by the strain fields in the newly formed phases.
As the unloading rate and unloading strain rate were relatively slow, the formation of the r8 and bc8 phases was expected based on the findings of previous studies.Reference Domnich and Gogotsi15,Reference Jang, Lance, Wen, Tsui and Pharr19,Reference Gerbig, Michaels, Forster and Cook33 Indeed, the formed phases were identified to be bc8 and r8 based on calculations for phonon modes published by Piltz et al.Reference Piltz, Maclean, Clark, Ackland, Hatton and Crain58 It is believed that the transformation from the β-tin phase to the r8 structure requires breaking bonds along the β-tin [111] direction and bonding across to the nearest unbonded neighbors, which lie in the same direction.Reference Crain, Ackland, Mclean, Piltz, Hatton and Pawley5 The r8 structure is a rhombohedral distortion of the bc8 phase, where only one bonding pair has to be rearranged in the unit cell during phase transformation.Reference Crain, Ackland, Mclean, Piltz, Hatton and Pawley5,Reference Piltz, Maclean, Clark, Ackland, Hatton and Crain58
The calculated frequencies of relevant Raman-active modes for the r8 phase are 440 cm−1 (E g), 439 cm−1 (A g), 350 cm−1 (A g), 175 cm−1 (A g) and for the bc8 phase are 447 cm−1 (E g), 404 cm−1 (T u), 387 cm−1 (T g), 354 cm−1 (A g), and 353 cm−1 (T g).Reference Piltz, Maclean, Clark, Ackland, Hatton and Crain58 Accordingly, peaks 7 and 8 indicated the presence of the bc8 phase; peak 11 could be associated with the r8 phase. Peaks 6 and 9 could be associated with either bc8 or r8, as both of the phases exhibited phonons with similar frequencies in this region of the Raman spectrum. Raman images of peak 8 (bc8 phase) were compared with images for peak 6 (bc8/r8 phases) regarding peak distribution and Raman shifts. No significant differences were found.
Peak 12 was identified as the transverse acoustic phonon (TA, located at around 180 cm−1) of a-Si.Reference Winer59 This peak is very sensitive to the degree of crystallinityReference Khajehpour, Daoud, Williams and Bourgeois60 and is usually observed in disordered material only.Reference Lavrentiev, Vacik, Vorlicek and Vosecek61 The occurrence of peak 12 marked the local amorphization of material within the contact zone. Along with the TA mode, the Raman spectrum of a-Si is characterized by three additional broad bands with center wave numbers as indicated: TO (480 cm−1), LO (380 cm−1), and longitudinal acoustic mode (LA, 280 cm−1).Reference Winer59 TO and LA modes of a-Si were seen in this study (peaks 10 and 13), whereas the LO band could not be detected. Due to its low-intensity, the LO band was not observed due to the higher amplitude phonons of the r8 and bc8 phases located in the same wave number range of the spectrum. Overall, the r8 and bc8 phases appeared to be predominant among the newly formed phases inside the contact area due to the greater intensities of the associated Raman peaks compared to those of the Raman bands of the amorphous phase [Fig. 3(b)]. Further analysis of the phases newly formed in the unloading segment focused on peaks 6 (r8 and bc8) and 10 (a-Si).
The frequency of the peaks 6 and 10 shifted to lower values at UL3 (Fig. 7) indicating a relaxation of the associated phases as both of these modes exhibit positive pressure coefficients.Reference Olijnyk and Jephcoat62,Reference Ishidate, Inoue, Tsuji and Minomura63 At the same time, more material in the contact zone was transformed to r8 and bc8 structures and the amorphous phase. The additional unloading also caused further relaxation of the dc-2 lattice, whereas the size of the region in which this phase was detected was greatly diminished (Fig. 7, Peak 3). Along with a decrease in the Raman shifts for peak 1, broadening of the LO mode of the dc-1 lattice was observed [Fig. 6(c)].
After complete unloading, portions of the phase transformed material remained compressed inside the initial contact area due to the residual plastic deformation. The dc-1 lattice was locally exposed to tensile strain mostly likely as reaction to the remaining compressive strain of the phase transformed structures. The residual strain field external to the contact area presumably arose in reaction to the strain generated by phase transformation events inside the contact area.
Judging by the intensity distributions of peaks 6 and 10 [Fig. 4(d)], the r8 and bc8 phases were mainly located in the center of the contact area, whereas the amorphous phase formed predominantly along the rim of the contact zone where high unloading indentation strain rates may promote the formation of distorted (amorphous) structures rather than ordered (crystalline) phases.Reference Gerbig, Stranick and Cook23 Amorphous material was also detected in the center of the contact area, although in less concentration (modes with lesser intensity) and under much higher strain. Overall, the amorphous material covered a larger portion of the contact area than the r8 and bc8 phases and appeared to wrap around the r8 and bc8 region. The amorphous material might have been formed as transition zone between the dc structure and r8 and bc8 phases as these phases have significantly different crystal structures.Reference Gerbig, Stranick and Cook23
VI. CONCLUSIONS
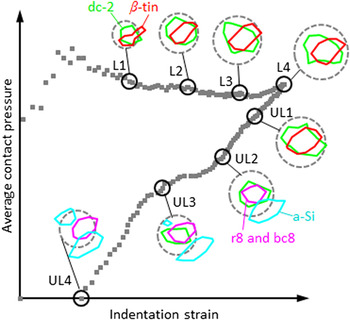
Indentation-induced phase transformation processes were studied by in situ Raman imaging of the deformed contact region of Si, using Raman spectroscopy-enhanced IIT. The evolution of the spatial distribution of the dc lattice and of phases generated in transformation processes along with the strain field was qualitatively analyzed. Figure 8 summarizes these findings by showing the phase distribution inside the contact area for the various (un)loading stages of the indentation experiment. The indentation response is represented by the more “generalized” parameters of indentation strain and average contact pressure rather than force–displacement data.
Summary of the evolution of the phase distribution inside the contact area (dashed line) for the various stages during the indentation experiment represented as a strain–contact pressure curve.

Based on this study, the following picture regarding indentation-induced phase transformation of a thin Si film emerged: During the indentation of an epitaxial Si thin film, the induced strains and pressures initiated the transformation of the dc structure to the β-tin phase in the center of the contact area. The crystallographic structure of the β-tin phase is much denser (22%) than the initial dc phase causing the exposure of the dc lattice (dc-2) adjacent to the transformed material to high strains. These strains resulted in the splitting of the LO mode, reflected in large wave number shifts and significant broadening of the LO mode of the dc phase, especially along the expansion front of the β-tin region. With increasing shear strains, the β-tin region expanded together with the region of strained dc-lattice surrounding it. It is believed that the advancing transformation front induced strains strong enough to alter regions of the dc lattice further away from the transformation zone (dc-1) which was reflected in the relatively small wave number shifts and moderate peak broadenings observed for the LO mode of dc-1. As the transformation front moved outwards, it formed a ring shaped high-strain region in the dc-1 lattice as observed for L3 and L4. During the initial unloading, the indenter-induced strains and pressure were reduced causing a (partial) relaxation of the strained β-tin phase. Further unloading destabilized the β-tin phase, prompting the transformation into the r8 and bc8 phases. During unloading, the alterations of the dc-2 LO mode (shifting, broadening) were reversed indicating that the alterations might be related to elastic deformation of the dc lattice. As the elastic deformation, which appeared to have compensated for the mismatch in the lattice parameters between the dc structure and the β-tin phase, was reduced, the mismatch between the newly formed r8 and bc8 phases and the surrounding dc structure seemed to be accomplished by the formation of a transition zone of distorted (amorphous material), as previously suggested.
The reported in situ experiments provide insights into the transformation processes in Si during indentation, confirming, and providing the experimental evidence for, some of the previous assumptions made on this subject. In this context, the developed experimental setup coupling indentation with in situ Raman microscopy has shown its potential in advancing the understanding of deformation mechanisms and will provide a very useful tool in validating and refining contact models and related simulation studies.