1. Introduction
Stochastic comparisons of order statistics (OS), record values, and their spacings have been studied extensively by many authors during the last 20 years. However, some of them remained incomplete. In this article, we focus on one of the most important tasks the likelihood ratio ordering of spacings. It is known that the spacings of ordered random variables appear in many branches of statistical theory with applications to many fields such as reliability or life testing. As a general framework for models of ordered random variables, Kamps [Reference Kamps23,Reference Kamps24] introduced the concept of generalized order statistics (GOS). So, it is natural and interesting to study comparisons of ordered random variables and their spacings into the model of GOS with flexible choices for its parameters.
Let  $X$ be a nonnegative random variable with cumulative distribution function (cdf)
 $F(x)$, survival (or reliability) function
 $\bar {F}(x)=1-F(x)$, and probability density function (pdf)
 $f(x)$. Let
 $h(x)=f(x)/\bar F(x)$ and
 $\kappa (x)=f(x)/F(x)$ be the hazard rate and reversed hazard rate functions of
 $X$, respectively. The random variables
 $X_{(r,n,\tilde {m}_n,k)}$,
 $r=1,\ldots,n$, are called GOS of
 $X$ if their joint density function is given by
 $$\mathbf{f}({x_1},\ldots,{x_n})=k\left(\prod_{j=1}^{n-1}{\gamma_{(j,n,\tilde{m}_n,k)}}\right) \left(\prod_{i=1}^{n-1}[\bar F{(x_i)}]^{m_i}f(x_i)\right){[\bar F{(x_n)}]^{k-1}f(x_n)},$$
for all  $F^{-1}(0)< x_1\leq x_2 \leq \cdots \leq x_n < F^{-1}(1-)$, where
 $n \in \mathbb {N}$,
 $k>0$, and
 $m_1,\ldots,m_{n-1}\in \mathbb {R}$ are such that
 ${\gamma _{(r,n,\tilde {m}_n,k)}}=k+n-r+\sum _{j=r}^{n-1}{m_j}>0 \text { for all } r\in \{1,\ldots,n-1\}$, and
 $\tilde {m}_n=(m_1,\ldots,m_{n-1})$, if
 $n\geq 2$ (
 $\tilde {m}_n\in \mathbb {R}$ is arbitrary, if
 $n=1$).
This general model contains several useful models. For example, if  $m_1=\cdots =m_{n-1}=0$ and
 $k=1$, or
 $m_1=\cdots =m_{n-1}=-1$ and
 $k \in \mathbb {N}$, then the GOS would convert into OS and
 $k$-record values, respectively. Sequential order statistics (which describes the lifetime of a sequential
 $(n-r+1)$-out-of-
 $n$ systems) under a proportional hazard rate model are also included in GOS. Indeed, the specific choice of distribution functions
 \begin{equation} F_i(x) = 1-(1-F (x))^{\alpha_i},\quad i=1,\ldots ,n, \end{equation}
with a cdf  $F$ and positive real numbers
 $\alpha _1,\ldots,\alpha _n$ lead to the model of GOS with parameters
 $k=\alpha _n$ and
 $m_i=(n-i+1)\alpha _i-(n-i)\alpha _{i+1}-1$ (and hence
 $\gamma _i=(n-i+1)\alpha _i$). In the literature, (1) is usually referred to the proportional hazard rate assumption (see [Reference Esna-Ashari and Asadi17,Reference Navarro, Esna-Ashari, Asadi and Sarabia31] for new extensions of the proportional hazard rate model). We refer the reader to Table 1 of Kamps [Reference Kamps23] for complete information on various submodels.
We denote the generalized spacings of GOS by  $D_{(r,s,n,\tilde {m}_n,k)}=X_{(s,n,\tilde {m}_n,k)}-X_{(r-1,n,\tilde {m}_n,k)}$ for
 $1\leq r\leq s\leq n$, with
 $X_{(0,n,\tilde {m}_n,k)}\equiv 0$. For
 $s=r$, they are simple spacings and for
 $s=r+p-1$,
 $p$-spacings (denoted by
 $D^{(p)}_{(r,n,\tilde {m}_n,k)}$).
We say that  $X$ (with pdf
 $f$) is smaller than
 $Y$ (with pdf
 $g$) in likelihood ratio order (denoted by
 $X\leq _{\textrm {lr}} Y$) if
 $g(x)/f(x)$ is increasing in
 $x$ in the union of their supports (cf. Shaked and Shanthikumar [Reference Shaked and Shanthikumar33]). Throughout the paper, the word increasing (decreasing) is used for nondecreasing (nonincreasing) and all expectations are implicitly assumed to exist whenever they are written. Also,
 $X$ (or
 $F$) is said to be increasing likelihood ratio (ILR) if its pdf exists and is logconcave. If it is logconvex, then it is called decreasing likelihood ratio (DLR).
Now, consider the following problems:
(P1)
 $X \in {\rm DLR} \Rightarrow D^{(p)}_{(r,n,\tilde {m}_n,k)} \leq _{\textrm {lr}} D^{(p)}_{(r+1,n,\tilde {m}_n,k)}$;
(P2)
$X \in {\rm DLR} \Rightarrow D^{(p)}_{(r,n+1,\tilde {m}_n,k)} \leq _{\textrm {lr}} D^{(p)}_{(r,n,\tilde {m}_n,k)}$;(P3)
$X \in {\rm DLR} \Rightarrow D^{(p)}_{(r,n,\tilde {m}_n,k)} \leq _{\textrm {lr}} D^{(p)}_{(r+1,n+1,\tilde {m}_n,k)}$;(P4)
$X \in {\rm DLR} \Rightarrow D^{(p)}_{(r,n,\tilde {m}_n,k)} \leq _{\textrm {lr}} D^{(p)}_{(r',n',\tilde {m}_n,k)}$, $r\leq r'$, $n'-r'\leq n-r$;(P5)
$X \in {\rm ILR} \Rightarrow D^{(p)}_{(r,n,\tilde {m}_n,k)} \geq _{\textrm {lr}} D^{(p)}_{(r+1,n+1,\tilde {m}_n,k)}$;(P6)
$X \in {\rm ILR} \Rightarrow D^{(p)}_{(r,n,\tilde {m}_n,k)} \leq _{\textrm {lr}} D^{(p+1)}_{(r-1,n,\tilde {m}_n,k)}$;(P7)
$X \in {\rm ILR} \Rightarrow D^{(p)}_{(r,n,\tilde {m}_n,k)} \leq _{\textrm {lr}} D^{(p')}_{(r',n,\tilde {m}_n,k)}$, $p+1\leq p'$, $r'\leq r-1$, $p+r=p'+r'$;(P8)
$X \in {\rm DLR} \Rightarrow D^{(p)}_{(r,n,\tilde {m}_n,k)} \geq _{\textrm {lr}} D^{(p+1)}_{(r,n+1,\tilde {m}_n,k)}$.


For OS, Misra and van der Meulen [Reference Misra and van der Meulen28] obtained ( $P_1$) and (
 $P_2$) and Hu and Zhuang [Reference Hu and Zhuang22] proved (
 $P_3$)–(
 $P_6$). For GOS, Hu and Zhuang [Reference Hu and Zhuang21] obtained (
 $P_1$)–(
 $P_6$) under the condition
 $m_1=m_2=\cdots =m_{n-1}$ in which the marginal and joint pdf of GOS have a closed form representation. Finally, in an interesting article, Xie and Hu [Reference Xie and Hu37] proved (
 $P_1$)–(
 $P_4$) without the condition
 $m_1=m_2=\cdots =m_{n-1}$ using some conditionally results about GOS. We also note that the likelihood ratio ordering of spacings of GOS in the conditional case was studied in Xie and Hu [Reference Xie and Hu36].
In this article, we obtain new finding for these problems. It is planned as follows. In Section 2, we give some preliminary results and useful lemmas that can be also on interest in the study of other topics. In Section 3, we obtain our main results for very flexible cases of GOS with different parameters  $\tilde {m}_n$ and
 $\tilde {m}'_{n'}$. This enables us to compare the
 $p$-spacings of submodels of GOS among themselves. More generally, we can compare the
 $p$-spacings obtained from different submodels (we refer the reader to Franco et al. [Reference Franco, Ruiz and Ruiz20], Belzunce et al. [Reference Belzunce, Mercader and Ruiz9], Esna-Ashari et al. [Reference Esna-Ashari, Alimohammadi and Cramer18] and Alimohammadi et al. [Reference Alimohammadi, Esna-Ashari and Cramer4], for some stochastic orderings of GOS with different parameters
 $\tilde {m}_n$ and
 $\tilde {m}'_{n'}$). Specifically, we extend (
 $P_1$)–(
 $P_4$) in the unifying Theorem 3.1 for different parameters
 $m_i$ and
 $m'_i$. However, we note that (
 $P_5$) and (
 $P_6$) remained as open problems for unequal
 $m_i$ and
 $m'_i$. We also extend (
 $P_5$) in Theorem 3.3 for different
 $m_i$ and
 $m'_i$ but just for simple spacings, that is, for
 $p=1$. Also, we extend it in Theorem 3.4 for arbitrary
 $p$-spacings and for
 $m'_i=m_i$, but unequal
 $m_i$. Property (
 $P_7$) (which is more general than (
 $P_6$)) is extended as well for different parameters
 $m_i$ and
 $m'_i$ in Theorem 3.5. At the end of this section, we discuss the new problem (
 $P_8$) in Theorem 3.7. In Section 4, we first derive some preliminary results about the relationships among the logconvexity properties of
 $f(x)$,
 $h(x)$, and
 $\kappa (x)$. These findings may be of independent interest. Then, the preservation properties of the logconvexity among spacings are discussed.
It is known that the multivariate likelihood ratio order is preserved under marginalization (cf. [Reference Shaked and Shanthikumar33]). But, our main results can not be deduced from the existing multivariate results. For example, Fang et al. [Reference Fang, Hu, Wu and Zhuang19] gave the results for simple spacings while we obtain the results for general spacings and also for very flexible case via different parameters  $m_i$ and
 $m'_i$. Sharafi et al. [Reference Sharafi, Khaledi and Hami34] considered the two-sample problem with some restrictions on
 $m_i$ while we considered the one-sample problem.
2. Preliminary results and useful lemmas
There exist several representations for the marginal density functions of GOS (see, e.g., [Reference Cramer and Kamps15,Reference Kamps23]). Cramer et al. [Reference Cramer, Kamps and Rychlik16] obtained the expression
 \begin{equation} f_{X_{(r,n,\tilde{m}_n,k)}}(x)=c_{r-1}{[\bar F{(x)}]^{\gamma_{(r,n,\tilde{m}_n,k)}-1}}g_{r}(F(x))f(x), \end{equation}
where  $c_{r-1}=\prod _{i=1}^{r}\gamma _{(i,n,\tilde {m}_n,k)}$,
 $r=1,\ldots,n$,
 $\gamma _{(n,n,\tilde {m}_n,k)}=k$, and
 $g_{r}$ is a particular Meijer's
 $G$-function. For the joint pdf of
 $X_{(r,n,\tilde {m}_n,k)}$ and
 $X_{(s,n,\tilde {m}_n,k)}$,
 $1\leq r< s \leq n$, Tavangar and Asadi [Reference Tavangar and Asadi35] established the expression
 \begin{align} f_{X_{(r,n,\tilde{m}_n,k)},X_{(s,n,\tilde{m}_n,k)}}(x,y)& =c_{s-1}[\bar F{(x)}]^{\gamma_{(r,n,\tilde{m}_n,k)}-\gamma_{(s,n,\tilde{m}_n,k)}-1}g_{r}(F(x))\nonumber\\ & \quad \times [\bar F{(y)}]^{\gamma_{(s,n,\tilde{m}_n,k)}-1}\psi_{s-r-1}\left(\frac{\bar F{(y)}}{\bar F{(x)}}\right)f(x)f(y), \end{align}
for  $x< y$ (zero elsewhere), where
 $\psi _{0}(t)= 1$,
 $\psi _{1}(t)=\delta _{m_{r+1}}(1-t)$,
 $$\psi_{l}(t)=\int_t^{1}\int_{u_{l-1}}^{1}\ldots\int_{u_2}^{1} \delta_{m_{r+1}}(1-u_{1})\prod_{i=1}^{l-1}{u_i}^{m_{r+i+1}}du_1\ldots d{u_{l-2}}\,d{u_{l-1}},\quad 0\leq t \leq 1,\ l =2,3,\ldots$$
and
 $$\delta_{m}(t)=\begin{cases} \dfrac{1}{m+1}(1-{(1-t)^{m+1}}), & m\neq{-}1, \\ -{\ln(1-t)}, & m={-}1, \end{cases}$$
for  $t\in (0,1)$.
According to Lemmas 2.1 and 3.1 in Alimohammadi and Alamatsaz [Reference Alimohammadi and Alamatsaz1], we have the following recursive formulas:
 \begin{equation} g_{1}(t)=1,\quad g_{r}(t)=\int_0^{t} g_{r-1}(u)[1-u]^{m_{r-1}}\,du,\quad 0\leq t \leq 1,\ r=2,\ldots,n, \end{equation}
and
 \begin{equation} \psi_{0}(t)= 1,\quad \psi_{l}(t)=\int_t^{1} \psi_{l-1}(u)u^{m_{r+l}}\,du,\quad 0\leq t \leq 1,\ l =1,2,\ldots \end{equation}
For each  $y \in \mathbb {R_+}$, denote
 ${\bar F_y{(x)}}=\bar F{(x+y)}/{\bar F{(y)}}$,
 $x \in \mathbb {R_+}$. Now, substituting
 $r$ with
 $r-1$ in (3) and after some calculations, we obtain
 \begin{align} f_{D_{(r,s,n,\tilde{m}_n,k)}}(x)& =c_{s-1}\int_{0}^{+\infty} {[\bar F{(x+y)}]^{\gamma_{(s,n,\tilde{m}_n,k)}-1}}\psi_{s-r}(\bar F_y{(x)})f(x+y)\nonumber\\ & \quad \times {[\bar F{(y)}]^{\gamma_{(r-1,n,\tilde{m}_n,k)}-\gamma_{(s,n,\tilde{m}_n,k)}-1}}g_{r-1}(F(y))f(y)\,dy,\quad x\geq 0 \end{align}
for  $2\leq r\leq s \leq n$, where, according to (5) for
 $r-1$,
 \begin{equation} \psi_{s-r}(\bar F_y{(x)})=\int_{\bar F_y{(x)}}^{1}\psi_{s-r-1}(u)u^{m_{s-1}}\,du,\quad r+1\leq s \leq n, \end{equation}
with  $\psi _{0}(t)= 1$ and, for
 $r=1$, we have
 $f_{D_{(1,s,n,\tilde {m}_n,k)}}(x)=f_{X_{(s,n,\tilde {m}_n,k)}}(x)$.
Many researchers have paid attention to various aspects of GOS. The majority of such results have been obtained under restrictions on the parameters of the model of GOS as the condition  $m_1=\cdots =m_{n-1}$. Notice that the pdf of GOS has a closed form representation in this case. We will try to avoid this assumption.
Let us review now the definition of logconvexity/logconcavity and a useful result about inheritance of them from a function to its right and left side integrals.
Definition 2.1 (Barlow and Proschan [Reference Barlow and Proschan7])
A function  $\lambda : \mathbb {R} \longmapsto \mathbb {R}_+$ is said to be logconvex (logconcave) if
 $\lambda (\alpha {x}+(1-\alpha ){y})\leq (\geq ) [\lambda ({x})]^{\alpha } [\lambda ({y})]^{1-\alpha }$, for all
 ${x},{y} \in \mathbb {R}$ and
 $\alpha \in (0,1)$.
Theorem 2.2 (Alimohammadi et al. [Reference Alimohammadi, Alamatsaz and Cramer3])
Let  $\lambda$ be an integrable function,
 $\omega$ be a differentiable increasing function, and
 $\omega '$ be logconvex on
 $(a,b)$. If
 $\lambda \circ \omega$ is logconvex on
 $(a,b)$, then
 $\int _{\omega (x)}^{b} \lambda (u)\,du$ is logconvex and
 $\int _a^{\omega (x)} \lambda (u)\,du$ is logconcave provided that
 $-\infty < a$,
 $b=\infty$, and
 $\omega (\infty )=\infty$.
An important special case of this theorem is that, if a pdf  $f(x)$ with support
 $(a,\infty )$ is logconvex, then
 $\bar F(x)$ is logconvex and
 $F(x)$ is logconcave. In particular, this property holds for lifetime random variables with support
 $(0,\infty )$. Another important function satisfying the conditions of Theorem 2.2 is
 $\omega (x)=e^{x}$. Alimohammadi et al. [Reference Alimohammadi, Alamatsaz and Cramer3] also proved that if logconvex is replaced by logconcave in Theorem 2.2, then
 $\int _a^{\omega (x)} \lambda (u)\,du$ and
 $\int _{\omega (x)}^{b} \lambda (u)\,du$ are logconcave provided that
 $\omega ^{-1}(a)$ and
 $\omega ^{-1}(b)$ are defined, respectively.
We also recall the following definition about the very useful concept of total positivity.
Definition 2.3 (Karlin [Reference Karlin26])
Let  $\mathcal {X}$ and
 $\mathcal {Y}$ be subsets of the real line
 $\mathbb {R}$. A function
 $\lambda : \mathcal {X}\times \mathcal {Y} \rightarrow \mathbb {R}$ is said to be totally positive of order 2
 $(TP_2)$ (resp. reverse regular of order 2
 $(RR_2)$) if
 $$\lambda(x_1,y_1)\lambda(x_2,y_2)-\lambda(x_1,y_2)\lambda(x_2,y_1)\geq ({\leq}) 0,$$
for all  $x_1\leq x_2$ in
 $\mathcal {X}$ and all
 $y_1\leq y_2$ in
 $\mathcal {Y}$.
Note that the  $TP_2$
 $(RR_2)$ property is equivalent to
 $\lambda (x_2,y)/\lambda (x_1,y)$ is increasing (decreasing) in
 $y$ when
 $x_1 \leq x_2$, whenever this ratio exists. Also note that the product of two
 $TP_2$ (
 $RR_2$) functions is
 $TP_2$ (
 $RR_2$). Moreover, if
 $\lambda (x,y)$ is
 $TP_2$ (
 $RR_2$) in
 $(x,y)$, then
 $\lambda _1(x)\lambda (x,y)\lambda _2(y)$ is
 $TP_2$ (
 $RR_2$) in
 $(x,y)$ when
 $\lambda _1$ and
 $\lambda _2$ are two nonnegative functions (cf. Karlin [Reference Karlin26]).
The part (i.a) of the following theorem was established by Karlin [Reference Karlin26] and the others by Esna-Ashari et al. [Reference Esna-Ashari, Alimohammadi and Cramer18]. It was called the extended basic composition theorem.
Theorem 2.4 (Extended basic composition theorem)
Let  $\lambda _1: \mathcal {X}\times \mathcal {Y}\times \mathcal {Z} \rightarrow \mathbb {R_+}$,
 $\lambda _2: \mathcal {X}\times \mathcal {Y}\times \mathcal {Z} \rightarrow \mathbb {R_+}$, and
 $\lambda : \mathcal {X}\times \mathcal {Y} \rightarrow \mathbb {R_+}$ be Borel-measurable functions satisfying
 $$\lambda(x,y)=\int_{\mathcal{Z}}\lambda_1(x,y,z)\lambda_2(x,y,z)\,d\mu(z),$$
where  $\mu$ denotes a sigma-finite measure defined on
 $\mathcal {Z}$.
(i.a) If
$\lambda _1$ and $\lambda _2$ are $TP_2$ in each pairs of variables, then $\lambda$ is $TP_2$ in $(x,y)$;(i.b) If
$\lambda _1$ and $\lambda _2$ are $RR_2$ in $(y,z)$ and $(x,z)$, and $\lambda _1$ and $\lambda _2$ are $TP_2$ in $(x,y)$, then $\lambda$ is $TP_2$ in $(x,y)$;(ii.a) If
$\lambda _1$ and $\lambda _2$ are $RR_2$ in $(y,z)$ and $(x,y)$, and $\lambda _1$ and $\lambda _2$ are $TP_2$ in $(x,z)$, then $\lambda$ is $RR_2$ in $(x,y)$;(ii.b) If
$\lambda _1$ and $\lambda _2$ are $RR_2$ in $(x,y)$ and $(x,z)$, and $\lambda _1$ and $\lambda _2$ are $TP_2$ in $(y,z)$, then $\lambda$ is $RR_2$ in $(x,y)$.


The lemma below, due to Misra and van der Meulen [Reference Misra and van der Meulen28], is often used in establishing the monotonicity of a fraction in which the numerator and denominator are integrals or summations.
Lemma 2.5 (Misra and van der Meulen [Reference Misra and van der Meulen28])
Let  $\Theta$ be a subset of the real line
 $\mathbb {R}$ and let
 $U$ be a nonnegative random variable having a cdf belonging to the family
 $\mathcal {P}=\{G(\cdot \,|\,\theta ),\theta \in \Theta \}$ which satisfies that, for
 $\theta _1, \theta _2 \in \Theta$,
 $$G({\cdot}\,|\,\theta_1) \leq_{st}(\geq_{st}) G({\cdot}\,|\,\theta_2),\quad \text{whenever}\ \theta_1 \leq \theta_2.$$
Let  $\phi (u,\theta )$ be a real-valued function defined on
 $\mathbb {R}\times \Theta$, which is measurable in u for each
 $\theta$ such that
 $E[\phi (U,\theta )]$ exists. Then,
(i)
$E[\phi (U,\theta )]$ is increasing in $\theta$, if $\phi (u,\theta )$ is increasing in $\theta$ and increasing (decreasing) in u;(ii)
$E[\phi (U,\theta )]$ is decreasing in $\theta$, if $\phi (u,\theta )$ is decreasing in $\theta$ and decreasing (increasing) in u.


The following lemmas play a crucial role for obtaining our main results. They are also useful on their own. The proofs of these lemmas are given in the Appendix.
In whole of the paper, we consider the following two assumptions:
Assumption A (A′).  $m_i\geq 0$ for all
 $i$, and
 $f$ is logconvex (logconcave).
Assumption B (B′).  $-1\leq m_i < 0$ for all
 $i$,
 $f$, and
 $h$ are logconvex (logconcave).
Lemma 2.6. Let  $s\geq r+1$.
(i) The function
$\psi _{s-r}(\bar F_y{(x)})$ is $TP_2$ $(RR_2)$ in $(x,y)$ provided that at least one of the two assumptions A or B (A$'$ or B$'$) is satisfied;(ii) The function
$\psi _{s-r}(\bar F_y{(x)})\cdot [{\bar F{(y)}}]^{{m_{s-1}}}$ is $TP_2$ $(RR_2)$ in $(y,s)$ provided that $m_i$ is decreasing (increasing) in $i$ and that at least one of the two assumptions A or B is satisfied;(iii) The function
$\psi _{s-r}(\bar F_y{(x)})$ is $TP_2$ $(RR_2)$ in $(x,s)$ provided that $m_i$ is decreasing (increasing) in $i$.


Remark 2.7. Cramer [Reference Cramer13] proved that  $(X_{(1,n,\tilde {m}_n,k)},\ldots,X_{(n,n,\tilde {m}_n,k)})$ are multidimensional
 $TP_2$ without any condition (for definition and properties of multidimensional
 $TP_2$, we refer the reader to Karlin and Rinott [Reference Karlin and Rinott27]). Using the preservation of this property under marginalization, we have the
 $TP_2$ property of
 $f_{X_{(r,n,\tilde {m}_n,k)},X_{(s,n,\tilde {m}_n,k)}}(x,y)$ in
 $(x,y)$. Thus, according to (3), the function
 $\psi _{s-r-1}(\bar F{(y)/\bar F{(x)}})$ is
 $TP_2$ in
 $(x,y)$ without any condition. Also, Burkschat [Reference Burkschat10] obtained a result about the multidimensional
 $TP_2$ property of
 $(D_{(1,1,n,\tilde {m}_n,k)},\ldots,D_{(n,n,n,\tilde {m}_n,k)})$. So,
 $f_{D_{(r,r,n,\tilde {m}_n,k)},D_{(s,s,n,\tilde {m}_n,k)}}(x,y)$ is
 $TP_2$ in
 $(x,y)$. We note that these properties do not imply part (i) of Lemma 2.6.
Lemma 2.8. Let  $Y$ be a nonnegative random variable having a cdf belonging to the family
 $\mathcal {P}=\{G(\cdot \,|\,x),x \in \mathbb {R_+}\}$ with corresponding pdf
 \begin{align} g(y\,|\,x)& =c(x){[\bar F{(x+y)}]^{\gamma_{(s,n,\tilde{m}_n,k)}-1}}\psi_{s-r}(\bar F_y{(x)})f(x+y)\nonumber\\ & \quad \times {[\bar F{(y)}]^{\gamma_{(r-1,n,\tilde{m}_n,k)}-\gamma_{(s,n,\tilde{m}_n,k)}-1}}g_{r-1}(F(y))f(y), \end{align}
for  $y\geq x$, where
 \begin{align*} c(x)& =\left[\int_{0}^{+\infty} {[\bar F{(x+{z})}]^{\gamma_{(s,n,\tilde{m}_n,k)}-1}}\psi_{s-r}(\bar F_{{z}}{(x)})f(x+{z})\right.\\ & \quad \left.\vphantom{\int_{0}^{+\infty}} \times {[\bar F{({z})}]^{\gamma_{(r-1,n,\tilde{m}_n,k)}-\gamma_{(s,n,\tilde{m}_n,k)}-1}}g_{r-1}(F({z}))f({z})\,dz\right]^{{-}1}, \end{align*}
is the normalizing constant. Then, for  $x_1, x_2 \in \mathbb {R_+}$,
 $$G({\cdot}\,|\,x_1) \leq_{\textrm{lr}}(\geq_{\textrm{lr}}) G({\cdot}\,|\,x_2),\quad \text{whenever}\ x_1 \leq x_2,$$
provided that at least one of the two assumptions A (A $'$) with
 $\gamma _{(s,n,\tilde {m}_n,k)}\geq 1$ or B (B
 $'$) is satisfied.
Lemma 2.9. For  $s\geq 2$, the function
 $\psi _{s-1}(\bar F_y{(x)})/g_{s}( F{(x)})$ is increasing (decreasing) in
 $x$ provided that at least one of the two assumptions A or B (A
 $'$ or B
 $'$) is satisfied.
We also need some results for different parameters  $m_i$ and
 $m'_i$. From now on, we consider
 $\tilde {m}^{\prime }_{n'}=(m'_1,\ldots,m'_{n'-1})$ with
 $\gamma _{(r',n',\tilde {m}^{\prime }_{n'},k')}=k'+n'-r'+\sum _{j=r'}^{n'-1}{m'_j}>0$. First, we recall the following lemma about the function
 $g_r$.
Lemma 2.10. (Esna-Ashari et al. [Reference Esna-Ashari, Alimohammadi and Cramer18])
If  $r\leq r'$ and
 $m'_{r'-i}\leq m_{r-i}$ for
 $1\leq i \leq r-1$, then
 $\check {g}_{r'}(t)/g_{r}(t)$ is increasing in
 $t$, where
 $g_r$ and
 $\check {g}_{r'}$ are defined as in (4) with parameters
 $m_i$ and
 $m'_{i}$, respectively.
Remark 2.11. According to the method of proof used in Lemma 3.2 of [Reference Esna-Ashari, Alimohammadi and Cramer18], we get that
(i) if
$m'_{r-i}\geq m_{r-i}$ for $1\leq i \leq r-1$, then $\check {g}_{r}(t)/g_{r}(t)$ is decreasing in $t$;(ii) if
$r'\leq r$ and $m_{r-i}\geq m_{r'-i}$ for $1\leq i \leq r'-1$, then ${g}_{r'}(t)/g_{r}(t)$ is decreasing in $t$.


Now, we obtain the following result about the function  $\psi$.
Lemma 2.12. Suppose that  ${\psi }$ and
 $\check {\psi }$ are defined as in (7) with parameters
 $m_i$ and
 $m'_{i}$, respectively. Let us assume
 $s'-r'=s-r\geq 1$ and
 $s\leq s'$. Then, the function
 \begin{equation} \Delta_{(r,r',s,s')}(x,y)=\frac{\check{\psi}_{s'-r'}(\bar F_y{(x)})}{\psi_{s-r}(\bar F_y{(x)})}\cdot [\bar F{(y)}]^{{m'_{s'-1}}-{m_{s-1}}} \end{equation}
(i) is increasing (decreasing) in
$y$ provided that $m'_{j}\leq m_{i}$ ($m'_{j}\geq m_{i}$) for all $i\leq j$, and that at least one of the two assumptions A or B is satisfied;(ii) is increasing (decreasing) in
$x$ provided that $m'_{j}\leq m_{i}$ ($m'_{j}\geq m_{i}$) for all $i\leq j$.


3. Likelihood ratio comparisons
In this section, we study the preservation of the likelihood ratio order among spacings of GOS. It is worth mentioning that the direct studying of likelihood ratio ordering of spacings of GOS by means of its marginal pdf is rather complicated (since the pdf has not a closed form). Thus, some authors imposed the restriction  $m_1=\cdots =m_{n-1}$ on the model in which the marginal and joint pdf of GOS have the closed form or study conditionally results about GOS. However, we obtain our main results directly. This enable us to have a more flexible choice of parameters to compare them.
Theorem 3.1. Let  ${X_{(r,n,\tilde {m}_n,k)}}$,
 $r=1,\ldots,n$ and
 ${X_{(r',n',\tilde {m}'_{n'},k')}}$,
 $r'=1,\ldots,n'$, be the GOS based on a common absolutely continuous cdf
 $F$. If
 $r \leq r'$,
 $s\leq s'$ and
 $s'-r'=s-r$, then
 $$D_{(r,s,n,\tilde{m}_n,k)} \leq_{\textrm{lr}} D_{(r',s',n',\tilde{m}'_{n'},k')}$$
provided that  $m'_{j}\leq m_{i}$ for all
 $i\leq j$,
 $\gamma _{(s',n',\tilde {m}'_{n'},k')}\leq \gamma _{(s,n,\tilde {m}_n,k)}$ and at least one of the following three conditions is satisfied: assumption A with
 $\gamma _{(s,n,\tilde {m}_n,k)}\geq 1$ for
 $r\geq 2$, assumption A with
 $\gamma _{(s',n',\tilde {m}'_{n'},k')}\geq 1$ for
 $r=1$, or assumption B.
Proof. We give the proof in two cases.
Case 1:  $r\geq 2$. From (6), we have
 $$\frac{f_{D_{(r',s',n',\tilde{m}'_{n'},k')}}(x)}{f_{D_{(r,s,n,\tilde{m}_n,k)}}(x)}=E[\phi(Y,x)],$$
where
 \begin{align} \phi(y,x)& \propto [\bar F{(x+y)}]^{\gamma_{(s',n',\tilde{m}'_{n'},k')}-\gamma_{(s,n,\tilde{m}_n,k)}}\frac{\check{\psi}_{s'-r'}(\bar F_y{(x)})}{\psi_{s-r}(\bar F_y{(x)})}\frac{\check{g}_{r'-1}(F(y))}{g_{r-1}(F(y))}\nonumber\\ & \quad \times [\bar F{(y)}]^{(\gamma_{(r'-1,n',\tilde{m}'_{n'},k')}-\gamma_{(s',n',\tilde{m}'_{n'},k')})-(\gamma_{(r-1,n,\tilde{m}_n,k)}-\gamma_{(s,n,\tilde{m}_n,k)})},\nonumber\\ & = [\bar F{(x+y)}]^{\gamma_{(s',n',\tilde{m}'_{n'},k')}-\gamma_{(s,n,\tilde{m}_n,k)}}\cdot \Delta_{(r,r',s,s')}(x,y)\cdot \frac{\check{g}_{r'-1}(F(y))}{g_{r-1}(F(y))}\nonumber\\ & \quad \times [\bar F{(y)}]^{(\gamma_{(r'-1,n',\tilde{m}'_{n'},k')}-\gamma_{(s',n',\tilde{m}'_{n'},k')})-(\gamma_{(r-1,n,\tilde{m}_n,k)}-\gamma_{(s,n,\tilde{m}_n,k)})-({{m'_{s'-1}}-{m_{s-1}}})}\nonumber\\ & = [\bar F{(x+y)}]^{\gamma_{(s',n',\tilde{m}'_{n'},k')}-\gamma_{(s,n,\tilde{m}_n,k)}}\cdot \Delta_{(r,r',s,s')}(x,y)\cdot \frac{\check{g}_{r'-1}(F(y))}{g_{r-1}(F(y))}\nonumber\\ & \quad \times [\bar F{(y)}]^{(\sum_{j=r'-1}^{s'-2}m'_j)-(\sum_{j=r-1}^{s-2}m_j)}, \end{align}
 $\Delta _{(r,r',s,s')}(x,y)$ is defined as in (9), and
 $Y$ is a nonnegative random variable having a cdf belonging to the family
 $\mathcal {P}=\{G(\cdot \,|\,x),x \in \mathbb {R_+}\}$ with the pdf defined as in (8). It is seen that the following properties hold in (10):
• The first term is increasing in
$x$ and $y$ since $\gamma _{(s',n',\tilde {m}^{\prime }_{n'},k')}\leq \gamma _{(s,n,\tilde {m}_n,k)}$;• The second term is increasing in
$x$ and $y$ due to the assumptions of the theorem and Lemma 2.12;• The third term is increasing in
$y$ due to Lemma 2.10 since $r \leq r'$ and $m'_{j}\leq m_{i}$ for all $i\leq j$;• The fourth term is increasing in
$y$ since $m'_{j}\leq m_{i}$ for all $i\leq j$.


Furthermore, according to the assumptions of the theorem and Lemma 2.8, we have  $G(\cdot \,|\,x_1) \leq _{st} G(\cdot \,|\,x_2)$ for
 $x_1 \leq x_2$. Now, part (i) of Lemma 2.5 implies that
 $E[\phi (Y,x)]$ is increasing in
 $x$.
Case 2:  $r=1$. From (2) and (6), we have
 \begin{align} \frac{f_{D_{(r',s',n',\tilde{m}'_{n'},k')}}(x)}{f_{D_{(1,s,n,\tilde{m}_n,k)}}(x)}& = \int_{0}^{+\infty} \frac{[\bar F{(x+y)}]{{}^{\gamma_{(s',n',\tilde{m}'_{n'},k')}-1}}}{[\bar F{(x)}]{{}^{\gamma_{(s,n,\tilde{m}_n,k)}-1}}}\frac{\check{\psi}_{s'-r'}(\bar F_y{(x)})}{g_{s}(F(x))}\frac{f(x+y)}{f(x)}\cdot \nu(y)\,dy\nonumber\\ & =\int_{0}^{+\infty} \left[\frac{\bar F{(x+y)}}{\bar F{(x)}}\right]{{}^{\gamma_{(s',n',\tilde{m}'_{n'},k')}-1}}[\bar F{(x)}]{{}^{\gamma_{(s',n',\tilde{m}'_{n'},k')}-\gamma_{(s,n,\tilde{m}_n,k)}}}\nonumber\\ & \quad \times \frac{\check{\psi}_{s'-r'}(\bar F_y{(x)})}{g_{s}(F(x))}\frac{f(x+y)}{f(x)}\cdot \nu(y)\,dy\\ & =\int_{0}^{+\infty} \left[\frac{\bar F{(x+y)}}{\bar F{(x)}}\right]{{}^{\gamma_{(s',n',\tilde{m}'_{n'},k')}}}[\bar F{(x)}]{{}^{\gamma_{(s',n',\tilde{m}'_{n'},k')}-\gamma_{(s,n,\tilde{m}_n,k)}}}\nonumber \end{align}
 \begin{align} & \quad \times \frac{\check{\psi}_{s'-r'}(\bar F_y{(x)})}{g_{s}(F(x))}\frac{h(x+y)}{h(x)}\cdot \nu(y)\,dy, \end{align}
where  $\nu (y)$ does not depend on
 $x$. Now, according to the assumptions of the theorem, to prove that (11) and (12) are increasing in
 $x$, it is sufficient to show that
 ${\check {\psi }_{s'-r'}(\bar F_y{(x)})}/ g_{s}(F(x))$ is increasing in
 $x$. To do this, we write it as
 $$\frac{\check{\psi}_{s'-r'}(\bar F_y{(x)})}{g_{s}(F(x))}=\frac{\check{\psi}_{s'-r'}(\bar F_y{(x)})}{{\psi}_{s-r}(\bar F_y{(x)})}\frac{{\psi}_{s-r}(\bar F_y{(x)})}{g_{s}(F(x))}.$$
Here, the first and second terms are increasing in  $x$ by part (ii) of Lemmas 2.12 and 2.9 with
 $r=1$, respectively. Therefore, the proof is completed.
Remark 3.2. Xie and Hu [Reference Xie and Hu37] proved the statement of Theorem 3.1 (which also contains the previous findings of Hu and Zhuang [Reference Hu and Zhuang21]) in their separate Theorems 3.1, 3.2, and Reference Franco, Ruiz and Ruiz20 and Corollary 3.4 under the following conditions for the parameters:
 \begin{equation} k=k',\ m_i=m'_i,\ m_i\ \text{is decreasing in }\ i,\text{ and } r'-r\geq n'-n. \end{equation}
By choosing  $s=r+p-1$ and
 $s'=r'+p-1$, one can see that (13) implies the conditions in Theorem 3.1.
Theorem 3.3. Let  ${X_{(r,n,\tilde {m}_n,k)}}$,
 $r=1,\ldots,n$, and
 ${X_{(r',n',\tilde {m}'_{n'},k')}}$,
 $r'=1,\ldots,n'$, be the GOS based on a common absolutely continuous cdf
 $F$. If
 $r \leq r'$, then
 $$D_{(r,r,n,\tilde{m}_n,k)} \geq_{\textrm{lr}} D_{(r',r',n',\tilde{m}'_{n'},k')}$$
provided that:
Case 1: For
$r\geq 2$, $m'_{j}\leq m_{i}$ for all $i\leq j$ and $\gamma _{(r',n',\tilde {m}'_{n'},k')}= \gamma _{(r,n,\tilde {m}_n,k)}$ hold and at least one of the following conditions hold: assumption A$'$ with $\gamma _{(r,n,\tilde {m}_n,k)}\geq 1$ or assumption B$'$.Case 2: For
$r=1$, $\gamma _{(r',n',\tilde {m}'_{n'},k')}\geq \gamma _{(1,n,\tilde {m}_n,k)}$ holds and at least one of the following conditions hold: assumption A$'$ with $\gamma _{(r',n',\tilde {m}'_{n'},k')}\geq 1$ or assumption B$'$.


Proof. Case 1:  $r\geq 2$. From (6), we have
 $$\frac{f_{D_{(r',r',n',\tilde{m}'_{n'},k')}}(x)}{f_{D_{(r,r,n,\tilde{m}_n,k)}}(x)}=E[\phi(Y,x)]$$
, where
 \begin{equation} \phi(y,x)\propto [\bar F{(x+y)}]^{\gamma_{(r',n',\tilde{m}'_{n'},k')}-\gamma_{(r,n,\tilde{m}_n,k)}} \frac{\check{g}_{r'-1}(F(y))}{g_{r-1}(F(y))} [\bar F{(y)}]^{m'_{r'-1}-m_{r-1}}, \end{equation}
and  $Y$ is a nonnegative random variable having a cdf belonging to the family
 $\mathcal {P}=\{G(\cdot \,|\,x),x \in \mathbb {R_+}\}$ with the pdf defined as in (8). It is seen that the following properties hold in (14):
• The first term is constant with respect to
$x$ and $y$ since $\gamma _{(r'+p-1,n',\tilde {m}'_{n'},k')}= \gamma _{(r+p-1,n,\tilde {m}_n,k)}$;• The second term is increasing in
$y$ due to Lemma 2.10 since $r \leq r'$, $m'_{j}\leq m_{i}$ for all $i\leq j$;• The third term is increasing in
$y$ since $m'_{j}\leq m_{i}$ for all $i\leq j$.


Furthermore, according to Lemma 2.8, we have  $G(\cdot \,|\,x_1) \geq _{st} G(\cdot \,|\,x_2)$ for
 $x_1 \leq x_2$. Now, part (ii) of Lemma 2.5 implies that
 $E[\phi (Y,x)]$ is decreasing in
 $x$.
Case 2:  $r=1$. From (2) and (6), we have
 \begin{align*} & \frac{f_{D_{(r',r',n',\tilde{m}'_{n'},k')}}(x)}{f_{D_{(1,r,n,\tilde{m}_n,k)}}(x)}\\ & \quad =\int_{0}^{+\infty} \left[\frac{\bar F{(x+y)}}{\bar F{(x)}}\right]{{}^{\gamma_{(r',n',\tilde{m}'_{n'},k')}-1}}[\bar F{(x)}]{{}^{\gamma_{(r',n',\tilde{m}'_{n'},k')}-\gamma_{(1,n,\tilde{m}_n,k)}}}\frac{f(x+y)}{f(x)}\cdot \nu(y)\,dy\\ & \quad =\int_{0}^{+\infty} \left[\frac{\bar F{(x+y)}}{\bar F{(x)}}\right]{{}^{\gamma_{(r',n',\tilde{m}'_{n'},k')}}}[\bar F{(x)}]{{}^{\gamma_{(r',n',\tilde{m}'_{n'},k')}-\gamma_{(1,n,\tilde{m}_n,k)}}}\frac{h(x+y)}{h(x)}\cdot \nu(y)\,dy, \end{align*}
where  $\nu (y)$ does not depend on
 $x$. So, the result follows from the assumptions of the theorem.
Theorem 3.4. Let  ${X_{(r,n,\tilde {m}_n,k)}}$,
 $r=1,\ldots,n$, and
 ${X_{(r',n',\tilde {m}_{n'},k')}}$,
 $r'=1,\ldots,n'$, be the GOS based on a common absolutely continuous cdf
 $F$. If
 $r+1 \leq r'$ and
 $s'-r'=s-r$, then
 $$D_{(r,s,n,\tilde{m}_n,k)} \geq_{\textrm{lr}} D_{(r',s',n',\tilde{m}_{n'},k')}$$
provided that:
Case 1: For
$r\geq 2$, $m_{j}\leq m_{i}$ for all $i\leq j$ and $\gamma _{(s',n',\tilde {m}_{n'},k')}= \gamma _{(s,n,\tilde {m}_n,k)}$ hold and at least one of the following conditions hold: assumption A$'$ with $\gamma _{(s,n,\tilde {m}_n,k)}\geq 1$ or assumption B$'$.Case 2: For
$r=1$, $\gamma _{(s',n',\tilde {m}_{n'},k')}\geq \gamma _{(s,n,\tilde {m}_n,k)}$ holds at least one of the following conditions hold: assumption A$'$ with $\gamma _{(s',n',\tilde {m}_{n'},k')}\geq 1$ or assumption B$'$.


Proof. Case 1:  $r\geq 2$. From (6), we have
 $$\frac{f_{D_{(r',s',n',\tilde{m}_{n'},k')}}(x)}{f_{D_{(r,s,n,\tilde{m}_n,k)}}(x)}={E[\phi(Y,x)]},$$
where
 \begin{align} \phi(y,x)& \propto [\bar F{(x+y)}]^{\gamma_{(s',n',\tilde{m}_{n'},k')}-\gamma_{(s,n,\tilde{m}_n,k)}}\frac{{g}_{r'-1}(F(y))}{g_{r-1}(F(y))}\nonumber\\ & \quad \times [\bar F{(y)}]^{(\gamma_{(r'-1,n',\tilde{m}_{n'},k')}-\gamma_{(s',n',\tilde{m}_{n'},k')})-(\gamma_{(r-1,n,\tilde{m}_n,k)}-\gamma_{(s,n,\tilde{m}_n,k)})},\nonumber\\ & = [\bar F{(x+y)}]^{\gamma_{(s',n',\tilde{m}_{n'},k')}-\gamma_{(s,n,\tilde{m}_n,k)}}\frac{{g}_{r'-1}(F(y))}{g_{r-1}(F(y))} [\bar F{(y)}]^{(\sum_{j=s}^{s'-1}m_j)-(\sum_{j=r-1}^{r'-2}m_j)}, \end{align}
and  $Y$ is a nonnegative random variable having a cdf belonging to the family
 $\mathcal {P}=\{G(\cdot \,|\,x),x \in \mathbb {R_+}\}$ with the pdf defined as in (8). It is seen that the following hold in (15):
• The first term is constant with respect to
$x$ and $y$ because of $\gamma _{(s',n',\tilde {m}_{n'},k')}= \gamma _{(s,n,\tilde {m}_n,k)}$;• The second term is increasing in
$y$ due to Lemma 2.10 because of $r+1 \leq r'$, $m_{j}\leq m_{i}$ for all $i\leq j$;• The third term is increasing in
$y$ because of $m_{j}\leq m_{i}$ for all $i\leq j$.


Furthermore, according to the assumptions of the theorem and Lemma 2.8, we have  $G(\cdot \,|\,x_1) \geq _{st} G(\cdot \,|\,x_2)$ for
 $x_1 \leq x_2$. Now, part (ii) of Lemma 2.5 implies that
 ${E[\phi (Y,x)]}$ is decreasing in
 $x$.
Case 2:  $r=1$. From (2) and (6), we have
 \begin{align*} \frac{f_{D_{(r',s',n',\tilde{m}_{n'},k')}}(x)}{f_{D_{(1,s,n,\tilde{m}_n,k)}}(x)} & =\int_{0}^{+\infty} {\left[\frac{\bar F{(x+y)}}{\bar F{(x)}}\right]}{{}^{\gamma_{(s',n',\tilde{m}_{n'},k')}-1}}[\bar F{(x)}]{{}^{\gamma_{(s',n',\tilde{m}_{n'},k')}-\gamma_{(s,n,\tilde{m}_n,k)}}}\nonumber\\ & \quad \times \frac{{\psi}_{s'-r'}(\bar F_y{(x)})}{g_{s}(F(x))}\frac{f(x+y)}{f(x)}\cdot \nu(y)\,dy\\ & =\int_{0}^{+\infty} {\left[\frac{\bar F{(x+y)}}{\bar F{(x)}}\right]}{{}^{\gamma_{(s',n',\tilde{m}_{n'},k')}}}[\bar F{(x)}]{{}^{\gamma_{(s',n',\tilde{m}_{n'},k')}-\gamma_{(s,n,\tilde{m}_n,k)}}}\nonumber\\ & \quad \times \frac{{\psi}_{s'-r'}(\bar F_y{(x)})}{g_{s}(F(x))}\frac{h(x+y)}{h(x)}\cdot \nu(y)\,dy, \end{align*}
where  $\nu (y)$ does not depend on
 $x$. First, note that
 $$\frac{{\psi}_{s'-r'}(\bar F_y{(x)})}{g_{s}(F(x))}=\frac{{\psi}_{s-1}(\bar F_y{(x)})}{g_{s}(F(x))}$$
is decreasing in  $x$ by Lemma 2.9. Now, according to the assumptions of the theorem,
 ${f_{D_{(r',s',n',\tilde {m}_{n'},k')}}(x)}/{f_{D_{(1,s,n,\tilde {m}_n,k)}}(x)}$ is decreasing in
 $x$. Thus, the proof is completed.
Now, we study the preservation of likelihood ratio ordering among  $p$-spacings for different values of
 $p$ in the next two theorems.
Theorem 3.5. Let  ${X_{(r,n,\tilde {m}_n,k)}}$,
 $r=1,\ldots,n$, and
 ${X_{(r',n',\tilde {m}_{n'},k')}}$,
 $r'=1,\ldots,n'$, be the GOS based on a common absolutely continuous cdf
 $F$. If
 $r' \leq r-1$ and
 $s'-r'=s-r$, then
 $$D_{(r,s,n,\tilde{m}_n,k)} \leq_{\textrm{lr}} D_{(r',s',n',\tilde{m}_{n'},k')}$$
provided that at least one of the following conditions hold: assumption A $'$ with
 $\gamma _{(s,n,\tilde {m}_n,k)}\geq 1$ or assumption B
 $'$ and in the following cases:
Case 1: For
$r\geq 3$, $m_{j}\leq m_{i}$ for all $i\leq j$ and $\gamma _{(s',n',\tilde {m}_{n'},k')}= \gamma _{(s,n,\tilde {m}_n,k)}$ hold.Case 2: For
$r=2$, $\gamma _{(s',n',\tilde {m}_{n'},k')}\leq \gamma _{(s,n,\tilde {m}_n,k)}$ holds.


Proof. Case 1:  $r\geq 3$. From (6), we have
 $$\frac{f_{D_{(r',s',n',\tilde{m}_{n'},k')}}(x)}{f_{D_{(r,s,n,\tilde{m}_n,k)}}(x)}={E[\phi(Y,x)]},$$
where  $\phi (y,x)$ is the same as (15), and
 $Y$ is a nonnegative random variable having a cdf belonging to the family
 $\mathcal {P}=\{G(\cdot \,|\,x),x \in \mathbb {R_+}\}$ with the pdf defined as in (8). Here, it is seen that the following hold in (15):
• The first term is constant with respect to
$x$ and $y$ since $\gamma _{(s',n',\tilde {m}_{n'},k')}= \gamma _{(s,n,\tilde {m}_n,k)}$;• The second term is decreasing in
$y$ due to Remark 2.11, (ii), since $m_{j}\geq m_{i}$ for all $i\leq j$;• The third term is decreasing in
$y$ since $m_{j}\geq m_{i}$ for all $i\leq j$.


Furthermore, according to the assumptions of the theorem and Lemma 2.8, we have  $G(\cdot \,|\,x_1) \geq _{st} G(\cdot \,|\,x_2)$ for
 $x_1 \leq x_2$. Now, part (i) of Lemma 2.5 implies that
 ${E[\phi (Y,x)]}$ is increasing in
 $x$.
Case 2:  $r=2$. From (2) and (6), we have
 \begin{align*} \left[\frac{f_{D_{(1,s',n',\tilde{m}_{n'},k')}}(x)}{f_{D_{(2,s,n,\tilde{m}_n,k)}}(x)}\right]^{{-}1}& = \int_{0}^{+\infty} \left[\frac{\bar F{(x+y)}}{\bar F{(x)}}\right]{{}^{\gamma_{(s,n,\tilde{m}_{n},k)}-1}}[\bar F{(x)}]{{}^{\gamma_{(s,n,\tilde{m}_n,k)}-\gamma_{(s',n',\tilde{m}_{n'},k')}}}\nonumber\\ & \quad \times \frac{{\psi}_{s-2}(\bar F_y{(x)})}{g_{s'}(F(x))}\frac{f(x+y)}{f(x)}\cdot \nu(y)\,dy\\ & =\int_{0}^{+\infty} \left[\frac{\bar F{(x+y)}}{\bar F{(x)}}\right]{{}^{\gamma_{(s,n,\tilde{m}_{n},k)}}}[\bar F{(x)}]{{}^{\gamma_{(s,n,\tilde{m}_n,k)}-\gamma_{(s',n',\tilde{m}_{n'},k')}}}\nonumber\\ & \quad \times \frac{{\psi}_{s-2}(\bar F_y{(x)})}{g_{s'}(F(x))}\frac{h(x+y)}{h(x)}\cdot \nu(y)\,dy, \end{align*}
where  $\nu (y)$ does not depend on
 $x$. First, note that
 $$\frac{{\psi}_{s-2}(\bar F_y{(x)})}{g_{s'}(F(x))}=\frac{{\psi}_{s'-1}(\bar F_y{(x)})}{g_{s'}(F(x))}$$
is decreasing in  $x$ by Lemma 2.9. Now, according to the assumptions of the theorem,
 ${f_{D_{(1,s',n',\tilde {m}_{n'},k')}}(x)}/{f_{D_{(2,s,n,\tilde {m}_n,k)}}(x)}$ is increasing in
 $x$. Thus, the proof is completed.
Remark 3.6. With the restrictions  $k=k'$ and
 $m_i=m'_i$, Hu and Zhuang [Reference Hu and Zhuang21] proved the statements of Theorems 3.3 and 3.4 under the additional condition
 $m_1=\cdots =m_{n-1}$ in their Theorem 4.1(c). Also, by choosing
 $s=r+p-1$ and
 $s'=r'+(p+1)-1$ with
 $r'=r-1$ in our Theorem 3.5, one can see that Theorem 4.4 of Hu and Zhuang [Reference Hu and Zhuang21] is a special case of Theorem 3.5.
Theorem 3.7. Let  ${X_{(r,n,\tilde {m}_n,k)}}$ and
 ${X_{(r,n',\tilde {m}'_{n'},k')}}$,
 $r=1,\ldots,\max \{n,n'\}$, be the GOS based on a common absolutely continuous cdf
 $F$. If
 $r=r'\geq 2$ and
 $s+1\leq s'$, then
 $$D_{(r,s,n,\tilde{m}_n,k)} \geq_{\textrm{lr}} D_{(r',s',n',\tilde{m}'_{n'},k')}$$
provided that  $m'_{j}\geq m_{i}$ for all
 $i\leq j$,
 $m'_i$ is increasing in
 $i$,
 $\gamma _{(s',n',\tilde {m}'_{n'},k')}= \gamma _{(s,n,\tilde {m}_n,k)}$ and
 \begin{align*} {\sum_{j=r-1}^{s-2}{(m'_j-m_j)}+\sum_{j=s-1}^{s'-2}m'_j}\geq 0 \end{align*}
holds and that at least one of the following conditions hold: assumption A with  $\gamma _{(s,n,\tilde {m}_n,k)}\geq 1$, or assumption B.
Proof. From (6), we have
 \begin{align*} \frac{f_{D_{(r,s',n',\tilde{m}'_{n'},k')}}(x)}{f_{D_{(r,s,n,\tilde{m}_n,k)}}(x)}={E[\phi(Y,x)]}, \end{align*}
where
 \begin{align} \phi(y,x)& \propto [\bar F{(x+y)}]^{\gamma_{(s',n',\tilde{m}'_{n'},k')}-\gamma_{(s,n,\tilde{m}_n,k)}}\frac{\check{\psi}_{s'-r}(\bar F_y{(x)})}{\psi_{s-r}(\bar F_y{(x)})}\frac{\check{g}_{r-1}(F(y))}{g_{r-1}(F(y))}\nonumber\\ & \quad \times [\bar F{(y)}]^{(\gamma_{(r-1,n',\tilde{m}'_{n'},k')}-\gamma_{(s',n',\tilde{m}'_{n'},k')})-(\gamma_{(r-1,n,\tilde{m}_n,k)}-\gamma_{(s,n,\tilde{m}_n,k)})},\nonumber\\ & =[\bar F{(x+y)}]^{\gamma_{(s',n',\tilde{m}'_{n'},k')}-\gamma_{(s,n,\tilde{m}_n,k)}}\cdot \Delta_{(r,r,s,s)}(x,y) \cdot \frac{\check{\psi}_{s'-r}(\bar F_y{(x)}) [{\bar F{(y)}}]^{{m'_{s'-1}}}}{\check{\psi}_{s-r}(\bar F_y{(x)}) [{\bar F{(y)}}]^{{m'_{s-1}}}} \frac{\check{g}_{r-1}(F(y))}{g_{r-1}(F(y))}\nonumber\\ & \quad \times[\bar F{(y)}]^{(\gamma_{(r-1,n',\tilde{m}'_{n'},k')}-\gamma_{(s',n',\tilde{m}'_{n'},k')})-(\gamma_{(r-1,n,\tilde{m}_n,k)}-\gamma_{(s,n,\tilde{m}_n,k)})-({{m'_{s-1}}-{m_{s-1}}})-({{m'_{s'-1}}-{m'_{s-1}}})}\nonumber\\ & = [F{(x+y)}]^{\gamma_{(s',n',\tilde{m}'_{n'},k')}-\gamma_{(s,n,\tilde{m}_n,k)}}\cdot \Delta_{(r,r,s,s)}(x,y) \cdot \frac{\check{\psi}_{s'-r}(\bar F_y{(x)}) [{\bar F{(y)}}]^{{m'_{s'-1}}}}{\check{\psi}_{s-r}(\bar F_y{(x)}) [{\bar F{(y)}}]^{{m'_{s-1}}}} \frac{\check{g}_{r-1}(F(y))}{g_{r-1}(F(y))}\nonumber\\ & \quad \times [\bar F{(y)}]^{(\sum_{j=r-1}^{s-2}m'_j-m_j)+(\sum_{j=s-1}^{s'-2}m'_j)}, \end{align}
 $\Delta _{(r,r,s,s)}(x,y)$ is defined as in (9), and
 $Y$ is a nonnegative random variable having a cdf belonging to the family
 $\mathcal {P}=\{G(\cdot \,|\,x),x \in \mathbb {R_+}\}$ with the pdf defined as in (8). It is seen that the following hold in (16):
• The first term is constant with respect to
$x$ and $y$ because of $\gamma _{(s',n',\tilde {m}'_{n'},k')}= \gamma _{(s,n,\tilde {m}_n,k)}$;• The second term is decreasing in
$x$ and $y$ due to Lemma 2.12 since $m'_{j}\geq m_{i}$ for all $i\leq j$;• The third term is decreasing in
$x$ and $y$ due to parts (ii) and (iii) of Lemma 2.6, since $m'_i$ is increasing in $i$;• The fourth term is decreasing in
$y$ due to part (i) of Remark 2.11, since $m'_{j}\geq m_{i}$ for all $i\leq j$;• The fifth term is decreasing in
$y$ because of ${\sum _{j=r-1}^{s-2}(m'_j-m_j)+\sum _{j=s-1}^{s'-2}m'_j}\geq 0$.


Furthermore, according to the assumptions of the theorem and Lemma 2.8, we have  $G(\cdot \,|\,x_1) \leq _{st} G(\cdot \,|\,x_2)$ for
 $x_1 \leq x_2$. Now, part (ii) of Lemma 2.5 implies that
 ${E[\phi (Y,x)]}$ is decreasing in
 $x$.
Let  $D^{(p)}_{(r,n)}$ denote the
 $p$-spacings of OS. As a corollary of the above theorem, if
 $X \in {\rm DLR}$, then
 $D^{(p)}_{(r,n)}\geq _{\textrm {lr}} D^{(p+1)}_{(r,n+1)}$, because of
 $m'_{i}=m_{i}=0$ and
 $$1+(n+1)-(r+(p+1)-1)=\gamma_{(s',n',\tilde{m}'_{n'},k')}= \gamma_{(s,n,\tilde{m}_n,k)}=1+n-(r+p-1).$$
Remark 3.8. By choosing the parameters of GOS appropriately, our general results can be used to compare the  $p$-spacings from submodels of GOS. In this way, we can obtain results for
 $p$-spacings from
 $k$-record values (cf. [Reference Kamps23,Reference Kamps24]), progressive Type-II right censored order statistics with arbitrary censoring schemes (cf. [Reference Balakrishnan and Cramer6]), and order statistics under multivariate imperfect repair (cf. [Reference Belzunce, Mercader and Ruiz9]). More generally, we can compare p-spacings from different submodels. For example, we can compare that obtained from OS and sequential order statistics (cf. Cramer and Kamps [Reference Cramer and Kamps14]), from Pfeifer's record values and the epoch times of a nonhomogeneous Poisson process (cf. [Reference Belzunce, Mercader and Ruiz8]), and so forth.
4. Relations among logconvexity properties
The notion of logconcavity/logconvexity plays an important role not only in different areas of Statistics but also in Mathematics, Economics, etc. In Reliability Theory, the different aspects of this concept have been studied so far (see, e.g., [Reference Alimohammadi, Alamatsaz and Cramer3,Reference Navarro and Shaked29,Reference Navarro, Ruiz and del Aguila30], and references therein). First, we give some results relating to logconvexity. Pellerey et al. [Reference Pellerey, Shaked and Zinn32] proved that if the hazard rate function  $h(x)$ is logconcave, then the pdf
 $f(x)$ is logconcave. For the reversed hazard rate function
 $\kappa (x)$, Alimohammadi et al. [Reference Alimohammadi, Alamatsaz and Cramer2] proved that if
 $\kappa (x)$ is logconcave, then the pdf
 $f(x)$ is logconcave. For logconvexity, we have the following implications.
Proposition 4.1. Let  $X$ be a random variable with an absolutely continuous distribution and support
 $(a,\infty )$ for a real number
 $a$.
(i) If
$h$ is logconvex and decreasing, then $f$ is logconvex;(ii) If
$f$ is logconvex, then $\kappa$ is logconvex.


Proof. (i) As  $h(x)=f(x)/\bar {F}(x)$, we get
 \begin{equation} \ln f(x)=\ln h(x)+\ln \bar{F}(x)=\ln h(x)-\int_{a}^{x} h(u)\,du. \end{equation}
Since  $h$ is decreasing, it follows that
 $\int _{a}^{x} h(u)\,du$ is concave which means that
 $-\int _{a}^{x} h(u)\,du$ is convex. So, (17) becomes the sum of two convex functions. Therefore,
 $\ln f$ is convex.
(ii) According to Theorem 2.2, if  $f$ is logconvex, then
 $F$ is logconcave which in turn implies that
 $1/F$ is logconvex. Thus,
 $\kappa (x)=f(x)\cdot (F(x))^{-1}$ is logconvex.
Moreover, it is well known that if  $f$ is logconvex with support
 $(a,\infty )$, then
 $\kappa$ is decreasing (see e.g., p. 315 in [Reference Navarro, Ruiz and del Aguila30] and Figure 2 of [Reference Alimohammadi, Alamatsaz and Cramer3]).
We complete the analysis of the implications in Proposition 4.1 with some examples. The following example satisfies the assumptions in that proposition.
Example 4.2. Suppose that  $X$ has a Pareto distribution with pdf
 $f(x)=(1+x)^{-2}$,
 $x\geq 0$. By some direct calculations, one can see that
 $h(x)=(1+x)^{-1}$ is logconvex and decreasing. Also,
 $f$ is logconvex and
 $\kappa (x)=(x^{2}+x)^{-1}$ is logconvex and decreasing. Also, one can consider the exponential distribution as an obvious example.
The following counterexamples show that the implications (ii) and (i) in Proposition 4.1 do not hold in the reverse direction, respectively.
Counterexample 4.3. Suppose that  $X$ has the generalized exponential distribution with pdf
 $f(x)=\beta e^{-x}(1-e^{-x})^{\beta -1}$,
 $x\geq 0$,
 $\beta >0$. It is easy to see that
 $\kappa (x)=\beta (e^{x}-1)^{-1}$ is logconvex and decreasing for all
 $\beta >0$. However, for
 $\beta > 1$,
 $f$ is strictly logconcave (see, e.g., Table 1 of [Reference Alimohammadi, Alamatsaz and Cramer3]).
Counterexample 4.4. Suppose that  $X$ has a truncated Cauchy distribution with pdf
 $f(x)=(4/\pi )(1+x^{2})^{-1}$ for
 $x\geq 1$. It is logconvex over
 $x>1$. The hazard rate function is
 $h(x)=(1+x^{2})^{-1}/(\pi /2-\arctan (x))$ for
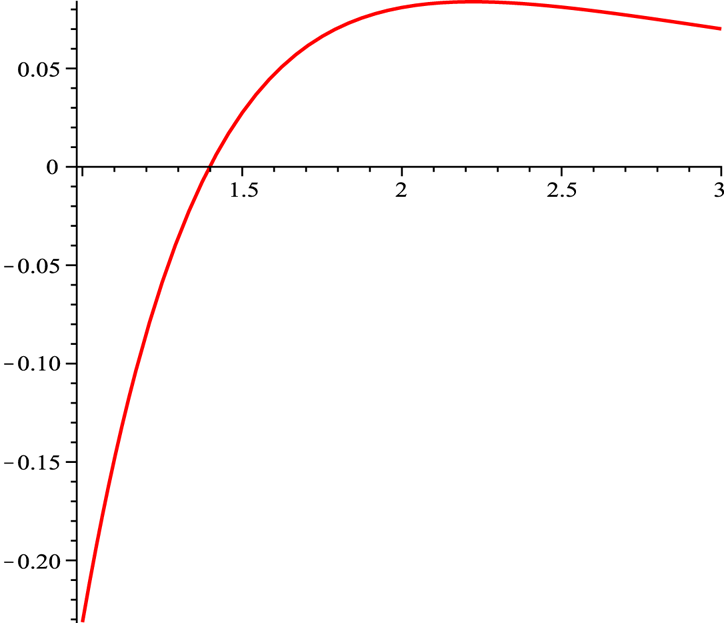
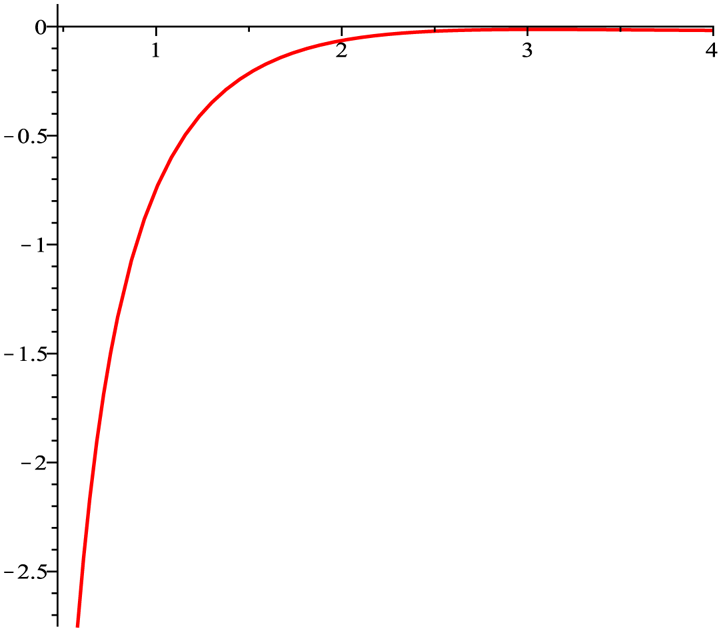
 $x\geq 1$. However, Figure 1 shows that
 $(\ln h(x))''$ takes negative values and, therefore,
 $h$ is not logconvex.
Plot of  $(\ln h(x))''$ in Counterexample 4.4.

Remark 4.5. We should note that according to the previous logconcavity findings and Proposition 4.1, there are two differences as follows:
(i) If
$h$ is logconcave, then $f$ is logconcave, and, if $h$ is logconvex (with the condition that it is decreasing), then $f$ is logconvex. But, for inheritance of logconcavity/logconvexity among $f$ and $\kappa$, we have
$$\kappa \mathrel{\mathop{{\buildrel \longrightarrow \over \longleftarrow}}\limits_{{\rm logconcavity}}^{{\rm logconvexity}}}f;$$(ii) Pellerey et al. [Reference Pellerey, Shaked and Zinn32] proved that if
$h$ is logconcave, then it must be increasing. Using this result, they showed that logconcavity of $h$ implies that of $f$. However, logconvexity of $h$ does not necessarily imply that it is decreasing. As a counterexample, suppose that $f(x)=e^{x+1-e^{x}}$, $x\geq 0$. The corresponding hazard rate function $h(x)=e^{x}$ is logconvex and increasing. Also, since $f$ is logconcave (see, e.g., [Reference Pellerey, Shaked and Zinn32]), this counterexample shows that the condition $h$ is decreasing can not be relaxed in Proposition 4.1.


Now, we consider the preservation of logconvexity among spacings of GOS. For OS, Misra and van der Meulen [Reference Misra and van der Meulen28] proved that if  $X$ is DLR, then the simple spacings are also DLR, and if
 $X$ is ILR, then the
 $p$-spacings are also ILR. According to their Remark 3.1, the result for
 $p$-spacings (
 $p\geq 2$) is not valid for the DLR case. Then, Hu and Zhuang [Reference Hu and Zhuang21] extended these results for GOS under the condition
 $m_1=\cdots =m_{n-1}$. Finally, Chen et al. [Reference Chen, Xie and Hu11] gave the result without condition
 $m_1=\cdots =m_{n-1}$ just for ILR case. The following theorem states the result for the DLR case without condition
 $m_1=\cdots =m_{n-1}$.
Theorem 4.6. Let  ${X_{(r,n,\tilde {m}_n,k)}}$,
 $r=1,\ldots,n$, be the GOS based on an absolutely continuous cdf
 $F$ and let us assume
 ${\gamma _{(r,n,\tilde {m}_n,k)}\geq 1}$ for
 $r=1,\ldots,n$. If
 $X$ is DLR, then the simple spacings
 $D_{(r,r,n,\tilde {m}_n,k)}$ are also DLR for
 $r=1,\ldots,n$.
Proof. We give the proof in two cases.
Case 1:  $r\geq 2$. First note that a function
 $f$ is logconvex if, and only if,
 $f(x+\varepsilon )/f(x)$ is increasing in
 $x$ for all
 $\varepsilon >0$. From (6), we have
 $$\frac{f_{D_{(r,r,n,\tilde{m}_n,k)}}(x+\varepsilon)}{f_{D_{(r,r,n,\tilde{m}_n,k)}}(x)}={E[\phi(\tilde Y,x)]},$$
where
 $$\phi(y,x)=\left[\frac{\bar F{(x+\varepsilon +y)}}{\bar F{(x+y)}}\right]^{\gamma_{(r,n,\tilde{m}_n,k)}-1}\frac{f(x+\varepsilon +y)}{f(x+y)},$$
and  $\tilde Y$ is a nonnegative random variable having a cdf belonging to the family
 $\mathcal {\tilde P}=\{\tilde G(\cdot \,|\,x),x \in \mathbb {R_+}\}$ with corresponding pdf
 $$\tilde \zeta(y\,|\,x)=c(x){[\bar F{(x+y)}]^{\gamma_{(r,n,\tilde{m}_n,k)}-1}}f(x+y)[\bar F{(y)}]^{m_{r-1}}g_{r-1}(F(y))f(y),$$
where  $c(x)$ is the normalizing constant. According to Theorem 2.2,
 $\phi (y,x)$ is increasing in
 $x$ and
 $y$. Also, it is easy to see that
 $\tilde G(\cdot \,|\,x_1) \leq _{\textrm {lr}} \tilde G(\cdot \,|\,x_2)$ for
 $x_1 \leq x_2$. Thus, part (i) of Lemma 2.5 implies that
 $E[\phi (\tilde Y,x)]$ is increasing in
 $x$.
Case 2:  $r=1$. According to (2) and Theorem 2.2,
 ${f_{D_{(1,1,n,\tilde {m}_n,k)}}}$ becomes the product of logconvex functions and, thus, it is logconvex. Therefore, the proof is completed.
As seen in Appendix, the DLR property is not preserved by GOS for different values of parameter  $m_i$ including record values. However, the record values and, more generally, the
 $k$-record values from the exponential distribution (which is both logconvex and logconcave) are logconcave. The pdf of the
 $r$th
 $k$-record value
 $X_r^{*}$ is given by
 \begin{equation} f_{X_r^{*}}(x)={k^{r}}{(r-1)!}{[\bar{F}{(x)}]^{k-1}}[-\ln \bar{F}(x)]^{r-1}f(x), \end{equation}
(see, e.g., [Reference Arnold, Balakrishnan and Nagaraja5]). For the exponential distribution with parameter  $\beta >0$, we have
 $-\ln \bar {F}(x)=\beta x$ which is logconcave. In another direction, if
 $f$ is logconcave (logconvex), then
 $\bar F$ is logconcave (logconvex). So, (18) becomes the product of logconcave functions and, therefore,
 $f_{X_r^{*}}$ is logconcave as claimed. This is also deduced from Corollary 2.4 of Chen et al. [Reference Chen, Xie and Hu11] where it is stated that the logconcavity of
 $f$ is not sufficient for the logconcavity of record values and that we need a stronger condition that
 $h$ is logconcave. Since
 $h$ is both logconcave and logconvex in the exponential distribution, this example also reveals that the record values could not be logconvex even under the logconvexity of hazard rate
 $h$.
5. Discussion
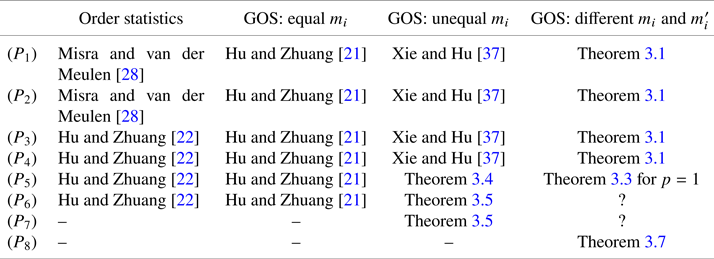
In this article, we have studied the likelihood ratio ordering of  $p$-spacings of ordered random variables under the GOS model. We not only have strengthened and complemented some previous findings but also have obtained some new results. In Table 1, we summarize the previous findings and the new results obtained with respect of the problems stated in the introduction.
Problems on likelihood ratio ordering of  $p$-spacings.

There are still two open problems:
(I) Is problem (
$P_5$) valid for GOS with different $m_i$ and $m'_i$ and $p \geq 2$?(II) Is problem (
$P_6$) [or ($P_7$)] valid for GOS with different $m_i$ and $m'_i$?


However, according to our numerous computations (two of which are given in Example 5.3), we conjecture that both problems are valid as follows:
Conjecture 5.1. Theorem 3.4 including different  $\tilde {m}_n$ and
 $\tilde {m}'_{n'}$ is valid with the following additional condition for
 $r\geq 2$:
 $m'_{j}\leq m_{i}$ for all
 $i\leq j$.
Conjecture 5.2. Theorem 3.5 including different  $\tilde {m}_n$ and
 $\tilde {m}'_{n'}$ is valid with the following additional condition for
 $r\geq 3$:
 $m'_{j}\geq m_{i}$ for all
 $i\leq j$.
Example 5.3. Let  $X$ be the uniform distribution with pdf
 $f(x)=1$,
 $0 \leq x \leq 1$, which is logconcave. First, for Conjecture 5.1 consider
 $r=2$,
 $n=3$,
 $s=3$ (and hence
 $p=2$),
 $\tilde {m}_2=\{2,1\}$,
 $k=1$ and
 $r'=r+1=3$,
 $n'=n+1=4$,
 $s'=4$ (and hence
 $p=2$),
 $\tilde {m}'_3=\{1,0,0\}$,
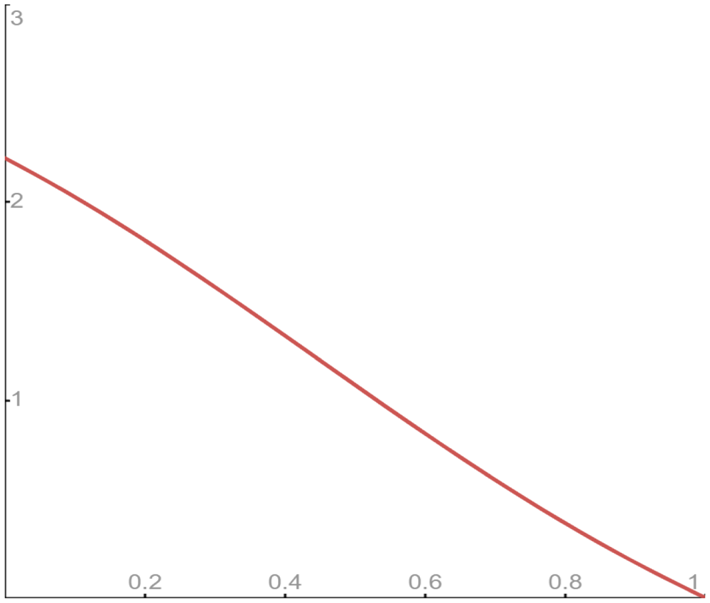
 $k'=1$. One can see that the parameters satisfy the conditions of Conjecture 5.1. Figure 2 shows that
 $\rho _1(x)={f_{D_{(3,4,4,\{1,0,0\},1)}}(x)}/{f_{D_{(2,3,3,\{2,1\},1)}}(x)}$ is decreasing in
 $x \in (0,1)$, and, thus
 $D_{(2,3,3,\{2,1\},1)} \geq _{\textrm {lr}} D_{(3,4,4,\{1,0,0\},1)}$ holds.
Plot of  $\rho _1(x)$ in Example 5.3.

Now, for Conjecture 5.2, consider  $r=3$,
 $n=3$,
 $s=3$ (and hence
 $p=1$),
 $\tilde {m}_2=\{0,1\}$,
 $k=1$ and
 $r'=r-1=2$,
 $n'=n=3$,
 $s'=3$ (and hence
 $p=2$),
 $\tilde {m}'_2=\{1,2\}$,
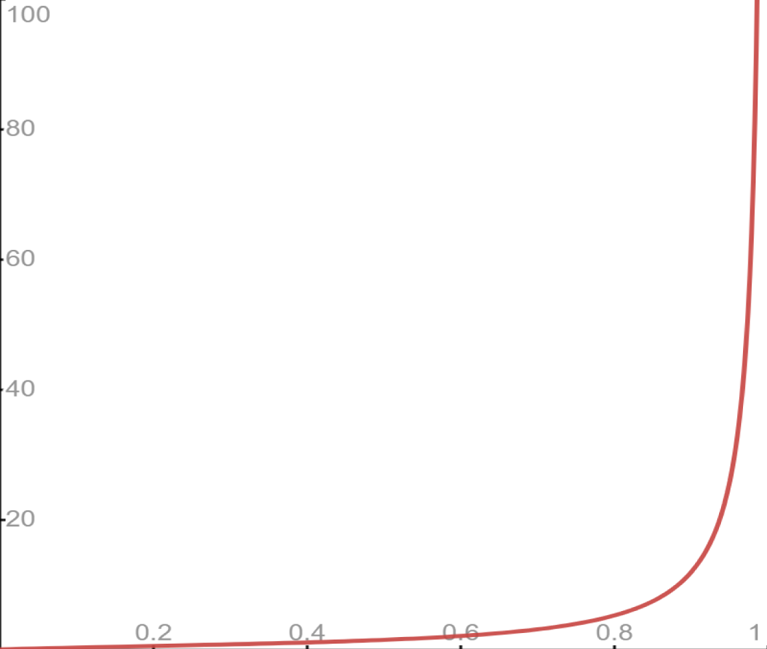
 $k'=1$. Obviously, the parameters satisfy the conditions of Conjecture 5.2. Figure 3 shows that
 $\rho _2(x)={f_{D_{(2,3,3,\{1,2\},1)}}(x)}/{f_{D_{(3,3,3,\{0,1\},1)}}(x)}$ is increasing in
 $x \in (0,1)$, and thus
 $D_{(3,3,3,\{0,1\},1)} \leq _{\textrm {lr}} D_{(2,3,3,\{1,2\},1)}$ holds.
Plot of  $\rho _2(x)$ in Example 5.3.

Acknowledgments
The authors are grateful to the reviewers for several constructive comments which lead to an improved version of the manuscript. J.N. is supported in part by the Ministerio de Ciencia e Innovación of Spain under grant PID2019-103971GB-I00/AEI/10.13039/501100011033.
Appendix
In this appendix, we first give the proofs of the lemmas included in Section 2. Then, we investigate the preservation of logconvexity among GOS.
Proof of Lemma 2.6. (i) From (7), for all  $y_1 \leq y_2$, we have
 \begin{align*} \frac{\psi_{s-r}(\bar F_{y_2}{(x)})}{\psi_{s-r}(\bar F_{y_1}{(x)})}& = \frac{\int_{\mathbb{R}} I_{\{0 \leq u \leq x\}} \psi_{s-r-1}(\bar F_{y_2}{(u)})[\bar F_{y_2}{(u)}]^{m_{s-1}}\frac{f(u+y_2)}{\bar F{(y_2)}}\,du}{\int_{\mathbb{R}} I_{\{0 \leq u \leq x\}} \psi_{s-r-1}(\bar F_{y_1}{(u)})[\bar F_{y_1}{(u)}]^{m_{s-1}}\frac{f(u+y_1)}{\bar F{(y_1)}}\,du}\\ & =E[\phi(U,x)], \end{align*}
where  $I_A$ is the indicator function,
 \begin{align} \phi(u,x)& \propto \frac{\psi_{s-r-1}(\bar F_{y_2}{(u)})}{\psi_{s-r-1}(\bar F_{y_1}{(u)})}\left[\frac{\bar F{(u+y_2)}}{\bar F{(u+y_1)}}\right]^{m_{s-1}}\frac{f(u+y_2)}{f(u+y_1)} \end{align}
 \begin{align} & =\frac{\psi_{s-r-1}(\bar F_{y_2}{(u)})}{\psi_{s-r-1}(\bar F_{y_1}{(u)})}\left[\frac{\bar F{(u+y_2)}}{\bar F{(u+y_1)}}\right]^{m_{s-1}+1}\frac{h(u+y_2)}{h(u+y_1)}, \end{align}
and  $U$ is a nonnegative random variable having a cdf belonging to the family
 $\mathcal {P}=\{G(\cdot \,|\,x,y_1),x,y_1\in \mathbb {R_+}\}$ with corresponding pdf
 \begin{equation} g(u\,|\,x,y_1)=c(x,y_1)I_{\{0 \leq u \leq x\}} \psi_{s-r-1}(\bar F_{y_1}{(u)})[\bar F_{y_1}{(u)}]^{m_{s-1}}\frac{f(u+y_1)}{\bar F{(y_1)}}, \end{equation}
in which
 $$c(x,y_1)=\left[\int_0^{x} \psi_{s-r-1}(\bar F_{y_1}{({z})})[\bar F_{y_1}{({z})}]^{m_{s-1}}\displaystyle\frac{f({z}+y_1)}{\bar F{(y_1)}}\,d{z}\right]^{{-}1},$$
is the normalizing constant. First, note that, for  $x_1 \leq x_2$,
 $$\frac{g(u\,|\,x_2,y_1)}{g(u\,|\,x_1,y_1)} \propto \frac{I_{\{0 \leq u \leq x_2\}}}{I_{\{0 \leq u \leq x_1\}}},$$
is increasing in  $u$ because
 $I_{\{0 \leq u \leq x\}}$ is
 $TP_2$ in
 $(x,u)$. Let
 $s-r=1$. According to (A.1), one can see that
 $\phi (u,x)$ is increasing (decreasing) in
 $u$ when
 $f$ is logconvex (logconcave) and
 $m_i\geq 0$. Also, according to (A.2),
 $\phi (u,x)$ is increasing (decreasing) in
 $u$ when
 $f$ and
 $h$ are logconvex (logconcave) and
 $-1\leq m_i < 0$ (note that if
 $h$ is logconcave, then
 $f$ is so, see [Reference Pellerey, Shaked and Zinn32]). Furthermore,
 $\phi (u,x)$ is constant with respect to
 $x$. Thus, the desired result follows by induction and Lemma 2.5.
(ii) From (7), we have
 \begin{align} \psi_{s-r}(\bar F_y{(x)}) [{\bar F{(y)}}]^{{m_{s-1}}} & =\int_{0}^{x} \psi_{s-r-1}(\bar F_y{(u)})[\bar F{(u+y)}]^{m_{s-1}}\frac{f(u+y)}{\bar F{(y)}}\,du \end{align}
 \begin{align} & =\int_{0}^{x} \psi_{s-r-1}(\bar F_y{(u)})[\bar F{(u+y)}]^{m_{s-1}+1}\frac{h(u+y)}{\bar F{(y)}}\,du. \end{align}
We prove the stated result only under assumptions A or A $'$ by using (A.4). The proof under assumption B or B
 $'$ from (A.5) is similar and, thus, omitted. Consider
 $[\bar F{(u+y)}]^{m_{s-1}}$ as a function of three variables
 $(u,y,s)$.
First, suppose that  $m_i$ is decreasing in
 $i$. Then,
 $[\bar F{(u+y)}]^{m_{s-1}}$ is
 $TP_2$ in
 $(u,s)$ and
 $(y,s)$. If
 $f$ is logconvex and
 $m_i\geq 0$, then it is also
 $TP_2$ in
 $(u,y)$. Also, when
 $f$ is logconvex, then
 $f(u+y)$ is
 $TP_2$ in
 $(u,y)$. By induction and part (i.a) of Theorem 2.4, we can conclude that the integral in (A.4) is
 $TP_2$ in
 $(y,s)$.
Let us assume now that  $m_i$ is increasing in
 $i$. By means of a similar approach and using part (ii.b) of Theorem 2.4 this time, we can conclude that the integral in (A.4) is
 $RR_2$ in
 $(y,s)$.
(iii) From (7), we have
 \begin{align*} \psi_{s-r}(\bar F_y{(x)})=\int_{\mathbb{R}} I_{\{0 \leq u \leq x\}} \psi_{s-r-1}(\bar F_y{(u)})\big[\bar F_y{(u)}\big]^{m_{s-1}}\frac{f(u+y)}{\bar F{(y)}}\,du. \end{align*}
If  $m_i$ is decreasing (increasing) in
 $i$, then
 $[\bar F{(u+y)}]^{m_{s-1}}$ is
 $TP_2$
 $(RR_2)$ in
 $(u,s)$. Now, since
 $I_{\{0 \leq u \leq x\}}$ is
 $TP_2$ in
 $(x,u)$, we have the desired result using induction and part (i.a) (part (ii.a)) of Theorem 2.4.
Proof of Lemma 2.8. To prove  $G(\cdot \,|\,x_1) \leq _{\textrm {lr}}(\geq _{\textrm {lr}}) G(\cdot \,|\,x_2)$ for
 $x_1 < x_2$, we consider the ratio
 \begin{align*} \frac{\zeta(y\,|\,x_2)}{\zeta(y\,|\,x_1)} & \propto \left[\frac{\bar F{(x_2+y)}}{\bar F{(x_1+y)}}\right]^{\gamma_{(s,n,\tilde{m}_n,k)}-1}\frac{\psi_{s-r}(\bar F_y{(x_2)})}{\psi_{s-r}(\bar F_y{(x_1)})}\frac{f(x_2+y)}{f(x_1+y)}\\ & =\left[\frac{\bar F{(x_2+y)}}{\bar F{(x_1+y)}}\right]^{\gamma_{(s,n,\tilde{m}_n,k)}}\frac{\psi_{s-r}(\bar F_y{(x_2)})}{\psi_{s-r}(\bar F_y{(x_1)})} \frac{h(x_2+y)}{h(x_1+y)}. \end{align*}
Now, the result follows according to the assumptions stated in the lemma and part (i) of Lemma 2.6.
Proof of Lemma 2.9. From (4) and (7), we have
 $$\frac{{\psi}_{s-1}(\bar F_y{(x)})}{g_{s}(F(x))}=E[\phi(U,x)],$$
where
 \begin{align*} \phi(u,x)& \propto \frac{{\psi}_{s-2}(\bar F_y{(u)})}{g_{s-1}(F(u))}\frac{[\bar F{(u+y)}]{{}^{m_{s-1}}}}{[\bar F{(u)}]{{}^{{m_{s-1}}}}}\frac{f(u+y)}{f(u)}\\ & =\frac{{\psi}_{s-2}(\bar F_y{(u)})}{g_{s-1}(F(u))}\left[\frac{\bar F{(u+y)}}{\bar F{(u)}}\right]{{}^{{m_{s-1}}+1}}\frac{h(u+y)}{h(u)}, \end{align*}
and  $U$ is a nonnegative random variable having a cdf belonging to the family
 $\mathcal {P}=\{G(\cdot \,|\,x),x \in \mathbb {R_+}\}$ with corresponding pdf
 $$g(u\,|\,x)=c(x)I_{\{0 \leq u \leq x\}} {g_{s-1}(F(u))}{[\bar F{(u)}]{{}^{m_{s-1}}}}{f(u)},$$
in which
 $$c(x)=\left[\int_0^{x} {g_{s-1}(F({z}))}{[\bar F{({z})}]{{}^{{m_{s-1}}}}}{f({z})}\,d{z}\right]^{{-}1},$$
is the normalizing constant. Obviously,  $G(\cdot \,|\,x_1) \leq _{\textrm {lr}} G(\cdot \,|\,x_2)$ for
 $x_1 < x_2$, and, according to the conditions of lemma,
 $\phi (u,x)$ is increasing (decreasing) in
 $u$. Also,
 $\phi (u,x)$ is constant with respect to
 $x$. Thus, the result follows by induction and part (i) (part (ii)) of Lemma 2.5.
Proof of Lemma 2.12. (i) From (7), we have
 $$\Delta_{(r,r',s,s')}(x,y)=E[\phi(U,y)],$$
where
 \begin{align*} \phi(u,y)& \propto \frac{\check{\psi}_{s'-r'-1}(\bar F_y{(u)})}{\psi_{s-r-1}(\bar F_y{(u)})}\left[\frac{\bar F{(u+y)}}{\bar F{(y)}}\right]^{{{m'_{s'-1}}-{m_{s-1}}}}\cdot [\bar F{(y)}]^{{m'_{s'-1}}-{m_{s-1}}}\\ & =\frac{\check{\psi}_{s'-r'-1}(\bar F_y{(u)})}{\psi_{s-r-1}(\bar F_y{(u)})} [\bar F{(u+y)}]^{{{m'_{s'-1}}-{m_{s-1}}}}, \end{align*}
and  $U$ is a nonnegative random variable having a cdf belonging to the family
 $\mathcal {P}=\{G(\cdot \,|\,x,y),x,y\in \mathbb {R_+}\}$ with the pdf given in (A.3). By assumptions, we have
 $G(\cdot \,|\,x,y_1) \leq _{\textrm {lr}} G(\cdot \,|\,x,y_2)$ for
 $y_1 < y_2$. Let
 $s'-r'=s-r=1$. Because of
 $m'_{j}\leq m_{i}$ (
 $m'_{j}\geq m_{i}$) for all
 $i\leq j$,
 $\phi (u,y)$ is increasing (decreasing) in both
 $u$ and
 $y$. So, the desired result follows by induction and part (i) (part (ii)) of Lemma 2.5.
(ii) The method of proof is similar to that of part (i) and so it is omitted.
Finally, we examine the preservation of logconvexity among GOS. Cramer [Reference Cramer12] and Chen et al. [Reference Chen, Xie and Hu11] proved the closure of ILR property among GOS without the condition  $m_1=\cdots =m_{n-1}$. In the following counterexample, we show that the DLR property is not preserved among GOS. To do this, obviously we do not need that
 $m_i$'s are not equal, and so we assume
 $m_i=m$ for all
 $i$. We consider four cases:
 $m=-1$ (record values),
 $-1< m<0$,
 $m=0$ (OS), and
 $m>0$. Before giving the counterexample, according to (2) and Theorem 2.2, it is worth noting that the DLR property is preserved by the smallest GOS if
 ${\gamma _{(1,n,\tilde {m}_n,k)}\geq 1}$. This contains the lifetime of series systems and, more generally, sequential series systems with parameter
 $\alpha _1\geq 1/n$ (cf. model in (1)).
Counterexample 5.2 Consider the pdf  $f(x)=(e^{-x}+2e^{-2x})/2$ for
 $x\geq 0$. Since the mixture of logconvex densities is logconvex (cf. [Reference Barlow and Proschan7] p. 103), it follows that
 $f$, being a mixture of exponential densities, is logconvex. Consider
 $k=1$,
 $r=2$ and
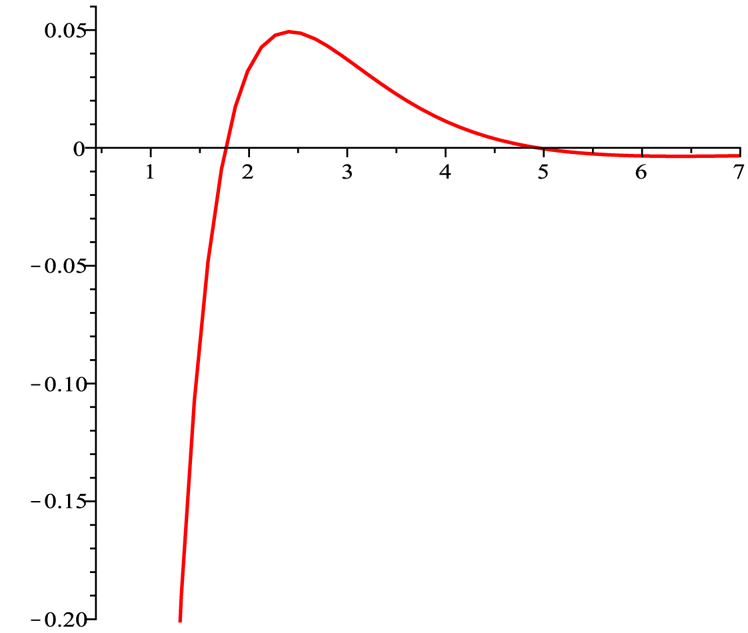
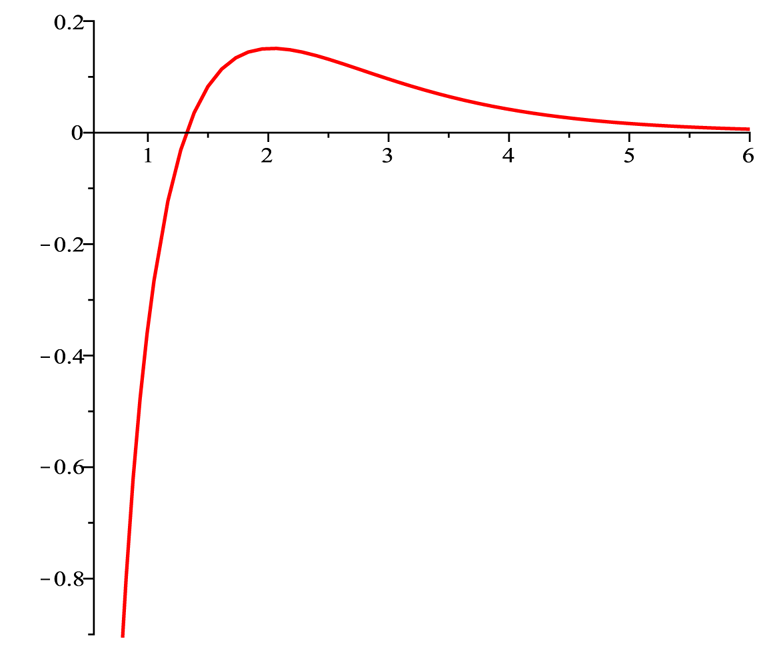
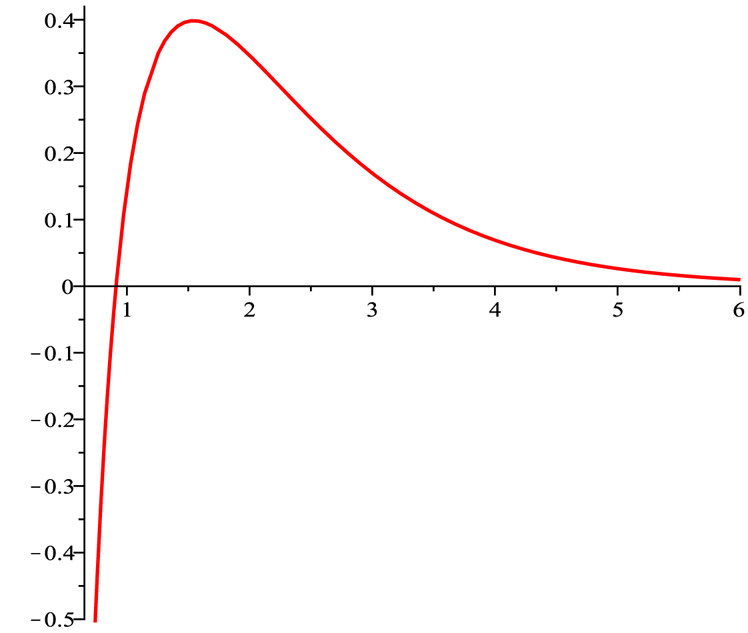
 $n=3$. As shown in Figures A.1–A.4,
 $(\ln f(x))''$ is not nonnegative for different values of
 $m$.
Plot of  $(\ln f(x))''$ for
 $m=-1$.

Plot of  $(\ln f(x))''$ for
 $m=-0.5$.

Plot of  $(\ln f(x))''$ for
 $m=0$.

Plot of  $(\ln f(x))''$ for
 $m=1$.