

Introduction
Is the decline in Canada’s public share of health expenditures a result of fundamental economic forces or a policy choice driven by ideology? This paper estimates the determinants of the public–private health expenditure split using Canadian province-level data. The Canadian federation, with its regional diversity and data consistency, offers an interesting test space for international health policy issues.
The determinants of health care spending are a major international research focus (Kleiman, Reference Kleiman and Perlman1974; Newhouse, Reference Newhouse1977; Leu, Reference Leu, Robert, Culyer and Jonsson1986; Parkin et al., Reference Parkin, McGuire and Yule1987; Gerdtham et al., Reference Gerdtham, Jonsson, MacFarlan, Oxley and Zweifel1992; Gbsesmete and Gerdtham, Reference Gbesemete and Gerdtham1992; Hitiris and Posnett, Reference Hitiris and Posnett1992; Rubin and Koelln, Reference Rubin and Koelln1993; Murthy and Ukpolo, 1994; Hansen and King, 1996; Blomqvist and Carter, Reference Blomqvist and Carter1997; Barros, Reference Barros1998; Di Matteo and Di Matteo, Reference Di Matteo1998; Gerdtham et al., Reference Gerdtham, Sogaard, Andersson and Jonsson1998; Di Matteo, Reference Di Matteo2000; Jewell et al., 2003; Di Matteo, Reference Di Matteo2004). The public–private funding balance has also grown as an area of interest as countries experience growth in the share of private health spending (Tountas et al., Reference Tountas, Karnaki, Pavi and Souliotis2005; Jeong, Reference Jeong2005; Tuohy et al., Reference Tuohy, Flood and Stabile2004; Clemente et al., Reference Clemente, Marcuello, Montanes and Pueyo2004; Lynch and Calnan, Reference Lynch and Calnan2003; Propper, Reference Propper2000; Poullier, Reference Poullier, Culyer and Jonsson1986; and Leu, Reference Leu, Robert, Culyer and Jonsson1986). While expenditure growth seems unrelated to the funding system, there is convergence in the funding mix, leading to the question whether a common health care funding structure is emerging across countries (Barros, Reference Barros2007). Gouveia (1996) finds price and income elasticities of public health expenditures are larger than private, reminding us that understanding the differences between public and private health spending helps understand health expenditure drivers.
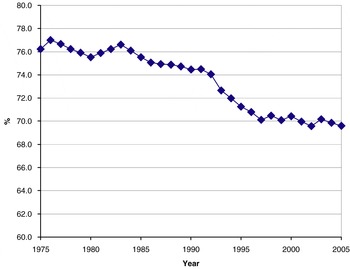
Like other countries, Canada has seen rising per capita health expenditures as well as rising health spending as a proportion of Gross Domestic Product (GDP). In 2005, Canada spent CAD $142 billion health, representing 10.4% of GDP (Canadian Institute for Health Information, 2005a). The share of publicly funded health expenditures in Canada declined from 76.2% in 1975 to 69.6% in 2005. However, the Canadian privatization trend has stabilized as the public share was estimated at 70.6% in 2007.
The regression results published here find that the determinants of the split between public and private spending to be the relative price of health care, per capita income, federal cash transfers, the proportion of the population over age 65, provincial dummy variables, political parties, the Canada Health Act, the Canada Health and Social Transfer (CHST), and a time trend invoking technological change. The increase in the private share of health spending is partly due to policy and this is reinforced by the significance of provincial and political party variables reflecting regional policy and ideological differences. As well as contributing to the international literature on the public–private balance, the current analysis of Canadian health spending is also of domestic interest given the absence of an explicit national debate on whether Canadians want a smaller public health care sector.
The Supreme Court of Canada ruled in the Chaoulli decision of June 2005 that publicly provided health services were not being provided in a timely manner in Quebec. Quebec’s ban on private insurance for publicly insured health services was said to violate Quebec’s Charter of Human Rights and Freedoms potentially opening the door to more private care (Marchildon, Reference Marchildon, Gregory2005). In Ontario, the Chaoulli case was used to argue, albeit unsuccessfully, that the Ontario Health Insurance Plan should pay for the cost of a transplant undergone in England (Flora v. Ontario, Health Insurance General Manager Case, 2007; Jaffey, Reference Jaffey2007). In Alberta, plaintiff Bill Murray took the Alberta government to court arguing that the public insurer denied him hip resurfacing surgery, forcing him to go elsewhere and pay out-of-pocket, and thereby failed to provide timely access to medical treatment, while prohibiting access to private medical insurance.
It is argued that at a minimum, the Chaoulli decision guarantees Canadians access to medically insured services within reasonable waiting times and also may establish the right to obtain privately any health care services the public health care system does not make reasonably available (O’Brien and Watts, 2007). Moreover, the decision represents a shift away from judicial deference to government policy and towards court acknowledgement that the public health care system cannot offer everything (O’Brien and Watts, Reference O’Brien and Watts2007).
The unconstitutional prohibition on private health insurance when the public system fails to deliver appears to be a turning point, as plans are underway to expand private clinics (Kraus, Reference Krauss2006). However, the increases in private clinics are largely confined to British Columbia and Quebec; the Canadian Independent Medical Clinics Association says that there are 200–300 independent private clinics operating in Canada with the majority of them being private surgical and medical imaging facilities in the two provinces (Pooley, 2006). British Columbia is also looking at expanding the use of private clinics to deliver publicly funded health care, which at present only account for 2% of all procedures financed by provincial medicare (Mickelburgh, 2007).
Of four key health reform reports between 2001 and 2002, two – the Fykes Report and the Romanow Report – argued against increased private delivery of health care services, while the other two – Kirby and Mazankowski – encouraged more (Alberta, 2001; Saskatchewan, 2001; Canada, 2002a; Canada, 2002b). The 2006 Federal election was notable for its absence of discussion on health care.Footnote 1 In the context of these reports and the lack of debate, it would appear that increased private health care is ‘privatization by default’ even though the Canadian public health care system has never explicitly prohibited the private delivery of services.Footnote 2
Recent press reports suggest that there is growing public sentiment for greater private health care (Leong, Reference Leong2006). For example, in its August 2005 meeting, the Canadian Medical Association voted by a margin of almost two to one in favour of a resolution supporting private insurance for those medically necessary services that the public system fails to deliver in a timely fashion. Moreover, the Alberta government recently announced that it was interested in creating a private health insurance market but later backed away from the idea (Emery and Gerrits, Reference Emery and Gerrits2005; Baxter, Reference Baxter2006). And a study on Canadian attitudes to health care found Canadians becoming more resistant to the provision of collective medical services and expecting more individually tailored care. This resistance manifests itself in dissatisfaction with the health care system, although the approval rating of health system users is higher than that of the general population. When asked if they were satisfied with their provincial health system’s ability to meet their own needs, 79% of respondents said they were very/somewhat satisfied; however, only 59% said that they were very/somewhat satisfied with the system’s ability to meet the needs of all provincial residents (Mendelsohn, Reference Mendelsohn2002: 38).
More ominously, the proportion of Canadians who were unable to access needed health care services over the previous 12 months grew from 2% in 1989 to 15% in 2001. Indeed, the proportion of Canadians in a cross-national survey who felt that the health system needed only minor changes dropped from 56% to 20% between 1988 and 1998 and in 2001 stood at 21% (Blendon et al., Reference Blendon, Schoen, DesRoches, Osborn and Scoles2002). A 2005 health care survey by Pollara found eroding levels of faith in public treatment coinciding with growing awareness of private options (Agrell, Reference Agrell2005). The election of Brian Day, an advocate for a greater private role in health care, as president of the Canadian Medical Association, is another indicator of a shift in the Canadian health care debate.
Canada’s health care system: overview and data
The decentralized nature of the Canadian federation, in effect, makes its health system a set of centralized provincial systems combined with federal regulation and transfer funding. To receive federal health transfers, provinces must comply with the 1984 Canada Health Act requiring that administration of the public plan be carried out by a not-for-profit public authority. In addition, the Act requires that all medically necessary services by hospitals and physicians be insured, that coverage be universal and portable, and that there be reasonable and portable access to health care services irrespective of financial or other barriers.
The Canadian system has private provision as most physicians are in private practice but bill provincial health care plans for insured services. Essentially, physician and hospital services are nearly 100% publicly funded, while other categories vary in their degree of public funding. There is no national drug plan, though individual provinces have public plans for senior citizens and low-income individuals.
Meeting the Canada Health Act means that private health insurance is effectively illegal for services covered by the provincial insurance plans – placing Canada in the company of Cuba and North Korea in this respect. Private medical insurance is only available for services that are not readily available under the public plan, putting Canadians in the position of being able to buy private health insurance for their pets but not themselves.
The data used in this paper are from the Canadian Institute for Health Information and Statistics Canada’s CANSIM database (see Appendix A). Provincial and territorial government health expenditures are mainly earmarked for insured health services and extended health care and are funded by federal transfers as well as own source revenues. Private sector health care expenditures include expenditures from health insurance firms, out-of-pocket expenditures of individuals, and patient service revenue paid by private insurers for items such as private hospital rooms or charges for services that are deemed not medically necessary.
National health expenditure data are available by nine expenditure categories. These are: (1) hospitals, (2) other institutions, (3) physician expenditures, (4) other professional expenditures, (5) drugs, (6) capital expenditures, (7) public health, (8) administration, and (9) other expenditures. With the exception of public health, these categories contain both private and public health care expenditures (Canadian Institute for Health Information, 2005a, 2005b).
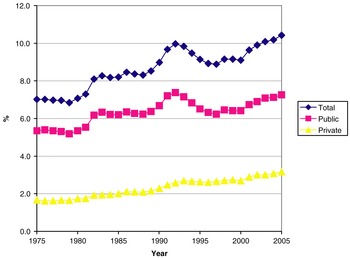
Figure 1 shows a decline in the public share of health care expenditure from 1975 to 1980, a brief recovery from 1981 to 1983, and then a continuous decline after 1983 with a leveling off after 1997. Figure 2 shows that between 1975 and 1992, the public health expenditure share of GDP rose from 5.3% to 7.4% while the private share rose from 1.7% to 2.6%. Between 1992 and 1997, the public share of health expenditure to GDP declined while the private share continued to rise. Since 1997, the public share of health expenditure to GDP rose from 6.2% to 7.3% while that for private expenditure rose from 2.7% to 3.2%. The public share of health spending also varies across provinces and there is growing divergence from 1975 to early the 1980s, a convergence between the mid-1980s and mid-1990s, and a resumption of divergence after the mid-1990s.
Public share of total health expenditure, 1975–2005 Source: Canadian Institute for Health Information 2005a, 2005b

Health expenditure to GDP ratio, 1975–2005 Source: Canadian Institute for Health Information 2005a, 2005b

Between 1975 and 1980, the public share of health expenditures rose in Quebec and Saskatchewan but dropped in Ontario, Newfoundland, and Prince Edward Island. In 1975, the public share of health expenditures across provinces ranged from 72% to 79%, whereas by 1980 it ranged from 61% to 81%. By 1985, the range was from 71% to 80%, in 1995 from 68% to 77%, and in 2005 from 67% to 76%. In 1975, the provinces with the largest public health spending share were Quebec, Nova Scotia, and Manitoba while the lowest were British Columbia, Prince Edward Island, and Saskatchewan. In 2005, the provinces with the largest public shares were Newfoundland, Saskatchewan, and Alberta while the lowest were Ontario, Nova Scotia, and New Brunswick (Canadian Institute for Health Information, 2005a).
Public health expenditure also varies across expenditure categories. For hospitals, there was decline from a high of 95% in 1975 to 92% in 2005 while other institutions saw an increase in the average provincial public share from 68% to 74%. The average provincial public share of physician expenditures remained relatively constant at about 98% while for other professionals it declined from 15% in 1975 to 9% by 2005. The average provincial public share of drug health expenditures rose from 17% in 1975 to 35% by 2005 while the share of capital health expenditures rose from 69% to 82%.
The public–private health debate
Privatization transfers ‘ownership of resources or enterprises from a collective, public basis to an individual private one’ with the balance rooted in the property rights over the resource allocation decision.Footnote 3 The public–private debate in health care has two aspects: it is a discussion in public economics and it is also an ideological debate between the proponents of a libertarian/market view versus an egalitarian/non-market view of health care provision. Indeed, the public–private debate may be ‘overblown’ and dominated by political rhetoric (Steinbrook, Reference Steinbrook2006: 1662).
Health care is a private good because individuals can be excluded from consumption for non-payment. However, asymmetric information and moral hazard give rise to potential market failures. This provides opportunities for government intervention in health care financing, provision, and regulation. The provision of centralized government health insurance provision creates expenditure controls that can reduce over-prescription of treatments and internalize positive externalities that would be foregone if provided solely through private arrangements.
Economic theory suggests that mixed systems of health care provision are a likely outcome, much like other publicly provided goods with privately available counterparts such as education and crime prevention. Marchand and Schroyen (Reference Marchand and Schroyen2005) argue that a mixed health care system may improve on a pure public system if earnings dispersion is large enough. Epple and Romano (Reference Epple and Romano1996a) suggest that a dual provision regime is preferred by a majority of the population, but such systems create a dilemma. They write: ‘On the one hand, the private alternative reduces the demand on the public system, thereby reducing its costs, to the benefit of users of the public system. On the other hand the loss of clientele to the private sector can be expected to reduce public support for a high quality public service’ (Epple and Romano, Reference Epple and Romano1996b: 298).Footnote 4
Advocates for a greater market role in health care argue that privatization fosters greater efficiency. Opponents of private care counter that ‘one of the main reasons for the observed differences is that governments tend to supply goods and services that are inherently more difficult to produce than those supplied by the private sector, hence the greater inefficiency’ (Stoddart and Labelle, Reference Stoddart and Labelle1985: 12). Culyer (Reference Culyer1983: 397) argues that: ‘The amount of health care expenditure in any country seems to be unrelated to the degree of governmental involvement in the financing or delivery of health services; instead, it can almost entirely be accounted for by differences in the various countries’ national income.’Footnote 5 While Williams (1988) notes that the proponents of private health care view health care as part of society’s reward system, public health care advocates argue such access is every citizen’s right. Ultimately, a mixed system is a compromise respecting minority views, whether that minority be public or private sector adherents.
In most democracies, changes in the public–private balance require voter coalition mobilization and therefore the debate becomes ideological.Footnote 6 Gouveia (1997) argues that with an OECD public share expenditure average of 75%, health care spending is the result of political decisions and not simply market forces. Moreover, ‘economists have not emphasized enough that the provision of health care by government is a political choice’ implying that a large public share is a policy choice (Gouveia, Reference Gouveia1997: 222).
Epple and Romano (1996b) demonstrate how under a dual public–private system of provision, an equilibrium exists whereby the rich and poor together prefer reduced public provision while the middle class prefers more. Extending their analysis to health, the rich prefer low public expenditures because they can access private care and dislike the high taxes required to extend public health care to others. The poor prefer lower public health care expenditures because they are less willing to substitute public health expenditures for other public goods such as income support. Middle-income households, on the other hand, use public health care and prefer it be of good quality. This suggests that changes in Canadian income distribution over time may affect the middle-class base of support for public health expenditures.
An examination of the Australian health care system argues that the existence of a prominent private system alongside the public system has resulted in greater consumer choice but less equity in elective surgery because the privately insured have faster access to treatment (Duckett, Reference Duckett2005). Moreover, the government rebate to consumers on their private health insurance premiums is a subsidy to the private health industry amounting to AU$2.14 billion (Duckett and Jackson, Reference Duckett and Jackson2000).Footnote 7 Devereaux et al. (2004) conclude that private for-profit hospitals result in higher payments for care than private not-for-profit-hospitals. Such studies have become the focus for a more politicized and ideological debate on the issue of public versus private health care (Naylor, Reference Naylor2002).
Estimation framework
In this analysis the empirical model to be estimated is of the form

where Dit is the public share of provincial health expenditures of the ith province at period t, Y it is the per capita income of the ith province at time t, and z 1 to z n represent a vector of social, demographic, economic, and policy variables which are determinants of D it.
Inclusion of per capita income is standard in health expenditure determinant studies with higher income associated with greater health care spending. However, the public share impact will depend on the size of the relative elasticities. For example, if private health expenditure is more income elastic than public spending, then rising incomes would be associated with a decline in the public share. The income variable (RGDPC) is defined as real per capita provincial Gross Domestic Product in 1997 Canadian dollars deflated using the Consumer Price Index.
Health care is a labour-intensive activity and if relative productivity is lower for health services, then medical care prices and costs can rise over time with inelastic demand for heath care. This is a manifestation of Baumol’s model of unbalanced sectoral growth in which low productivity sectors with inelastic demand have wage increases in excess of productivity growth (Baumol, Reference Baumol1967, Reference Baumol1993; Hartwig, Reference Hartwig2006; Newhouse, Reference Newhouse1992). To account for this, a relative price of health care variable (RPRICE) is specified as the ratio of the health care implicit price index (1997=100) to the consumer price index (1997=100).Footnote 8 The average relative price of health care across Canada’s provinces declined from 1975 to 1993 but has grown since.
The proportion of the population aged 65 and over (PROP65) is included and assumed to affect real per capita health expenditures positively (Denton and Spencer, Reference Denton and Spencer1975; Barer et al., Reference Barer, Pulcins, Evans, Hertzman, Lomas and Anderson1989 Waldo et al., Reference Waldo, Sonnefeld, McKusick and Arnett1989; Schrimper and Clark, Reference Schrimper and Clark1985; Denton and Spencer , Reference Denton and Spencer1983; Denton et al., Reference Denton, Neno Li, Spencer and Marshall1987; Denton and Spencer, Reference Denton and Spencer1995; Hogan and Hogan, Reference Hogan and Hogan2002). A Canadian report anticipates aging to account for approximately 21% of total expenditure growth (Provincial and Territorial Ministers of Health, August 2000). An additional complication of an aging population is the ‘cost-of-dying’, which suggests the imminent approach of death may be the more important cost driver.Footnote 9 This is taken into account by including as a variable the number of deaths in a province divided by the province’s population (DTHRATE). Those provinces with higher death rates may be experiencing different demands and stresses on both their public and private health expenditures.
Rising death rates can increase resource use but such use could save lives in the long run, thereby reducing future expenditures. As a result, the relationship between death rates and health expenditures could ultimately be positive or negative. The death rate is lagged for one period in order to allow for a more complex effect over time. A positive coefficient suggests that higher death rates generate more public spending relative to private spending and hence a larger public role. A negative coefficient suggests that increased resource use brought about by a rising death rate might reduce public sector spending in the longer term faster than private sector spending and hence bring about a declining public sector share. An additional demographic variable, the immigration rate – that is, the ratio of immigrants to the province’s population (IMMRATE) – is specified to capture any effects of this younger demographic on the balance between public and private spending.Footnote 10
A real per capita federal cash transfer variable (RNFCASHC) is constructed from general and specific cash transfers to capture the effect of transfer payments on health expenditures (see Appendix A). Federal cash transfers are important operating revenue sources for Canada’s provincial governments but vary across provinces and over time. Estimated federal transfers (cash and tax points)Footnote 11 to the provinces and territories in 2005–06 totalled approximately CAD$ 59 billion, of which 54% was specifically marked for health. However, general-purpose transfers like equalizationFootnote 12 can also be applied to health. It is difficult to separate out the extent of health transfers given the changes in transfer arrangements over time, both in dollar amounts as well as institutional arrangements. In addition, a variable to capture the onset of the Canada Health and Social Transfer (CHST) is specified.Footnote 13
Province dummies are included to capture time invariant regional effects not captured by other variables in the model. The Canadian federation is diverse and regional preferences may be at play as well as factors of culture, tax systems (Stabile, Reference Stabile2001), and geography in determining the level of public and private health expenditures.
Provincial political party variables are specified to account for any impact on the distribution of public sector health expenditures across provinces. Evidence relating political parties to the level of government expenditure in Canada has found little effect (Abizadeh and Gray, Reference Abizadeh and Gray1992). However, some political parties may be philosophically predisposed to either public or private health expenditures. The parties that have formed governments during this period are the Conservatives/Progressive Conservatives (PC), the Liberals (LIB), the Parti Quebecois (PQ), the Social Credit (SC), and the New Democratic Party (NDP). While Canadian political parties are generally not characterized by political extremes, the Conservatives, Liberals, and Social Credit can be seen as centre-right parties while the New Democrats and the Parti-Quebecois are centre-left.
A dummy variable was also included to capture the effect of the Canada Health Act in 1984 (CANHACT), which replaced the existing legislation under which federal grants for health care in Canada had been paid, namely, the Hospital Insurance and Diagnostic Services Act and the Medical Care Act. The federal government attempted to establish more precise conditions under which provincial health programs qualified for federal transfer assistance. This was done to address the tendency of some provinces in the early 1980s to allow special charges to patients. The Canada Health Act was supposed to ensure that medically necessary health services (in essence, hospital and physician services) were available to all residents of Canada regardless of financial circumstance and was portrayed by the federal government as a strengthening of public health care. Provinces that apply user charges or extra fees that contravene the Canada Health Act can have a financial penalty applied to their federal government grant.
A time trend (YEAR) accounts for the expenditure impact of technological change. However, modelling the impact of technological extension on health care spending is a complicated issue.Footnote 14 If new techniques generate cheaper health procedures, there should be expenditure reductions associated with technological change. Cutler et al. (Reference Cutler, McClellan, Newhouse and Remler1998) report that between 1983 and 1994, the real quality-adjusted price of heart attack treatments declined at an annual rate of 1.1%. At the same time, with expensive new treatments, technological change can be associated with rising health expenditures. Given that technological change occurs over time, a time index is a logical way to control for the effect of technological change on health expenditures.
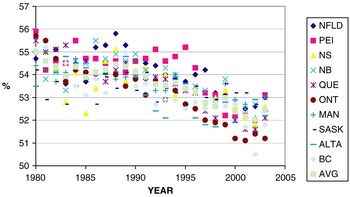
To test the Epple-Romano hypothesis that middle-income households prefer higher public health expenditures whereas high and low-income households prefer a reduction, a set of income distribution variables was specified. The distribution of families by after-tax income groups in 2002 Canadian dollars shows that between 1980 and 2003, the average provincial income share of top quintile families rose from 39.9% to 42.3%. The average share of the three middle quintiles declined from 50.3% to 49.6% (see Figure 3) while the average share of the lowest quintile rose slightly from 5.1% to 5.3%. The proportion of after-tax income held by the middle three quintiles of all family units (QMID) is included as the income distribution variable but it is only available for the period 1980–2003.
Income share of three middle quintiles of Canadian families 1980–2003 Source: Statistics Canada, CANSIM (See Appendix A, Income distribution). Key: Newfoundland-NFLD, Prince Edward Island-PEI, Nova Scotia-NS, New Brunswick, NB, Quebec-QUE, Ontario-ONT, Manitoba-MAN, Saskatchewan-SASK, Alberta-ALTA, British Columbia-BC, Average-AVG.

Finally, this estimation assumes that public–private health expenditures are independent of one another given that health care financing is sectoral in the Canadian context (Tuohy et al., Reference Tuohy, Flood and Stabile2004: 361). Hospital and physician services are almost entirely publicly financed while in other sectors the budgeting process is such that governments are not actively reacting to the private sector in making resource allocation decisions. Privatization can sometimes be interpreted as ‘passive privatization’ whereby technology driven shifts of services occur across different expenditure sectors and indirectly affect the public–private balance as opposed to a reactive relationship between public and private health funding.Footnote 15
Results
The public share of health expenditure regressions are estimated for total health expenditures and separate expenditure categories using SHAZAM 8.0.Footnote 16 The model specification is log-log so the coefficients are interpreted as elasticities with elasticity defined as the percentage response of a given variable to a percentage change in another variable. The estimation technique is a pooled times-series cross-section with annual data from 1975 to 2005.
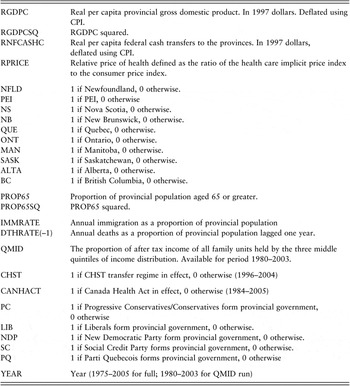
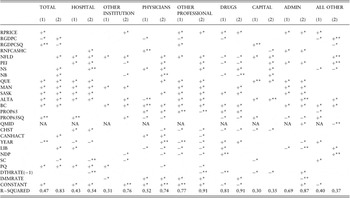
The independent variables are defined in Table 1 and simplified results presented in Table 2. In Table 2, the first column for each category is for the period 1975–2005 and excludes the income distribution variable while the second column is for the period 1980–2003 and includes it. The pooling technique is that of Kmenta (1986) for data that are cross-sectionally heteroskedastic and time-wise autoregressive with the constant slope coefficients assumption and the assumption of cross-sectional dependence in the error terms. All significances are at the 5% level unless otherwise stated.
Variable definitions

Sources: See Appendix A.
Public share determinants: regression results

SAMPLE RANGE: (1) 1975–2005 – no QMID (2) 1980–2003 – includes QMID
ESTIMATION TECHNIQUE: POOLED TIME SERIES CROSS-SECTION
MODEL SPECIFICATION: LOG-LOG; SIGNIFICANCES: *5% LEVEL; **10% LEVEL
NA–Not applicable.
The results with and without income distribution (QMID) parallel each other in terms of sign. The variable RPRICE is often positive for total health, other institutions, other professionals, drugs, administration, and all other health spending, suggesting that, as the relative price of health care rises, public health expenditures tend to rise faster than private ones, thereby increasing the public share. Given that health care is labour intensive, this implies that public sector health care is more labour intensive than private sector care. From a policy perspective, this may also imply that rising health care costs in Canada in the future may create a larger public sector role as the public seeks to shift more expensive labour-intensive services on to the public insurer rather than pay out of pocket.
The results for income (RGDPC) suggest that the explanatory variables vary in their effect across expenditure categories and specifications. For the non-QMID specification, income is negatively related to the public share for total health spending, physicians, drugs, and all other health expenditures, suggesting that private health spending is more responsive to income than public. In addition, there is a u-shaped relationship between income and the public share of other professional health expenditures, suggesting that public spending in this category rises more slowly than private spending as income rises at low-income levels but then rises more quickly at higher-income levels. For specifications with QMID, there is a significant inverse u-shaped relationship between income and the public share of total health expenditures, suggesting that public spending is more sensitive to income than private spending at low-income levels but reverses as income rises.
These results suggest that if income rises sufficiently, private health expenditures will ultimately rise faster than public spending. Income is negatively related to the public share for total health spending, physicians, drugs, and all other health expenditures. Where there is an inverse u-shaped relationship – as in the case for total health spending in the QMID specification – the inflection point suggests that private spending will also eventually increase faster than public spending in response to rising income.
Between 1975 and 2005, average real per capita GDP (1997 dollars) across Canada’s ten provinces rose from CAD$ 23,022 to $34,041. Based on the inflection point in the quadratic coefficient estimates for total health expenditure (QMID specification), the public share peaks at a real per capita GDP of just over 34,000 dollars. Thus, it would appear that private spending is poised to become more income elastic than public spending. As for other professional health spending – which had a u-shaped income profile in the non-QMID specification – the minimum point occurs at a real per capita GDP of approximately 63,000 dollars. Therefore, the public share should continue to decline for this category for some time to come.
Real per capita federal cash transfers are positive and significant for at least one of the specifications for hospitals and administration, and positive and significant at the 10% level for physicians. Federal health transfers are primarily for hospital and physician expenditures and recent transfer increases to the provinces have bolstered the public share of spending in those categories. However, real per capita federal transfers are negatively related to the public share of capital expenditures. The mechanism driving this result is unclear but it could be that increases in transfer funding mainly benefit areas covered by the Canada Health Act whereas capital projects are not. Perhaps more federal money for physicians and hospitals would provide an incentive for provinces to under-invest in capital projects.
With Ontario as the omitted province category, for total health spending, the public share is significantly higher than Ontario for many provinces. Only Prince Edward Island is not significantly different from Ontario. In the other expenditure categories, most provinces again have a significantly larger public share than Ontario. A difference emerges in the physician category where Alberta is negative and significant at the 10% level. Differences also occur in the other institution category where New Brunswick has a significantly lower public share relative to Ontario when the QMID specification is used. In the drugs category, Newfoundland and Prince Edward Island are significantly lower than Ontario while in the all other health expenditure category it is Nova Scotia that is significantly lower.
The PROP65 variable exhibits a significant inverse u-shaped relationship for physicians and drugs. For these categories, as the proportion of population aged 65 and over rises, public spending first increases faster than private spending, then the reverse sets in. For drugs in the specification without QMID, when the proportion of population aged 65 and over is below 11%, it would appear that public drug spending rises faster than private drug spending. Once the proportion exceeds 11%, private drug spending rises faster. This may be indicative of the rising cost of public drug plans as the population ages and an incentive towards a larger private role. For the specification with QMID, the critical proportion is at approximately 10%. In addition, there is a negative relationship between an aging population and the public share of spending for administration and all other health expenditures. This suggests an aging population can have a differential impact on the public share across expenditure categories.
The proportion of income held by the three middle quintiles is a significant and positive determinant of the public share only for administration spending. It is negative and significant at the 10% level only for all other health spending. The lack of significance of QMID for categories such as drugs, hospitals, or physicians suggests that Epple-Romano mechanism of ‘ends against the middle’ is not in evidence. The increase in income inequality over time does not appear to have had a major impact on the public share of total health spending, although the middle income classes favour more public health administration spending.
The onset of the Canada Health and Social Transfer (CHST) in the non-QMID specification is negatively and significantly related to the public share of drug expenditures and other professional expenditures, and positively and significantly related to the hospital public share. In the QMID specification, it is negatively and significantly related to the public share of physician, other professional, drugs and capital spending and positively and significantly related to hospital spending. As for the Canada Health Act (CANHACT), its existence is positively and significantly related to the public share of total health expenditures and physician expenditures. It is negatively related to the public share of other professional expenditures, suggesting that these expenditures were not as medically necessary, bearing the brunt of provincial health expenditure reductions. The Canada Health Act appears to have helped maintain the public share of total health expenditures and, in particular, physician expenditures.
There is a significant downward time trend in the public share of total health spending (at the 10% level), hospital expenditures, other professional expenditures, and administration and a significant upward trend for drugs and all other health expenditures. This suggests the trend towards privatization is strongest in the hospital, other professional, and administration categories and that these categories contribute the most to the declining public share in total health expenditures. At the same time, the spread of public drug plans over the last two decades has counteracted the trend towards private health spending. If time can be said to capture ‘passive privatization’ for total health expenditures, hospital spending, and other professional spending, then for drugs, technological change and the onset of new treatments are bringing about ‘passive publicization’. Moreover, there may also be some ‘passive’ publicization underway for the all other health expenditures category.
With Conservatives as the omitted reference category, provinces with Liberal or New Democratic governments are associated with a significantly smaller public share of health spending for physicians and other health professionals. Depending on the specification used, there is some positive impact for Liberals with total health expenditures, hospitals, drugs and all other health spending. The New Democrats have a positive and significant relationship at the 10% level with the public share in the all other health spending and drugs. Provinces with a Social Credit government have a smaller public share in several categories relative to the Conservatives. The Parti Quebecois is associated with a significantly larger public share relative to Conservatives for total health spending, hospitals, and other institutions and a smaller public share when it comes to physician spending and other professionals. While centre-left parties are more supportive of public health care, they lean towards smaller public shares of health spending for health professionals.
The additional demographic variables also have some impact. The death rate lagged one period (DTHRATE(–1)) has a negative effect for hospitals, other professionals, drugs, capital, and all other health spending. This suggests that for these categories a rise in death rates leads to a short-term increase in resource use that ultimately may reduce public sector health care spending relative to private spending in the longer term. At the same time, increases in the death rate are associated with a larger public share in the administration category. On the other hand, provinces with higher immigration rates (IMMRATE) are associated with larger public shares for physician, other professional and drug expenditures but a lower public share for other institutional health spending.
Finally, in terms of economic significance, most of the coefficients are quite inelastic – well below one-tenth of 1%. Notable exceptions across expenditure categories are the relative price of health care, the age variables, and the lagged death rate. The impact of RPRICE is larger in the public share of drug expenditures suggesting that a 1% rise in the relative price of health care raises the public share of drug expenditures by four-tenths of 1%. With the public share of total health expenditures (No QMID specification), a 1% increase in the proportion of population aged 65 and over results in 1.6% decrease in the public share of health spending while 1% increase in the death rate lagged one year yields a 1.9% decline. However, these coefficients were also not statistically significant. The proportion of population over age 65 also has a large, positive, and significant impact of the public share of drug and physician spending.
Conclusion
An examination of the public–private split in health care expenditures in Canada finds variation across provinces and expenditure categories that is masked by the usual emphasis on the overall national split. Despite the overall decline in the public share of health spending, categories such as physicians have stayed constant while drugs, all other health spending, and capital spending have seen increases in the public share.
Significant determinants of the public share include the relative price of health care, per capita income, federal cash transfer variables, the proportion of population over age 65, provincial dummy variables, political parties, the onset of the Canada Health Act and the CHST, and a time trend denoting technological change. With the exception of the relative price of health care, the proportion of population over age 65 and the death rate, these variables are quite inelastic in their effect on the public share of health expenditures.
As the relative price of health care rises, public health expenditures rise faster than private ones, resulting in an increasing public share of health care funding. For many expenditure categories, private health spending is more responsive to income than public spending, suggesting that rising incomes should foster a shift towards a smaller public role in health spending over time. The increasing inequality of income distribution is not a factor eroding the public share for most categories of health spending and indeed is associated with a larger public share for the administration category.
The significance of federal transfers suggests that the increase in the private share of health spending is partly the result of explicit policy choices. This is reinforced by the significance of provincial and political dummy variables reflecting regional and ideological differences brought about by the reality that in Canada health is under separate provincial jurisdictions. Ontario exhibits the greatest tendency towards private health care and center-left parties correlate with smaller public shares for spending on health professionals and larger shares for total health spending.
The negative time trend in the public share of several expenditure categories can be interpreted as ‘passive privatization’ from compositional effects caused by technological change. It could also capture a policy shift towards greater privatization. At the same time, a positive time trend for the public share of drug spending and all other health expenditures implies that technological change and the onset of new treatments is bringing about ‘passive publicization’ in these areas.
These results suggest that the determinants of the public–private balance are complex. Most popular discussion of the issue is simplistic as the decline in the total public share masks the variation across provinces and expenditure categories. The decline in the public share of total health spending is driven by declines in the hospital and other professional health expenditure categories. However, drugs and the all other health expenditure category have seen public share increases as demand for new drugs and services such as home care, have pressured governments into boosting public spending in these areas.
Money for more public spending in one category can only come from another, and, when combined with changing technology and practices, helps to explain the decline in the overall public share. The willingness to tolerate this decline, in turn, can be related to shifting political preferences and policies. The Canada Health Act is a policy action that helped maintain the public share in total health spending, especially via its impact on physician spending.
Ultimately, the public–private balance is as much a social policy choice as it is the outcome of economic fundamentals, reinforcing the view that public provision of health care is ultimately a political choice. Given that over 30 years the overall share of private funding of health care in Canada has only declined from approximately 76% to 70%, it would appear that the move towards private care is one of marginal increments rather than fundamental shifts. Moreover, it involves a rebalancing of public–private preferences across expenditure categories with a willingness to accept a greater private share in hospitals and other professionals, maintenance of the share for physicians, and a smaller private share for drugs.
Canadians seem ambiguous about their health care system as they appear willing to tolerate only marginal accretions in the overall private share of health spending but larger changes across individual health expenditure categories and provincial systems. Borrowing from Prime Minister Mackenzie King in Canada it would appear to be a case of more privatization if necessary, but not necessarily more privatization.
Acknowledgements
The author thanks Byron Spencer, Stuart Mestalman, Jim Johnson, Mike Veall and participants at a McMaster University seminar presentation for their comments on an earlier draft of this paper. The helpful comments of two anonymous referees and financial assistance from the Social Sciences and Humanities Research Council are also gratefully acknowledged.
Supplementary data
For supplementary data, please see www.journals.cambridge.org/hep
Appendix A: Data sources
Health Expenditure Data, Consumer Price Index, Health Care Implicit Price Index, Population, Provincial GDP (1981–2005): Source, CIHI, National Health Expenditures 2005.
Federal Cash Transfers: CANSIM 1961–1989: D13238, D13258, D13278, D13298, D13318, D13338, D13358, D13378, D13398, D13418 1989–2005: V206512, v206513, V206577, V206578, V206642, V206643, V206707, V206708, V206772, V206773, V206837, V206838, V206902, V206903, V206967, V206968, V207032, V207033, V207097. V207098
Population Aged 65 and Over: Source, CANSIM
V467001, V467316, V467631, V467946, V468261, V468576, V468891, V469206, V469521, V469836
Provincial GDP 1975–1980: CANSIM
V123650, V123662, V123674, V123686, V123698, V123985, V123722, V123734, V123746, V508978.
Income Distribution: CANSIM
Share of After Tax Income by all family units, top and bottom quintiles.
V25742171 V25742207 V25742243 V25742279 V25742315 V25742351 V25742423 V25742459 V25742495 V25742531
V25742175 V25742211 V25742247 V25742283 V25742319 V25742355 V25742427 V25742463 V25742499 V25742535
Immigration: CANSIM
Quarterly Immigrants to Province
V29850347 V29850352 V29850357 V29850362 V29850367 V29850372 V29850377 V29850382 V29850387 V29850392
Deaths: CANSIM
Quarterly Provincial Deaths
V78 V79 V84 V85 V86 V87 V88 V89 V90 V91