I. INTRODUCTION
In recent years, various severe plastic deformation (SPD) techniques have been widely used to refine the grains of metallic materials to the submicrometer and nanometer range. Reference Valiev and Alexandrov1 The two SPD processing techniques of high-pressure torsion (HPT) Reference Zhilyaev, Lee, Nurislamova, Valiev and Langdon2 and equal-channel angular pressing (ECAP) Reference Segal3 have drawn considerable attention for their effective production of bulk ultrafine grained (UFG)/nanostructured (NS) materials. It is known that processing via HPT has advantages over other SPD techniques because it produces a microstructure with much smaller grains, higher defect density, and a higher fraction of high-angle grain boundaries (HAGBs) as a result of its more severe plastic torsional strain. Reference Stráská, Janeček, Gubicza, Krajňák, Yoon and Kim4,Reference Wongsa-Ngam, Kawasaki and Langdon5 It is generally assumed that the imposed strain varies across the sample processed via HPT. The shear strain in the center of the disk is ideally zero, and the strain increases with increasing distance from the disk center. Reference Zhilyaev, Lee, Nurislamova, Valiev and Langdon2 However, research has demonstrated that the inhomogeneity, including the center and edge regions along the radius of the sample, decreases with increases in the number of turns and, thus, with increases in the amount of strain. Reference Bazarnik, Huang, Lewandowska and Langdon6 Generally, it has been found that the microstructure evolves into a homogeneous condition after five turns. Reference Xu, Horita and Langdon7
The amount of plastic strain during the deformation is significant in affecting the microstructural evolution and deformation behavior of UFG/NS materials processed via SPD. Increasing the ECAP pass number from 2 to 6 leads Mg alloys to have lower yield stress and higher ductility because of texture softening overcoming the grain refinement strengthening. Reference Akbaripanah, Fereshteh-Saniee, Mahmudi and Kim8 The hardness of Zn–22%Al eutectoid alloy processed via HPT is below that of the alloy in an annealed condition, showing significant softening, namely strain weakening. Meanwhile, the hardness decreases significantly with increasing strain, and then reaches a saturated value due to the removal of precipitates during HPT. Reference Kawasaki, Ahn and Langdon9,Reference Cho, Lee, Ahn, Kawasaki and Langdon10 Instead, it has been reported that an increase in the plastic strain results in decreasing grain size and increasing dislocation and twin densities, thus increasing the hardness of the metals. Reference Zhao, Horita, Langdon and Zhu11 Recent research results have shown that the variation of hardness with strain tends to rely on the degree of recovery in materials and the microstructural change such as the absorption of precipitation. Reference Kawasaki, Ahn and Langdon9,Reference Kawasaki12 Most metals exhibit strain hardening without recovery in the initial stage of plastic deformation. The hardness of metals increases and ultimately stabilizes at a saturation value with further increasing plastic strain because the dislocation generation is balanced by the dislocation absorption. Reference Kawasaki, Ahn and Langdon9,Reference Tian, Li, Zhang, Wu, Zhang, Kawasaki and Langdon13 For a material with a lower stacking fault energy (SFE), the saturation strain is significantly higher than that of a material with a relatively higher SFE. Reference Xu, Horita and Langdon7 Furthermore, the hardness of a material with a very high SFE such as high-purity Al even exhibits an initial increase, a subsequent decrease, and eventually reducing to a saturated value because of rapid recovery through processes such as cross-slip, which is termed softening with rapid recovery. Reference Kawasaki12,Reference Harai, Ito and Horita14 In contrast, low-purity Al Reference Zhilyaev, Oh-ishi, Langdon and McNelley15 and Al-based alloys Reference Bazarnik, Huang, Lewandowska and Langdon6 exhibited strain hardening with an ultimate saturation point. It has been reported that pure aluminum exhibited softening mainly by dynamic recrystallization and recovery, while no appreciable dynamic softening was observed in pure copper when imparting large strains. Reference Edalati, Horita, Furuta and Kuramoto16 However, for the oxygen free high conductivity (OFHC) Cu processed by repetitive upsetting-extrusion, the microhardness was found to initially increase, reach a peak and then decrease to a steady-state level with increasing equivalent strain. Reference Balasundar, Ravi and Raghu17 In addition, the microhardness of the ultrahigh purity OFHC Cu initially increased, then decreased and thereafter increased again to a saturated value during HPT process because of dynamic recrystallization. Reference Almazrouee, Al-Fadhalah, Alhajeri and Langdon18 In general, the variation of microstructure and mechanical properties with strain is strongly dependent on the material parameters, such as the chemical composition and SFE. Reference Astafurova, Tukeeva, Maier, Melnikov and Maier19
Furthermore, the SFE has a critical function in determining the deformation mechanisms and mechanical properties of the face centered cubic (FCC) metals processed via SPD. Fine grain size, high dislocation density, and high twin density can be achieved during SPD through reducing the SFE of the metals. Reference Zhao, Horita, Langdon and Zhu11,Reference Balogh, Ungár, Zhao, Zhu, Horita, Xu and Langdon20 It is known that tailoring the SFE is an effective approach to obtaining high strength and good ductility in alloys through the presence of high-density twins during the SPD processes. Reference Zhao, Zhu, Liao, Horita and Langdon21–Reference Bahmanpour, Kauffmann, Khoshkhoo, Youssef, Mula, Freudenberger, Eckert, Scattergood and Koch23
In this study, a series of Cu and Cu–Ge alloy plates with different SFEs (8–78 mJ/m2) were produced using rolling and HPT from the same initial thickness to the same final thickness. The objectives of this study are twofold: first, to explore the relationship between the microstructural evolution, mechanical properties, and plastic strain in materials with different SFEs, and second, to investigate the mechanisms that contribute to hardening and softening induced by plastic strain for the SPD-processed samples.
II. MATERIALS AND METHODS
The materials used in this study were commercially pure Cu (99.9% purity) with an SFE of 78 mJ/m2 and Cu–Ge alloys (Cu–0.1Ge, Cu–5.7Ge, and Cu–9.0Ge, in at.%) with SFEs of 54, 15, and 8 mJ/m2, respectively. Reference Vinogradov, Merson, Patlan and Hashimoto24,Reference Gallagher25 The Cu and Cu alloy plates with ∼7 mm thickness were produced via induction melting and annealing at 700 °C for 4 h to obtain homogeneous microstructures. One group of samples was rolled at room temperature (RT, ∼293 K) into thin ribbons with a thickness of ∼0.2 mm [referred to as the rolling at room temperature (RTR) samples]; the other group of samples was initially rolled at RT to a thickness of ∼0.95 mm, then processed via HPT at RT to a thickness of ∼0.6 mm, and finally rolled at RT to a thickness of ∼0.2 mm (referred to as the HPT + RTR samples). For the HPT process, the plates were sliced into disks with diameters of 20 mm and thicknesses of ∼0.95 mm. Then, the disks were placed between a stationary upper anvil and a rotating lower anvil and HPT processed at RT using an imposed pressure of 2.5 GPa for six rotations. The HPT disks were subjected to high pressure and torsional straining. To remove the rolling microstructure and obtain coarse-grained (CG) samples with an approximately random distribution of grain orientations for comparison, some RTR samples were annealed at 800 °C for 8 h under a vacuum and then slowly cooled down in the furnace. The chemical compositions of the Cu alloys were analyzed using scanning electron microscope equipped with energy dispersive spectroscopy (EDS) detector.
Two types of samples were cut and polished into tensile testing specimens with gauge dimensions of 18 × 5 mm2 and 12 × 2 mm2 for the RTR and HPT + RTR samples, respectively. Uniaxial tensile tests were performed at RT using a Shimazu AG-X universal material testing machine (Shimazdu Corp., Kyoto, Japan) with a constant strain rate of 1.0 × 10⁻⁴ s−1. The mechanical behavior of the UFG/NS Cu alloy was compared with that of the as-annealed CG alloy with the same Ge composition. The tensile tests were conducted three times for each sample to ensure the reproducibility of the stress–strain curves.
The x-ray diffraction (XRD) experiments were conducted using a Rigaku D/max–3B X-ray diffractometer (Rigaku Corp., Tokyo, Japan) equipped with a graphite monochromator using Cu Kα radiation operating at 40 kV and 200 mA. The divergence slit angle and antiscattering slit angle were set at 0.5° and 0.5°, respectively, and the width of the receiving slit was 0.15 mm. The microstructures of the UFG/NS materials including the average grain size, microstrain, dislocation density, and planar defects, particularly the stacking faults and twin boundaries were determined using x-ray peak profile analyses. The instrumental broadening must be extracted in advance using a silicon standard sample. The microstructural parameters calculated via the XRD were averaged for the entire sample.
The as-annealed CG samples were ground with water-proof abrasive papers and then mechanically polished. The original microstructures of the samples in the annealed condition were subsequently observed by the optical microscope. The processed Cu–9.0Ge specimens for microstructure investigations were ground to a thickness of ∼100 μm, mechanically polished, and punched to small discs with 3 mm diameters. The discs were finally thinned by a twin-jet electrochemical polishing system using a solution of 25% CH3CH2OH, 25% H3PO4, and 50% H2O at a temperature of 23 °C with an applied voltage of 11.5 V. The microstructural observations were performed using an FEI Tecnai G2 TF30 S-Twin high-resolution transmission electron microscope (TEM; FEI Company, Hillsboro, Oregon) at an accelerating voltage of 300 kV. It is worth noting that the HPT + RTR specimens for tensile tests, XRD measurements, and TEM observations were cut at the mid-radius of the disks.
III. RESULTS
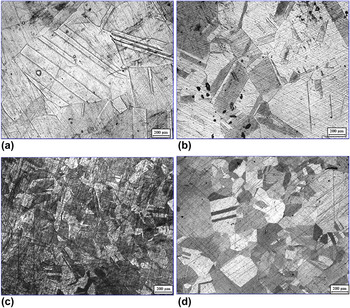
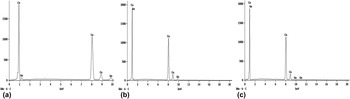
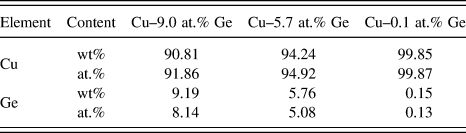
The initial microstructures of the Cu and Cu–Ge alloys after annealing at 800 °C for 8 h were observed using optical microscope, as shown in Fig. 1. The microstructures of the as-annealed CG samples consisted of large grains with sizes from dozens to hundreds of microns. In addition, some annealing twins with orientations varying from grain to grain can be observed. The chemical analyses with weight fractions (wt%) and atom fractions (at.%) of alloying element in the Cu alloys measured using EDS are shown in Fig. 2 and Table I. It can be seen that the actual chemical composition was basically in accordance with the expectation value.
Optical micrographs of the samples in the annealed condition: (a) Cu–9.0Ge, (b) Cu–5.7Ge, (c) Cu–0.1Ge, and (d) pure Cu. 74.0 mm × 80.0 mm (300 DPI × 300 DPI).

The chemical analyses using EDS (a) Cu–9.0 at.% Ge, (b) Cu–5.7 at.% Ge and (c) Cu–0.1 at.% Ge. 33.0 mm × 116.0 mm (1200 DPI × 1200 DPI).

The chemical analyses with weight fractions and atom fractions of the alloys.

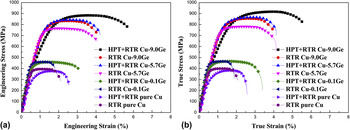
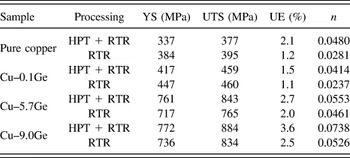
The engineering stress–strain curves and the true stress–strain curves of the Cu and Cu alloys processed via RTR and HPT + RTR are presented in Fig. 3. Several characteristic parameters of tensile tests, such as yield strength (YS), ultimate tensile strength (UTS), uniform elongation (UE), and work hardening exponent (n) of the HPT + RTR and RTR samples are summarized in Table II. The work hardening exponent (n) can be determined by fitting the Hollomon equation σ = Kε n to the uniform plastic deformation section of the true stress (σ)–true strain (ε) curves, where K is the strength coefficient. It is evident that the deformed materials exhibited significantly higher strength and lower tensile ductility compared with their annealed counterparts, which agree with the results reported previously. Reference Koch, Morris, Lu and Inoue26 The n values of the deformed samples are approximately one order of magnitude lower than those for the initial CG state, which is attributed to the limited dislocation storage of the processed samples owing to the microstructural refinement and high density of defects introduced during deformation. The elongation is extremely low in contrast to the CG sample due to a deterioration in the strain-hardening ability.
(a) Engineering stress–strain curves and (b) true stress–strain curves of Cu–Ge alloys. 36.7 mm × 96.8 mm (1200 DPI × 1200 DPI).

YS, UTS, UE, and work hardening exponent (n) of the HPT + RTR and RTR samples.

It can be seen that the strength of YS and UTS and ductility of the uniform elongation increased simultaneously with decreases in the SFE for the HPT + RTR and RTR samples. Furthermore, it is apparent that the mechanical properties of the HPT + RTR samples are superior to those of the RTR samples. The effect of plastic strain on the strength varied with the amount of SFE and solute concentration. For pure Cu and Cu–0.1Ge with medium SFEs, the strength of the HPT + RTR samples was slightly lower than that of the RTR samples. In contrast, for Cu–5.7Ge and Cu–9.0Ge alloys with low SFEs, the additional processing via HPT enabled higher strength. Moreover, the ductility of the HPT + RTR samples was better than that of the RTR samples.
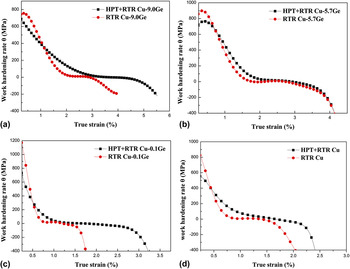
Figure 4 compares the relationships between the work hardening rate (θ) and the true strain for the samples processed using the two different methods of RTR and HPT + RTR. The work hardening rate (θ), which is the slope of the stress–strain curve, is calculated as follows:
 $$\theta = \left( {{{\partial \sigma } \mathord{\left/ {\vphantom {{\partial \sigma } {\partial \varepsilon }}} \right. \kern-\nulldelimiterspace} {\partial \varepsilon }}} \right)_{\dot \varepsilon } \quad ,$$
where σ is the true stress and ε is the true strain. Figure 4 indicates that the HPT + RTR samples had a higher strain-hardening rate in contrast with the RTR samples, which is consistent with the higher ductility in the HPT + RTR samples. It is also seen that the uniform elongation and elongation-to-failure were higher in the HPT + RTR samples than in the RTR samples.
Work hardening rate against the true strain of (a) Cu–9.0Ge, (b) Cu–5.7Ge, (c) Cu–0.1Ge, and (d) pure Cu. 88.9 mm × 67.6 mm (1200 DPI ×1200 DPI).

It is known that the two primary crystal parameters of crystallite size and lattice distortion cause XRD peak broadening after the instrumental broadening is calibrated using the standard sample. Accordingly, the lattice microstrain and grain size in the UFG/NS materials can be obtained through measuring the deviation of the line profile from the perfect crystal diffraction. It is assumed that the grain sizes determined using the XRD correspond to the average of the smallest undistorted regions because the coherency of the x-ray scattering is broken by the dislocation cell wall. For the UFG/NS materials produced using various modes of SPD, the crystallite sizes measured using the diffraction peak broadening are essentially identical to the dislocation cells or subgrain sizes, which are smaller than the grain sizes measured using the TEM. Reference Balogh, Ungár, Zhao, Zhu, Horita, Xu and Langdon20,Reference Ungár27 Moreover, if the grain size values of various materials are calculated using the XRD in the same conditions, they can be compared with each other.
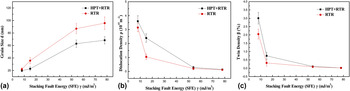
The microstructural parameters obtained from the XRD analyses are presented in Fig. 5. As shown in Fig. 5(a), for both the HPT + RTR and RTR samples, a decrease in the SFE resulted in a decrease in the average crystalline size. In addition, the grain sizes of the HPT + RTR samples are smaller than those of the RTR samples. It can also be seen that the HPT process causes additional grain refinement due to more plastic strain, and this refinement weakens with decreases in the SFE.
Variation of (a) grain size d, (b) dislocation density ρ, and (c) twin density β with SFE in the HPT + RTR and RTR processed Cu and Cu alloys. 100.0 mm × 26.1 mm (1200 DPI ×1200 DPI).

The dislocation density (ρ) is calculated from grain size (d XRD) and microstrain (<ε2>1/2) using the following equation: Reference Zhao, Liao, Jin, Valiev and Zhu28,Reference Williamson and Smallman29
 $$\rho = {{2\sqrt 3 \left( {\varepsilon ^2 } \right)^{1/2} } \over {d_{{\rm{XRD}}} b}}\quad ,$$
where b is the absolute value of the Burgers vector. For FCC metals,
 $b = \left( {{{\sqrt 2 } \mathord{\left/ {\vphantom {{\sqrt 2 } 2}} \right. \kern-\nulldelimiterspace} 2}} \right)a$
and a is the lattice parameter. The twin density (β), which is defined as the probability of finding a twin boundary between any two neighboring {111} planes, is calculated as follows:
Reference Zhao, Horita, Langdon and Zhu11,Reference Wagner30
 $$\beta = {{\Delta C\!\cdot\! G\cdot\!\!{{\left( {2\theta } \right)}_{111}} - \Delta C\!\cdot\! G\cdot\!\!{{\left( {2\theta } \right)}_{200}}} \over {11\,\tan \,{\theta _{111}} + 14.6\,\tan \,{\theta _{200}}}}\quad ,$$
where ΔC·G·(2θ)111 and ΔC·G·(2θ)200 are the angular deviations of the gravity center from the peak maximum of the {111} and {200} diffraction peaks, respectively. It is considered that the XRD peak asymmetry is caused by both twinning and other microstructural aspects. Reference Ungár31 Therefore, the twin density calculated in Eq. (3) is a simple estimation for qualitative analysis. However, the twin density measured using this method can reveal the general evolution trend of the twin density during the plastic deformation.
As shown in Figs. 5(b) and 5(c), a decrease in the SFE resulted in an increase in both dislocation density (ρ) and twin density (β) for the HPT + RTR and RTR samples. For the Cu and Cu–0.1Ge alloy with medium SFEs, the difference in the dislocation and twin densities between the two processing methods of HPT + RTR and RTR was less noticeable. In contrast, for the Cu–5.7Ge and Cu–9.0Ge alloys with lower SFEs, the dislocation and twin densities of the HPT + RTR samples were significantly higher than those of the RTR samples. That is, the dislocation and twin densities of the low-SFE alloys increased, while those of the medium-SFE materials remained basically unchanged after the HPT process. Moreover, the increment of the twin density caused by the additional HPT process became more apparent with decreases in the SFE. In general, the effect of the plastic strain on the microstructures of the materials processed using SPD varies with the amount of SFE and solute concentration.
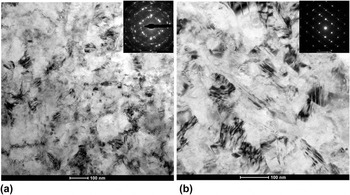
Figure 6 exhibits the TEM bright-field images and the corresponding selected-area electron diffraction (SAED) patterns of the HPT + RTR and RTR samples of Cu–9.0Ge alloy. It can be seen in Fig. 6(a) that fine grains have already formed after the RTR process. The grain sizes of the RTR processed Cu–9.0Ge alloy varied in a range of 25–140 nm, with an average value of 56 nm, which were determined using a large number of TEM micrographs. The associated SAED pattern shows the presence of many subgrains with low-angle grain boundaries and small grains with multiple orientations. As shown in Fig. 6(b), the grain size decreased slightly after the additional HPT process. That is, the grain refinement was well developed during rolling. The grain sizes of the HPT + RTR Cu–9.0Ge alloy ranged from 18 to 108 nm, with a mean value of 44 nm. Furthermore, the dislocation density increased slightly due to the imposed strain by HPT process. It should be noted that more twins can be seen in Fig. 6(b) than in Fig. 6(a), indicating the formation of profuse thin twins in the form of bundles during the HPT process, which can be confirmed by the corresponding SAED pattern. In the early stage of plastic deformation, dislocation glide and dislocation multiplication are the main deformation mechanisms. With increasing the plastic strain, mechanical twinning becomes more pronounced in the plastic deformation. It can be seen that profuse deformation twins with a thickness far below 100 nm are parallel to each other in the HPT + RTR sample.
TEM micrographs and corresponding SAED patterns of Cu–9.0Ge after different processes of (a) RTR and (b) HPT + RTR. 50.5 mm × 89.0 mm (600 DPI × 600 DPI).

IV. ANALYSIS AND DISCUSSION
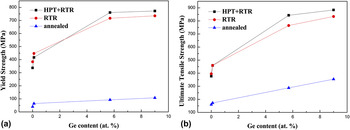
Figure 7 shows that the strength increases with Ge concentration for the annealed and SPD-processed metals. The strength of the deformed Cu–Ge alloys is attributed to the contributions of the solid solution strengthening σSS, grain boundary strengthening σGB, dislocation strengthening σD, and twin boundary strengthening σTB. The total strength (σ) of the deformed Cu–Ge alloy is calculated by a superposition law as follows:
 $$\sigma = {\sigma _0} + {\sigma _{{\rm{SS}}}} + {\sigma _{{\rm{GB}}}} + {\sigma _{\rm{D}}} + {\sigma _{{\rm{TB}}}}\quad ,$$
where σ0 is the strength of the annealed CG pure Cu. σSS is the contribution of the solid solution hardening, which is calculated as the difference in the strength of the annealed CG alloy and annealed CG pure Cu. As shown in Fig. 7, the contribution of solute addition to the strength is very limited and almost in proportion to the solute content. Therefore, the influence of the solution hardening is less significant. That is, an increase in strength of the deformed alloys with increasing Ge concentration is mainly introduced through the grain refinement (σGB) and an increase in the defect density (σD and σTB), which is closely related to the SFE. Dislocation slip and mechanical twinning are two competitive deformation mechanisms. The SFE plays a significant function in determining the deformation mechanisms of FCC metals. For most FCC metals, the twinning stress decreases with a decreasing SFE. The relationship of the twinning stress (σT) for a number of FCC metals with SFE (γSF) can be expressed as follows: Reference Meyers, Vöhringer and Lubarda32
 $$\sigma _{\rm{T}} = K\left( {{{\gamma _{{\rm{SF}}} } \over {Gb}}} \right)^{1/2} \quad ,$$
where G is the shear modulus and b is the Burgers vector. For the pure Cu and Cu–0.1Ge alloy with medium SFEs, the twinning stresses are relatively high, so the twin densities are very low. The primary mode of deformation is the dislocation slip, and grain refinement is achieved through the accumulation and rearrangement of dislocations. In contrast, much smaller grain sizes and higher defect density may be obtained in the Cu–5.7Ge and Cu–9.0Ge alloys with low SFEs where deformation twinning is the dominant deformation mode relative to the dislocation slip. Low SFEs result in dislocation dissociation into partials, and the large splitting distance between these partials hinders the dislocation annihilation during deformation, thereby leading to a high dislocation density. Reference Zhao, Horita, Langdon and Zhu11 In addition, the twin fragmentation is more beneficial for microstructure refinement, which results in finer grain sizes with a reduction in the SFEs. Reference Zhao, Horita, Langdon and Zhu11,Reference Zhang, Duan, An, Wu, Yang and Zhang22 The high-density dislocations, profuse twins, wide stacking faults, and the extensive interactions among them, lead to an increase in strength and ductility with reduced SFEs. Reference Zhao, Zhu, Liao, Horita and Langdon21
Variation of (a) YS and (b) UTS with the Ge content in at.% in the annealed, HPT + RTR and RTR processed Cu and Cu alloys. 36.7 mm ×100.3 mm (1200 DPI × 1200 DPI).

For the rolling process, the deformation strain is defined as ε = ln(L 0/L f), where L 0 and L f are the initial and final thicknesses of the deformed samples, respectively. Reference Xiao, Tao and Lu33 The strain of the RTR samples was approximately 3.5. The true logarithmic strain in HPT (εtrue) is given using the following relationship: Reference Zhilyaev, Nurislamova, Kim, Baró, Szpunar and Langdon34
 $${\varepsilon _{{\rm{true}}}} = \ln \left[ {1 + {{\theta r} \over h}} \right] + \ln {{{h_0}} \over h}\quad ,$$
where r is the radius of the disk, θ the rotation angle of the sample, h 0 and h are the initial and final thicknesses of the sample, respectively. In this expression, θ = 2Nπ, where N is the number of revolutions. The total strain of the HPT + RTR samples was approximately 10, which was the sum of the strains produced by both HPT and RTR processes. Thus, the strain of the HPT + RTR samples was almost three times larger than that of the RTR samples.
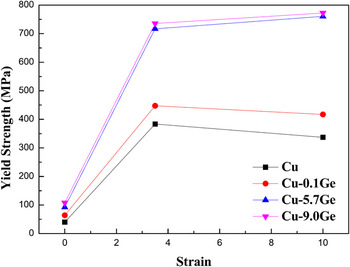
The YSs of the processed specimens are plotted against the strain in Fig. 8, where the strain is calculated as stated above. During the plastic deformation, microstructure evolution depends on the two inverse processes which take place simultaneously: one is dislocation accumulation and grain refinement, and the other is dislocation annihilation and grain boundary movement. Thus, the strength variation of the deformed materials with strain is considerably controlled by the balance between the hardening factors, such as dislocation accumulation and grain refinement, and the softening factors, such as the rate of dynamic recovery, dynamic recrystallization, and grain boundary migration in the materials. Reference Kawasaki12,Reference Edalati, Akama, Nishio, Lee, Yonenaga, Cubero-Sesin and Horita35 It can be seen from Fig. 8 that, by comparison with the annealed samples, the strengths of the deformed Cu and Cu–0.1Ge samples with medium SFEs increased sharply in the initial stage of deformation with increasing strain to ∼3.5. The strength slightly decreased with further increasing strain to ∼10. That is, the increment of strength through the additional HPT process is negative for the medium-SFE metals due to their easy cross-slip and a fast recovery rate. At the initial stage of deformation, the formation of subgrains results in an increase in the dislocation density because the subgrain boundaries act as the obstacles for dislocation movement. The dislocation accumulation and grain refinement result in an increase in the strength. With further straining by HPT, the associated temperature rise facilitates dislocation mobility and thus the misorientation angle between subgrains increases by dislocation annihilation and rearrangement at the grain boundaries, leading to a degree of softening therein. By comparison with high-purity Al with very high SFE, Reference Harai, Ito and Horita14 Cu and Cu–0.1Ge with medium SFEs also exhibited softening with recovery at high strain. In contrast, for the Cu–5.7Ge and Cu–9.0Ge alloys with low SFEs and low recovery rates, the hardness increased with enhanced strain and reached a constant at significantly high strains. After rolling to a strain of ∼3.5, the grain size continuously decreased and the defect densities continuously increased with increasing strain imposed via HPT. In addition, the interaction between solute atoms and dislocations as well as the formation of mechanical twins during plastic deformation increase the localized stress needed for dislocation motion, and thus impede dynamic recovery and dynamic recrystallization, which facilitate dislocation accumulation. The twins and stacking faults formed in metals with low SFEs during the HPT process act as effective sites for hindering dislocation motions and storing dislocation. Furthermore, recombination and cross-slip of dislocation become difficult due to low SFE, which impede dynamic recovery. Consequently, for the Cu–5.7Ge and Cu–9.0Ge alloys, the strength of the HPT + RTR samples was higher than that of the RTR samples. The effect of plastic strain on the strength varies with the amount of SFE, which agrees with the results reported previously. Reference Xu, Horita and Langdon7 In general, variation of the microstructure and mechanical properties with the strain depends upon the degree of recovery, which is closely related to the content of solute atoms and SFE of the metals. With reducing the amount of solute atoms and thus increasing SFE, the evolution of strength at a high strain exhibits the transition from hardening to softening.
Variation of YS with the strain for the Cu and Cu alloys. 34.8 mm × 44.9 mm (1200 DPI × 1200 DPI).

It has been reported that the deformation twins of the Cu–Zn alloys processed using HPT increase with plastic deformation. Reference Ungár27 It has also been found that the twin frequency that appeared in the ECAP + 95% rolling sample was larger than that in the ECAP + 75% rolling sample due to the large plastic strain. Reference Li, Zhao, Liu, Xu, Horita, Liao, Zhu, Langdon and Lavernia36 Deformation twinning is affected by the applied shear stress, thus it is dependent on the imposed strain. Reference Tao and Lu37 As plastic strain increases, the driving stress of the twin formation increases and the critical nucleus size of the twin embryo decreases, Reference Meyers, Vöhringer and Lubarda32 and this manifests an enhanced twinning tendency at larger strain. The average twin layer thickness and average spacing of neighboring twin boundaries decrease with increasing strain, which results in higher twin densities. Reference Xiao, Tao and Lu33 That is, increasing the plastic strain facilitates the formation of mechanical twins during plastic deformation.
As shown in Figs. 3 and 4, the uniform elongation and elongation-to-failure of the HPT + RTR samples are higher than those of the RTR samples. Superior ductility of the HPT + RTR samples primarily results from the higher density of twin boundaries and a higher fraction of HAGBs than those in the RTR samples. The twin boundaries and HAGBs function as barriers for dislocation slip. The interaction between the twins and dislocations may cause the twins to gradually lose their coherency during plastic deformation, which results in an increase in the strain-hardening rate. Furthermore, the deformation twinning also facilitates some plastic strain. Reference Zhao, Zhu, Liao, Horita and Langdon21,Reference Sun, Zhao, Cooley, Kassner, Horita, Langdon, Lavernia and Zhu38 The high twin density and a high fraction of HAGBs in the HPT + RTR samples possibly result in higher strain-hardening rates, and consequently higher uniform elongation and elongation-to-failure. Reference Zhao, Bingert, Liao, Cui, Han, Sergueeva, Mukherjee, Valiev, Langdon and Zhu39
V. CONCLUSIONS
Cu and Cu–Ge alloys with various germanium contents from 0.1 to 9.0 at.% were processed via RTR and HPT + RTR. The microstructure and mechanical properties are significantly affected by plastic strain, solute concentration and SFE, and the effect of the strain varied with different amounts of solute concentrations and SFEs. The following conclusions have been reached:
-
(1) A reduction in SFE leads to reduced grain size and increased dislocation and twin densities, which improve the strength and ductility of metals.
-
(2) For materials with high or medium SFEs, the microstructural evolution can readily attain saturation with increasing strain due to the high recovery rate. The strength exhibits an initial increase and a subsequent decrease with increasing strain. As a result, the strength of the HPT + RTR sample is lower than that of the RTR sample.
-
(3) For low-SFE materials, an increase in the strain leads to a decrease in the grain size and an increase in the dislocation and twin densities. Therefore, enhanced strength and improved ductility can be achieved through increasing the strain by additional HPT process.
-
(4) The HPT + RTR sample has higher twin density and a higher fraction of HAGBs than the RTR sample, resulting in higher elongation of the HPT + RTR sample.
ACKNOWLEDGMENTS
The authors would like to acknowledge financial supports by the National Natural Science Foundation of China (NSFC) (51561015), and the introduction of talents fund project of Kunming University of Science and Technology (KKSY201407100). This work was supported by the National Research Foundation of Korea (NRF) grant funded by the Korea government (MSIP) (No. 2014R1A2A1A10051322).