Introduction
A central characteristic of the mammalian visual system is the processing of visual information by parallel neural pathways that can be made evident on the basis of structural and functional differences in the characteristics of neurons within the visual system (for a review see Nassi & Callaway, Reference Nassi and Callaway2009). Evidence for parallel processing streams in the visual thalamus exists for a multitude of species, including monkeys (Dreher et al., Reference Dreher, Fukada and Rodieck1976; Sherman et al., Reference Sherman, Wilson, Kaas and Webb1976), cats (Cleland et al., Reference Cleland, Dubin and Levick1971; Stone & Hoffman, Reference Stone and Hoffman1971), and rats (Noda & Iwama, Reference Noda and Iwama1967; Fukuda, Reference Fukuda1973). Within the prominent A laminae of the cat dorsal lateral geniculate nucleus (dLGN), two types of relay neurons, called X and Y cells, that have different structural and functional attributes are believed to constitute distinct processing pathways (Cleland et al., Reference Cleland, Dubin and Levick1971; Stone & Hoffman, Reference Stone and Hoffman1971). Parenthetically, the third major class of relay neuron, the W class, is observed only in the C laminae of the cat dLGN (Wilson et al., Reference Wilson, Rowe and Stone1976; Matsubara & Boyd, Reference Matsubara, Boyd, Payne and Peters2002). In comparison to Y cells, X cell somata are smaller and tend to have nonuniform dendritic fields (Friedlander et al., Reference Friedlander, Lin, Stanford and Sherman1981), smaller receptive fields, and represent a greater proportion of the neurons within the area centralis (central visual field) representation of the dLGN (Hoffmann et al., Reference Hoffmann, Stone and Sherman1972). Functionally, X cells have slower conduction velocity than do Y cells (Hoffmann et al., Reference Hoffmann, Stone and Sherman1972), and the physiological responses of X cells are sustained, while those from Y cells are transient (Cleland et al., Reference Cleland, Dubin and Levick1971).
Visual deprivation has long been known to alter the structure and function of relay neurons in the cat dLGN (Wiesel & Hubel, Reference Wiesel and Hubel1963a). Closure of the lids of one eye (monocular deprivation) causes neurons within deprived layers to become smaller than their counterparts in nondeprived layers (Wiesel & Hubel, Reference Wiesel and Hubel1963a; Guillery & Stelzner, Reference Guillery and Stelzner1970), and within deprived layers neurons can exhibit abnormal physiological properties that include reduced responsiveness to visual stimulation (Wiesel & Hubel, Reference Wiesel and Hubel1963a; Shapley & So, Reference Shapley and So1980). The earliest quantitative studies that examined the response of X and Y cells to monocular deprivation suggested that Y cells might be more strongly influenced by the period of abnormal vision. These studies report variously, a reduced encounter rate of Y cells recorded in deprived layers (Sherman et al., Reference Sherman, Hoffmann and Stone1972; Hoffmann & Sireteanu, Reference Hoffmann and Sireteanu1977), decreased responsiveness of Y cells (Derrington & Hawken, Reference Derrington and Hawken1981), and also a greater proportion of Y cells that exhibit abnormal structure–function relationships (Friedlander et al., Reference Friedlander, Stanford and Sherman1982). These findings led to the suggestion that Y cells may be selectively affected by monocular deprivation (Friedlander et al., Reference Friedlander, Stanford and Sherman1982; Friedlander & Stanford, Reference Friedlander and Stanford1984). On the other hand, specifics of the visual impairments that follow monocular deprivation suggest some involvement of the X pathway in mediating the dysfunctions that are similar to those associated with human amblyopia. For instance, the comparatively smaller receptive fields of X cells and their high spatial resolution (Enroth-Cugell & Robson, Reference Enroth-Cugell and Robson1966; Saul & Humphrey, Reference Saul and Humphrey1990; Weng et al., Reference Weng, Yeh, Stoelzel and Alonso2005), as well as their predominance in the area centralis representation (Hoffmann et al., Reference Hoffmann, Stone and Sherman1972), are highly suggestive of their involvement in the abatement of fine spatial resolution that follows monocular deprivation. A principal objective of the current study was to use a novel marker of X cells to determine the extent to which dLGN X cells are altered by a period of monocular deprivation early in life.
Previous investigations on the structure of X and Y cells in the context of monocular deprivation were achieved by electrophysiological characterization of each cell type followed by iontophoresis of a marker that was subsequently made visible to reveal the structural details of recorded cells (Friedlander et al., Reference Friedlander, Lin, Stanford and Sherman1981, Reference Friedlander, Stanford and Sherman1982). This technique nicely revealed the fine characteristics of neuron structure, but the laborious nature of the approach meant that the number of cells sampled was low. Investigation of relay neurons in the dLGN has been facilitated by the discovery of cell-type-specific markers that are capable of revealing the full population of a particular cell type. Two anatomical markers selective for Y cells have been discovered: a chondrotin sulfate proteoglycan, aggrecan (Hockfield & Sur, Reference Hockfield and Sur1990), and also the heavy neurofilament subunit protein (Bickford et al., Reference Bickford, Guido and Godwin1998). A limiting factor with both of these Y-predominant proteins is that their levels are reduced following a period of monocular deprivation and are therefore unable to be used as a marker to reveal deprived neurons (Hockfield & Sur, Reference Hockfield and Sur1990; Bickford et al., Reference Bickford, Guido and Godwin1998). Recently, a member of the family of Forkhead box proteins, a transcription factor called FoxP2, has been identified as a marker of X cells in ferret dLGN (Iwai et al., Reference Iwai, Ohashi, van der List, Usrey, Miyashita and Kawasaki2012). In the current study, we first examined FoxP2 labeling in the cat dLGN to determine if it selectively targeted X cells as it is known to do in ferrets. We next examined whether monocular deprivation precipitated a change in the cross-sectional soma size of FoxP2-positive neurons in order to assess the extent of X cell alteration.
Materials and methods
Animals
Measurements of cell density and neuron soma size were made from 1145 neurons within the dLGN of two normal cats (postnatal days 30 and 40), and from 4910 neurons within the dLGN of two groups of monocularly deprived cats (postnatal days 37 and 79). Animals were monocularly deprived by suturing closed the upper and lower palpebral conjunctivae of the lids of the left eye (Murphy & Mitchell, Reference Murphy and Mitchell1987). All animals were monocularly deprived at postnatal day 30, the peak of the critical period for ocular dominance plasticity in the cat visual cortex (Olson & Freeman, Reference Olson and Freeman1980), and were kept deprived for either 7 days (n = 4) or for 7 weeks (n = 2). Tissue sections of dLGN from all animals were labeled to reveal FoxP2 and neurofilament protein and were also stained with a fluorescent marker for Nissl substance, so that neuron size could be measured from the same section. The methods reported herein conformed to guidelines established by the Canadian Council on Animal Care and the experiments conducted according to protocols approved by the University Committee on Laboratory Animals at Dalhousie University. All animals in this study were obtained from a closed breeding colony at Dalhousie University.
Histology
Tissue preparation
Animals were injected with a lethal dose of pentobarbital (Euthanyl) after which brain tissue was exsanguinated by transcardial perfusion with 150 ml of phosphate buffered saline (PBS) followed by 150 ml of formalin made from paraformaldehyde dissolved in PBS. After perfusion, fixed brain tissue was immediately extracted from the skull and, in preparation for cutting, the thalamus was resected and placed in a PBS solution containing 30% sucrose for 48 h. Coronal sections of the dLGN were cut on a freezing microtome at a thickness of 50 μm, and all sections were kept floating in PBS with 0.5% sodium azide until processing.
Labeling for FoxP2 was achieved with a rabbit polyclonal antibody (ab16046; Abcam, Cambridge, MA). Specificity of this antibody was tested in an immunoblot using homogenate from normal cat dLGN that revealed a single distinct band at ∼80 kDa. A mouse monoclonal antibody was used to detect the heavy neurofilament subunit (SMI-32; Covance, Princeton, NJ). The SMI-32 antibody detects the nonphosphorylated form of the heavy neurofilament subunit. Immunoblots of cat visual cortex revealed a single reacted band with an apparent molecular mass of ∼130 kDa, which is in agreement with previous reports that the nonphosphorylated form of neurofilament is comparatively lighter prior to phosphorylation (Julien & Mushynski, Reference Julien and Mushynski1982). Our treatment of the protein blot with alkaline phosphatase (P6774; Sigma-Aldrich, Ontario, Canada) before immunolabeling produced two bands with heavier apparent molecular masses (∼180 and 200 kDa) that were consistent with the two heavier phosphorylated isoforms of the heavy neurofilament subunit (Goldstein et al., Reference Goldstein, Sternberger and Sternberger1987).
Tissue processing
Sections of dLGN were first placed in a blocking solution composed of PBS and normal goat serum (1:500) for 1 h and were then transferred to a second solution that contained FoxP2 antibody (1:1500) along with an antibody against the heavy neurofilament subunit (1:1000). After incubation overnight, sections were washed three times in PBS and placed in a solution of PBS containing a Cy3-conjugated goat anti-rabbit secondary antibody (111-165-003; Jackson ImmunoResearch, West Grove, PA) to label FoxP2, and an Alexa Fluor 350-conjugated goat anti-mouse secondary antibody (A11045; Invitrogen, Carlsbad, CA) to label neurofilament. After 1 h in secondary solution, sections were washed three times in PBS and placed in a solution containing a fluorescent Nissl-binding stain, NeuroTrace (N21483, Invitrogen), which had peak excitation/emission wavelengths of 640/660 nm. After 30 min in NeuroTrace, sections were washed in PBS and mounted onto glass slides, and then were coverslipped with a fade-resistant curable mounting medium (ProLong Gold; Invitrogen).
Quantification
The cross-sectional area of neuron somata within the A laminae of the right and left dLGN was examined in normal and monocularly deprived animals. Sections of dLGN sampled for measurement were selected by appearance from Sanderson’s coronal plane 5–7 (Sanderson, Reference Sanderson1971), which is positioned approximately midway along the anterior–posterior axis of the nucleus. Neurons were distinguished from glial cells by the pattern of NeuroTrace fluorescence, which revealed neurons as having a bright cytoplasm, a dark nucleus, and a bright nucleolus (examples in Fig. 1). The selection of only neurons with a bright nucleolus permitted sampling of neurons that were cut through the presumed somal midline, which enabled area measurements to be taken at the cell’s maximum diameter, and which provided a means to avoid measurements from neuron caps. Measurements of cell size were taken from images captured using a BX51 epifluorescence microscope (Olympus; Markham, Canada) that was equipped with a high-resolution cooled monochrome Infinity3-1M digital camera (Lumenera; Ottawa, Canada) and an X-cite 120XL illumination system (EXFO, Quebec, Canada). Images were captured using a 100x oil-immersion objective. Using a motorized stage and a computerized stereology system (newCast; Visiopharm, Denmark), high-resolution digital images of NeuroTrace fluorescence were randomly sampled from lamina A and A1 using a filter set that matched the fluorescent characteristics of NeuroTrace (Cy5-4040A; Semrock, Rochester, NY). The same regions that were sampled for NeuroTrace fluorescence were revisited two additional times to capture separate images of FoxP2 and neurofilament fluorescence using filter sets specific to each marker (respectively, TRITC-A and DAPI-5060B; Semrock, Rochester, NY). Aligned images of all three markers were put onto separate layers using Photoshop (Adobe, San Jose, CA), and the outer perimeter of NeuroTrace-stained neurons that matched our selection criteria was traced using the lasso tool. The cross-sectional area of each traced neuron was measured from the NeuroTrace signal to provide a more accurate estimate of soma area (Duffy et al., Reference Duffy, Crowder and LeDue2012), and then each measured neuron was assessed for FoxP2 and also for neurofilament labeling. This provided a means to obtain the size of neurons from the general population, from the FoxP2 signal only, and from the neurofilament signal only.
Characteristics of FoxP2 labeling in the normal cat dLGN. Neurons labeled for FoxP2 were plentiful and distinct within the A and A1 layers but were far less obvious within the ventral most C layers (A and B). Neurons stained with a fluorescent Nissl marker (magenta fluorescence) were examined for neurofilament (blue fluorescence) and for FoxP2 (green fluorescence) labeling. A large Nissl-stained neuron (C) is shown to contain labeling for neurofilament (D) but not FoxP2 (E). An example of a smaller neuron (F) that does not contain neurofilament labeling (G) is shown to have strong labeling for FoxP2 (H). Most neurons we examined were either labeled for neurofilament or FoxP2, but not both. However, a medium-sized neuron provides an example of the rare occurrence of double labeling for neurofilament (I) and FoxP2 (J), as revealed by a merged image of the two labels (K). A frequency distribution (L) of the size of neurons labeled for FoxP2 (green bars), neurofilament (blue bars), or both FoxP2 and neurofilament (aqua bars) reveals mostly nonoverlapping neuron populations for FoxP2 and neurofilament and also reveals that very few neurons were double-labeled for FoxP2 and neurofilament. In both normal animals examined (M and N), the average soma size for neurons positive for FoxP2 was significantly smaller than the average soma size for neurons positive for the Y cell marker, neurofilament. The average soma area for the general population of neurons in the dLGN is also plotted in M and L (magenta bars). Double asterisks indicate significance below 0.0001. Scale bar = 500 μm (A); 250 μm (B); 10 μm (C–K).

Estimates of labeled cell density were calculated from neuron counts taken from sections of dLGN labeled for FoxP2 or for neurofilament using the optical dissector stereological probe (newCast; Visiopharm, Denmark) with a guard depth set at 5 µm, and with 30% of the region of interest sampled. Counts were restricted only to neurons with distinct labeling within the nucleus (for FoxP2) or within the soma and proximal dendrites (for neurofilament). For each layer, neuron counts for FoxP2 and neurofilament were converted to densities by dividing the neuron count by the area that was sampled.
The effect of monocular deprivation on the size and number of FoxP2-positive neurons was measured using a deprivation metric that revealed the percentage difference between deprived and nondeprived neurons (Duffy & Slusar, Reference Duffy and Slusar2009; Mitchell et al., Reference Mitchell, Kennie and Duffy2011).
 $${\rm{Deprivation Metric}} = {{{\rm{(nondeprived A}} + {\rm{nondeprived A1)}} - {\rm{(deprived A}} + {\rm{deprived A1)}}} \over {{\rm{(nondeprived A}} + {\rm{nondeprived A1)}}}}$$
Results
FoxP2 labeling in normal cat dLGN
In the first part of this study, we examined FoxP2 labeling characteristics in the dLGN of normal kittens to assess whether the exclusivity of FoxP2 label to X cells reported in ferret dLGN (Iwai et al., Reference Iwai, Ohashi, van der List, Usrey, Miyashita and Kawasaki2012) extended to the cat dLGN. In normal cats, we observed that FoxP2 labeling was strong within A and A1 layers of the dLGN (Fig. 1A and 1B), but was much weaker within the C layers as well as within the regions immediately surrounding the nucleus. An intermediate level of labeling was apparent in the medial interlaminar nucleus, which contained a smattering of FoxP2-positive neurons, consistent with reports that this nucleus contains a small number of X cells (Dreher & Sefton, Reference Dreher and Sefton1979). Similar to Iwai et al. (Reference Iwai, Ohashi, van der List, Usrey, Miyashita and Kawasaki2012), we compared the characteristics of FoxP2-positive neurons with those of neurons reactive for a Y-specific marker, neurofilament protein (Bickford et al., Reference Bickford, Guido and Godwin1998). Normal sections of dLGN stained for Nissl substance (magenta) and double-labeled for neurofilament (blue) and FoxP2 (green) contained mostly neurons that were either labeled for neurofilament and not FoxP2 (Fig. 1C–1E), or were labeled for FoxP2 but not neurofilament (Fig. 1F–1H). There were neurons distinctly labeled for both neurofilament and FoxP2 (Fig. 1I–1K) but these instances of double-labeling were rare. The distributions of soma areas for FoxP2-positive neurons and for neurofilament-positive neurons revealed little overlap between the two populations (Fig. 1L), with the peak of the distribution for FoxP2-positive neurons shifted toward smaller soma areas for both normal animals examined. In both normal animals, we found that only about 2–3% of neurons were positive for both FoxP2 and neurofilament, and the average soma area of these double-labeled cells was about 25% larger than the population average, and similar to the peak soma area for the Y cell (neurofilament) population. The average size of FoxP2-positive neurons was significantly smaller (by about 40%) than the average for neurons positive for neurofilament (Fig. 1M and 1N), and this was observed for both normal animals examined [Student’s t-test: C184: t(261) = 14.31, P < 0.0001; C186: t(308) = 17.34, P < 0.0001]. All of these results are in agreement with those from ferrets (Iwai et al., Reference Iwai, Ohashi, van der List, Usrey, Miyashita and Kawasaki2012) and indicate that FoxP2 labeling is predominant in X cells within the kitten dLGN as it is in ferrets.
FoxP2 labeling in monocularly deprived kitten dLGN
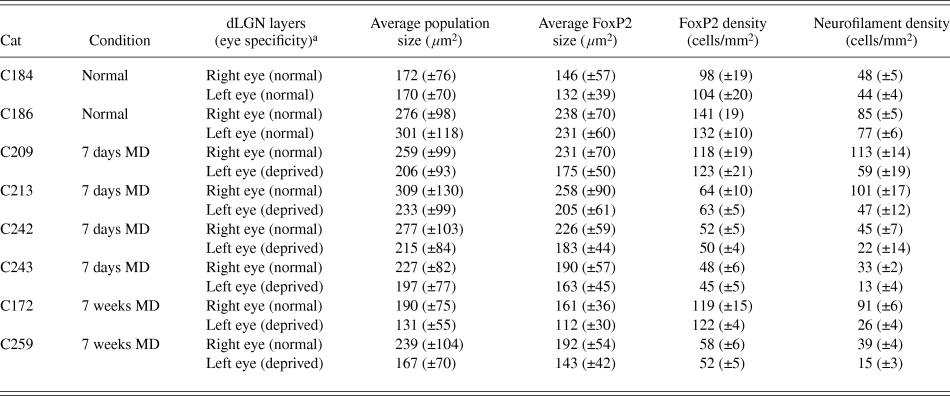
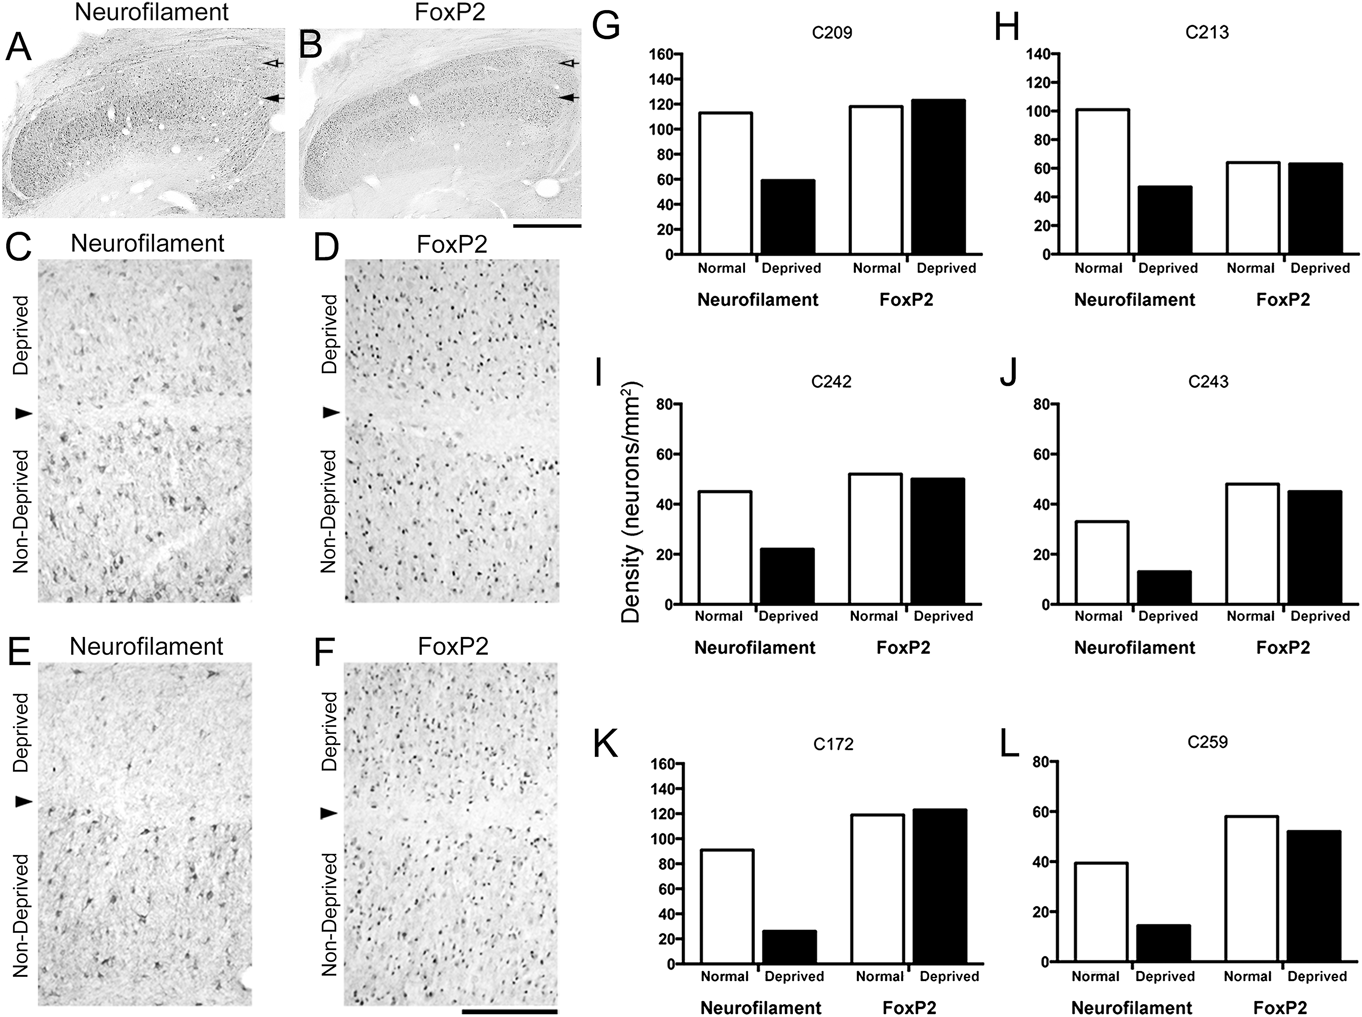
We examined the effect of 7 days and 7 weeks of monocular deprivation on FoxP2 labeling in the kitten dLGN (Table 1). Results of monocular deprivation on neurofilament and FoxP2 labeling in the right dLGN are shown at low magnification for an animal deprived for 7 days (Fig. 2A and 2B). At higher magnification, the consequences of monocular deprivation clearly revealed that after 7 days (Fig. 2C and 2D) or 7 weeks (Fig. 2E and 2F) of deprivation there was a considerable loss of neurofilament labeling in deprived layers; however, a similar reduction in FoxP2 labeling in deprived layers was not observed. A qualitative assessment of FoxP2 labeling after 7 days of deprivation (Fig. 2B and 2D) revealed no difference between deprived and nondeprived layers, and only a subtle reduction in labeling was observed in dLGN sections after 7 weeks of monocular deprivation (Fig. 2F). All 4 animals monocularly deprived for 7 days showed a large reduction in the density of neurofilament-positive neurons in deprived layers (average reduction = 52%); however, no reduction in the density of FoxP2-positive neurons was observed in any of these monocular deprived animals (average reduction = 1%; Fig. 2G–2J). After a much longer period of monocular deprivation (7 weeks), both animals examined showed the same result, namely a substantial reduction in neurofilament-positive neurons within deprived layers (average reduction = 65%) but no change in the density of FoxP2-labeled neurons (average reduction = −5%; Fig. 2K and 2L). The slightly lower overall FoxP2 labeling within deprived dLGN layers after 7 weeks of MD that was observed qualitatively was not sufficient to reduce the number of immunopositive cells with a suprathreshold level of labeling. The variability between animals observed with our quantitative measurements of the dLGN, which can been seen in Fig. 2G–2L, is similar to other cat studies that have demonstrated a large degree of between-animal variability within the dLGN (Guillery, Reference Guillery1973; Hickey, Reference Hickey1980). That the characteristics of FoxP2-positive cells were congruent with X cells, and that the number of FoxP2-positive cells was not altered by monocular deprivation, provided the opportunity to examine whether the size of FoxP2-positive neurons (presumptive X cells) was altered by monocular deprivation. Furthermore, these size measurements enabled an assessment of the contribution of X cells to the overall structural modification of neurons within the dLGN general population.
Neuron density and size measurements in dLGN
± Bracketed numbers represent s.d. For cell density, s.d. represents the variability across sections sampled.
a Right eye averages and standard deviations are derived from measurements of the left dLGN layer A and right dLGN layer A1. Left eye averages and standard deviations are derived from measurements of the right dLGN layer A and left dLGN layer A1.
The effect of monocular deprivation on FoxP2 labeling in the dLGN. Low magnification micrographs of the dLGN from a 7-day monocularly deprived animal labeled for either neurofilament (A) or FoxP2 (B) show a considerable reduction in neurofilament labeling in deprived (hollow arrow) relative to nondeprived (solid arrow) layers; however, FoxP2 labeling was not lower in deprived layers. Higher magnification views of neurofilament labeling after both 7 days (C) and 7 weeks (E) show a large reduction of reactivity within deprived layers, whereas FoxP2 labeling in adjacent sections was not altered in deprived layers after 7 days (D) and was only slightly reduced in deprived layers after 7 weeks (F). Stereological quantification of neuron density for neurofilament and FoxP2 labeling from each animal in our study (G–L) revealed that while neurofilament-positive neurons were reduced by about 50 and 65% after monocular deprivation for 7 days (G–J) and 7 weeks (K and L), respectively, the density of FoxP2 neurons was not different between deprived and nondeprived layers at either deprivation duration. Notwithstanding the variability that can be observed in the overall number of labeled neurofilament and FoxP2 neurons between animals, reminiscent of variability in cell size highlighted previously in cat dLGN (Guillery, Reference Guillery1973), the same pattern of results applied to each animal examined. The arrowhead indicates the boundary between deprived and nondeprived dLGN layers. Scale bar = 500 μm (A and B); 100 μm (C–F).
Neuron somata within deprived and nondeprived dLGN layers that were made visible with a fluorescent Nissl stain were also labeled with an antibody against FoxP2. Investigation of the size of deprived and nondeprived neurons labeled for FoxP2 provided a means to assess whether the size of X cell somata was reduced after monocular deprivation. Following 7 days of monocular deprivation, neurons from nondeprived layers that were identified as FoxP2-positive (Fig. 3A and 3C) appeared larger than FoxP2-positive neurons from deprived layers (Fig. 3B and 3D). A similar result was observed after 7 weeks of monocular deprivation, namely that nondeprived neurons identified as FoxP2-positive (Fig. 3E and 3G) were larger than deprived neurons labeled for FoxP2 (Fig. 3F and 3H). Quantification of neuron size from the general dLGN population (Fig. 3I) revealed that monocular deprivation for 7 days rendered deprived neurons significantly smaller than nondeprived neurons in all animals examined [C209: t(775) = 7.5, P < 0.0001; C213: t(560) = 7.49, P < 0.0001; C242: t(440) = 6.92, P < 0.0001; C243: t(874) = 5.61, P < 0.0001], and monocular deprivation for 7 weeks produced an even larger reduction in neuron size that was also significant for both animals examined [C172: t(433) = 8.98, P < 0.0001; C259: t(1871) = 17.29, P < 0.0001]. Quantification of the soma size of only those neurons from the general population that were FoxP2-positive (putative X cells) indicated that the soma size of deprived neurons was altered (Fig. 3J). In all animals examined, deprived FoxP2-positive neurons were significantly smaller than nondeprived neurons after 7 days of monocular deprivation [C209: t(450) = 9.95, P < 0.0001; C213: t(252) = 5.68, P < 0.0001; C242: t(192) = 5.84, P < 0.0001; C243: t(333) = 4.82, P < 0.0001]. After 7 weeks of deprivation, FoxP2-positive neurons within deprived layers of both animals examined were also significantly smaller than their counterparts in nondeprived layers [C172: t(235) = 11.28, P < 0.0001; C259: t(713) = 13.50, P < 0.0001]. In animals monocularly deprived for 7 days, measurements from the general population of dLGN cells revealed that deprived neurons were approximately 20% smaller than nondeprived neurons, and from the subpopulation of neurons that were labeled for FoxP2 we found deprived neurons to be also about 20% smaller than nondeprived FoxP2-positive neurons. After 7 weeks of monocular deprivation, the impact on neuron size was larger, with deprived neurons from the general population rendered approximately 30% smaller than nondeprived neurons, and deprived FoxP2-positive neurons were approximately 28% smaller than nondeprived FoxP2-positive neurons. That FoxP2-positive neurons represent about 40% of the population of neurons in the A laminae of the dLGN (LeVay & Ferster, Reference LeVay and Ferster1977), and that the magnitude of the modification to FoxP2-positive neurons was about the same as that observed from the general population of dLGN neurons, suggests that deprivation-induced structural modification of X cells accounts for approximately 40% of the total structural modification in the dLGN after monocular deprivation, with the remainder conceivably contributed by the Y population, which from our calculations and those of others (LeVay & Ferster, Reference LeVay and Ferster1977), represents in the A laminae approximately 25% of the dLGN neuron population.
The effect of monocular deprivation on the size of FoxP2-positive neurons in the dLGN. Following 7 days of monocular deprivation, the cross-sectional area of somata appeared larger in nondeprived layers (A) compared to those in counterpart deprived layers (B). Those neurons in the general population revealed by Nissl substance that were labeled for FoxP2 were also observed to be larger in nondeprived (C) compared to deprived (D) layers–arrows are used to point out examples of stained neurons (magenta fluorescence) that were doubled-labeled for FoxP2 (green fluorescence). After 7 weeks of deprivation, nondeprived neurons (E) were considerably larger than deprived somata (F), and this size difference was also clearly evident with comparison of nondeprived (G) and deprived (H) FoxP2-positive neurons. Calculation of a deprivation metric (see methods) for each animal revealed that within the general population, deprived neuron somata were between 15 and 25% smaller than nondeprived counterparts after 7 days of monocular deprivation, and approximately 30% smaller after 7 weeks of deprivation (I). Measurement of neuron somata that were FoxP2-positive revealed that deprived neurons were approximately 15–25% smaller after 7 days of monocular deprivation, and about 28% smaller after 7 weeks of deprivation (J). Scale bar = 40 μm.
Discussion
Results from the first part of this study extend the findings of Iwai et al. (Reference Iwai, Ohashi, van der List, Usrey, Miyashita and Kawasaki2012) by showing that FoxP2 is a marker for X cells in the cat dLGN, as it is in the dLGN of ferrets. We show additionally that following monocular deprivation begun at the peak of the critical period, the density of FoxP2-positive neurons in deprived layers is not altered by either 7 days or 7 weeks of monocular deprivation. The absence of a change in FoxP2-positive neuron density following monocular deprivation enabled an investigation of the soma size of deprived X cells, which revealed that X cells in deprived dLGN layers were significantly smaller than those within nondeprived layers. Taken together, these results indicate that X cell alteration contributes to the profound structural perturbations long known to accompany monocular deprivation early in postnatal life.
Monocular deprivation at the peak of the critical period renders deprived dLGN neurons smaller than their nondeprived counterparts (Wiesel & Hubel, 1963a; Guillery & Stelzner, Reference Guillery and Stelzner1970) by an amount that increases with the duration of deprivation (Kutcher & Duffy, Reference Kutcher and Duffy2007). After 7 days of monocular deprivation, neurons within deprived dLGN layers irrespective of FoxP2 label were approximately 20% smaller than those in nondeprived layers, and about 30% smaller after 7 weeks of deprivation; the magnitude of the effect of deprivation on the size of FoxP2-positive neurons was about the same as that found for the general neuron population. Analysis of measurements taken from FoxP2-positive neurons indicated that about 40% of the overall modification to dLGN neuron size derives from an alteration to X cells, with the remaining 60% of the change necessarily coming from the two remaining neuron populations, namely Y cells and interneurons. Because the structure and function of interneurons is thought to be largely resistant to monocular deprivation (Mooney et al., Reference Mooney, Dubin and Rusoff1979; Robson & Martin-Elkins, Reference Robson and Martin-Elkins1985), it is likely that Y cells contribute more than X cells to the deprivation-induced structural changes that occur within the dLGN. This imbalanced Y cell contribution appears to be in agreement with a study by LeVay and Ferster (Reference LeVay and Ferster1977) that examined cell soma measurements of dLGN neurons grouped according to Guillery’s classification (Guillery, Reference Guillery1966) and showed that the size of both deprived Class I neurons (putative Y cells) and Class II neurons (putative X cells) were significantly reduced following monocular deprivation, but that Class I neurons exhibited a larger reduction. While several biological markers have now been shown to preferentially identify Y cells in the cat dLGN, none are capable of revealing deprived Y cells due to the fact that levels of these markers are reduced substantially following monocular deprivation (Hockfield & Sur, Reference Hockfield and Sur1990; Bickford et al., Reference Bickford, Guido and Godwin1998), effectively making deprived cells invisible to labeling. Discovery of a cell-type-specific marker for Y cells that exhibits resistance to monocular deprivation similar to what we have shown for FoxP2 would enable an indiscriminant examination of Y cells across the full dLGN population and would likely provide a more complete understanding of the respective contribution of each relay cell type to the various visual dysfunctions that arise from deprivation.
Studies of neuron structure within the cat dLGN have implicated Y cell alteration as a primary source of structural perturbation following monocular deprivation (Friedlander et al., Reference Friedlander, Stanford and Sherman1982; Friedlander & Stanford, Reference Friedlander and Stanford1984); however, several electrophysiological studies have reported that deprived X cells in the dLGN of monocularly deprived cats exhibit a variety of perturbations including perhaps most notably a reduction of spatial resolution (Sireteanu & Hoffmann Reference Sireteanu and Hoffman1979; Lehmkuhle et al., Reference Lehmkuhle, Kratz, Mangel and Sherman1980; Mower & Christen, Reference Mower and Christen1982). Studies of another form of amblyogenic rearing, strabismus, also report reduced X cell spatial resolution (Ikeda & Wright, Reference Ikeda and Wright1976; Jones et al., Reference Jones, Kalil and Spear1984), as well as evidence of an anatomical alteration to retinogeniculate X axons (Garraghty et al., Reference Garraghty, Roe, Chino and Sur1994). Our findings of a significant reduction in dLGN X cell size support the notion that alteration of this major neural pathway contributes to the behavioral impairments produced by monocular deprivation. The reduced spatial resolution that can be measured behaviorally following even a short period of monocular deprivation begun at the peak of the critical period (Duffy & Mitchell, Reference Duffy and Mitchell2013) exhibits characteristics that are seemingly well explained by dysfunction to the X pathway. That the area centralis representation of the dLGN contains considerably more X than Y cells (Hoffmann et al., Reference Hoffmann, Stone and Sherman1972), and that X cell receptive fields are comparatively smaller than those for Y cells (Saul & Humphrey, Reference Saul and Humphrey1990; Weng et al., Reference Weng, Yeh, Stoelzel and Alonso2005), which presumably contributes to their greater sensitivity to high spatial frequencies (So & Shapley, Reference So and Shapley1979), supports the idea that alteration of the X pathway plays a part in mediating the reduction of visual spatial acuity associated with monocular deprivation.
The discovery in humans of a link between FoxP2 mutation and an inherited speech and language disorder (Lai et al., Reference Lai, Fisher, Hurst, Vargha-Khadem and Monaco2001; MacDermot et al., Reference MacDermot, Bonora, Sykes, Coupe, Lai, Vernes, Vargha-Khadem, McKenzie, Smith, Monaco and Fisher2005) has fueled speculation about the potential role that this transcription factor may play in mediating neural plasticity during early development. Studies in songbirds have implicated FoxP2 in the development and plasticity of neural circuits used for vocal control. For instance, the level of FoxP2 within the song-learning region of zebra finch striatal nucleus (area X) was shown to increase at a postnatal age that overlapped with the timing of vocal learning, suggesting that FoxP2 might act as a transcriptional repressor in early development that could regulate molecules associated with neural stability (Haesler et al., Reference Haesler, Wada, Nshdejan, Morrisey, Lints, Jarvis and Scharff2004). There is also evidence for a role of FoxP2 beyond early development that derives from a demonstration that FoxP2 mRNA in area X of adult zebra finches is regulated by singing in a social-context-dependent manner (Teramitsu & White, Reference Teramitsu and White2006). Studies of a disruption to FoxP2 have also implicated it as a factor involved in the mediation of neural plasticity in mammals. For example, Foxp2 mutation in mice has been shown to produce significant impairment in the ability to induce within striatal and cerebellar neural circuits a form of synaptic plasticity called long-term depression (Groszer et al., Reference Groszer, Keays, Deacon, de Bono, Prasad-Mulcare, Gaub, Baum, French, Nicod and Coventry2008). Monocular deprivation early in postnatal life begins with a weakening of deprived-eye input strength to the visual cortex that is mediated by mechanisms linked to long-term synaptic depression (Wiesel & Hubel, 1963b; Heynen et al., Reference Heynen, Yoon, Liu, Chung, Huganir and Bear2003), and is followed by a physical reduction in the terminal field size of these inputs (Antonini & Stryker, Reference Antonini and Stryker1993). The resistance of FoxP2 labeling to monocular deprivation suggests that its alteration is not required to precipitate structural changes linked to this rearing condition, but is instead consistent with its putative role as a transcriptional repressor that acts to silence genes involved in the promotion of neural stability (Haesler et al., Reference Haesler, Wada, Nshdejan, Morrisey, Lints, Jarvis and Scharff2004). In this way, the stable level of FoxP2 in the dLGN of monocularly deprived animals may act to facilitate in neurons the long-term synaptic depression (Wiesel & Hubel, 1963b; Heynen et al., Reference Heynen, Yoon, Liu, Chung, Huganir and Bear2003) and structural modification (Wiesel & Hubel, 1963a; Guillery & Stelzner, Reference Guillery and Stelzner1970) associated with monocular deprivation during the critical period. It will be interesting to determine if FoxP2 levels in the primary visual pathway are developmentally regulated in a manner that complements the profile of the critical period for ocular dominance plasticity.
As with cats, monocular deprivation in primates can have a profound impact on the size of neurons within the LGN. Both of the prominent neuron types in monkey LGN are modified by a period of visual deprivation begun during the early part of postnatal life. Monocular deprivation in monkeys causes neurons within deprived parvocellular and magnocellular LGN layers to be rendered smaller than counterpart neurons from nondeprived layers (Headon & Powell, Reference Headon and Powell1973; Vital-Durand et al., Reference Vital-Durand, Garey and Blakemore1978; LeVay et al., Reference LeVay, Wiesel and Hubel1980), and this effect on neuron size is proportional to the duration of deprivation (von Noorden & Crawford, Reference von Noorden and Crawford1978). The effects of monocular deprivation on the parvocellular and magnocellular pathways extend to the primary visual cortex where deprived ocular dominance columns located within layer IVCβ (parvo) as well as those within layer IVCα (magno) are shrunken relative to nondeprived columns in the same layer (Horton & Hocking, Reference Horton and Hocking1997). Our finding in cats that both major neuron pathways (X and Y) are altered by monocular deprivation brings in better alignment results from cats and monkeys on the matter of the response to abnormal vision early in postnatal life.