



1 Introduction
Free-stream turbulence impinging on a surface aids the transition of a developing laminar boundary layer (Zdravkovich Reference Zdravkovich1997). When the surface is exposed to heat, the boundary layer transition is expected to impact the heat transfer. Interestingly, experiments have revealed that heat transfer increases not only in the turbulent part, but a substantial amount also occurs even in places where the boundary layer is still laminar (Dullenkopf & Mayle Reference Dullenkopf and Mayle1994, Reference Dullenkopf and Mayle1995). Such an observation is also seen in the turbine blades of an aircraft engine which are exposed to hot gases. The heat load on the turbine blades is increased due to the free-stream turbulence coming from the combustion chamber as well as the preceding blade rows. Although the entire pressure surface and most of the suction surface of the blade remain laminar upon being exposed to free-stream turbulence, these regions exhibit enhanced heat transfer (Dullenkopf & Mayle Reference Dullenkopf and Mayle1994, Reference Dullenkopf and Mayle1995). The effect of free-stream turbulence on heat transfer through a laminar boundary layer is termed ‘laminar heat transfer’ (Dullenkopf & Mayle Reference Dullenkopf and Mayle1994, Reference Dullenkopf and Mayle1995). Understanding the characteristics of free-stream turbulence and their effect on the laminar heat transfer is of paramount importance, for instance, in designing a better turbine blade cooling system. The laminar heat transfer scenario can also be observed at the stagnation point of more simplified geometries, such as the circular cylinder.
1.1 Literature on heat transfer due to free-stream turbulence
While there are numerous experimental studies available on the subject of laminar heat transfer, only a few theoretical and numerical studies can be found. These studies are briefly discussed below under three broad categories (i) primary factors affecting laminar heat transfer, (ii) stagnation point heat transfer coefficient correlations and (iii) heat transfer enhancement mechanism.
1.1.1 Primary factors affecting laminar heat transfer
The literature reveals that the primary factors affecting heat transfer through a laminar boundary layer are (i) straining by the mean flow (
 $a$
), (ii) turbulence intensity (
 $Tu$
), (iii) Reynolds number (
 $Re$
) and (iv) turbulence length scale (
 $L_{u}$
). Secondary factors such as the cylinder blockage, surface roughness, thermal boundary condition, Prandtl number, etc., can also influence the heat transfer, but they are not widely considered in the literature.
Early experiments conducted on flow over a flat plate established the effect of mean flow straining (Kestin, Maeder & Wang Reference Kestin, Maeder and Wang1961; Junkhan & Serovy Reference Junkhan and Serovy1967). These experiments were carried out for various combinations of turbulence intensity and pressure gradient. Increase of turbulence intensity did not enhance the laminar heat transfer when the pressure gradient was zero. On the other hand, increase in turbulence intensity resulted in increased heat transfer when a favourable pressure gradient was present. As a result, these studies concluded that, in order for the free-stream fluctuations to have an effect on the laminar heat transfer, the flow must be accelerating.
Almost all of the existing experiments in the literature report that the laminar heat transfer in an accelerating flow increases for increasing turbulence intensity and Reynolds number (Kestin et al. Reference Kestin, Maeder and Wang1961; Junkhan & Serovy Reference Junkhan and Serovy1967; Van Fossen & Simoneau Reference Van Fossen and Simoneau1987; Dullenkopf, Schulz & Wittig Reference Dullenkopf, Schulz and Wittig1990; Paxson & Mayle Reference Paxson and Mayle1991; Liu & Rodi Reference Liu and Rodi1994; Magari & LaGraff Reference Magari and LaGraff1994; Ames Reference Ames1995; Ames, Wang & Barbot Reference Ames, Wang and Barbot2002; Chowdhury & Ames Reference Chowdhury and Ames2013; Kingery & Ames Reference Kingery and Ames2016). Note that the flow configurations of these experiments are very diverse, ranging from flat plates, airfoils, cylinders to rows of airfoils.
The study of Yardi & Sukhatme (Reference Yardi and Sukhatme1978) provided the first experimental evidence for the importance of turbulence length scales in laminar heat transfer. A turbulence length scale of 4 to 12 times the laminar boundary layer thickness produced the highest heat transfer increase. Length scales below and above this range had a smaller effect. Their observation was later verified in various experimental studies (Lowery & Vachon Reference Lowery and Vachon1975; Ames Reference Ames1991; Van Fossen, Simoneau & Ching Reference Van Fossen, Simoneau and Ching1995). A similar result was derived in the theoretical study of Xiong & Lele (Reference Xiong and Lele2004).
To the best of the authors’ knowledge, only a handful of numerical studies are available in the literature on the subject of laminar heat transfer (Wissink & Rodi Reference Wissink and Rodi2006, Reference Wissink and Rodi2009; Xiong & Lele Reference Xiong and Lele2007; Bhaskaran & Lele Reference Bhaskaran and Lele2010; Venema et al. Reference Venema, Von Terzi, Bauer and Rodi2011; Wissink & Rodi Reference Wissink and Rodi2011a ,Reference Wissink and Rodi b ; Venema et al. Reference Venema, Von Terzi, Bauer and Rodi2014). The studies of Xiong & Lele (Reference Xiong and Lele2007) and Bhaskaran & Lele (Reference Bhaskaran and Lele2010) are large eddy simulations (LES), while the studies of Venema et al. (Reference Venema, Von Terzi, Bauer and Rodi2011, Reference Venema, Von Terzi, Bauer and Rodi2014) are semi direct numerical simulations (DNSs), in the sense that the turbulence generating body is not fully resolved. A collective conclusion from these studies is that the observations noted by the experiments were indeed reproduced numerically as well.
1.1.2 Stagnation point heat transfer correlations
The second group of studies focused on obtaining a functional relationship for the stagnation point mean
 $Nusselt$
number,
 $\langle Nu\rangle _{0}$
, where
 $\langle Nu\rangle =q_{w}D/\langle T_{w}^{\ast }-T_{\infty }^{\ast }\rangle$
,
 $q_{w}$
is the amount of heat flux applied on the cylinder,
 $D$
is the diameter of the cylinder,
 $T_{w}^{\ast }$
and
 $T_{\infty }^{\ast }$
are the temperatures at the wall and free-stream, respectively. Earlier studies attempted to correlate
 $\langle Nu\rangle _{0}$
with the mean flow straining, Reynolds number and turbulence intensity, while omitting the turbulence length scale (Kestin et al.
Reference Kestin, Maeder and Wang1961; Lowery & Vachon Reference Lowery and Vachon1975). The most successful correlation was obtained by Dullenkopf & Mayle (Reference Dullenkopf and Mayle1994):
 $$\begin{eqnarray}\displaystyle Nu_{a}Pr^{-0.37}=0.571+0.0125Tu_{a}\left(1+\frac{1.8}{1+(Tu_{a}/20)^{3}}\right), & & \displaystyle\end{eqnarray}$$
where
 $Nu_{a}$
is the modified Nusselt number
 $Nu_{a}=\langle Nu\rangle _{0}/\sqrt{a_{1}Re_{inc}}$
, and
 $Tu_{a}$
is a modified turbulence intensity
 $Tu_{a}=Tu\sqrt{Re_{inc}/a_{1}}$
. In these definitions,
 $Re_{inc}=U_{inc}D/\unicode[STIX]{x1D708}$
, where
 $U_{inc}$
is the incident velocity and
 $\unicode[STIX]{x1D708}$
is the kinematic viscosity. The normalised free-stream straining is denoted as
 $a_{1}=aD/U_{inc}$
, where ‘
 $a$
’ is the free-stream mean straining of the flow.
Although equation (1.1) was observed to give a better collapse of available heat transfer experimental data at large turbulence intensities, there was still a scatter of data for low intensity values. This scatter was later reduced in the study of Dullenkopf & Mayle (Reference Dullenkopf and Mayle1995) where the effect of turbulence length scale was also included. Denoting the modified length scale as
 $L_{a}=(L_{u}/D)\sqrt{a_{1}Re_{inc}}$
, the new correlation is written as
 $$\begin{eqnarray}\displaystyle Nu_{a}Pr^{-0.37}=0.571+0.01Tu_{\unicode[STIX]{x1D706}}, & & \displaystyle\end{eqnarray}$$
where
 $Tu_{\unicode[STIX]{x1D706}}$
is a turbulence parameter defined as
 $$\begin{eqnarray}\displaystyle Tu_{\unicode[STIX]{x1D706}}=\frac{Tu_{a}\sqrt{L_{a}}}{(1+0.004L_{a}^{2})^{5/12}}. & & \displaystyle\end{eqnarray}$$
The constants in equations (1.1) and (1.2) are obtained from curve fitting. The correlations (1.1) and (1.2) are presently widely accepted. Their validity was assessed in the numerical studies of Venema et al. (Reference Venema, Von Terzi, Bauer and Rodi2011, Reference Venema, Von Terzi, Bauer and Rodi2014), Wissink & Rodi (Reference Wissink and Rodi2011a ,Reference Wissink and Rodi b ), and was found to be satisfactory.
1.1.3 Mechanism of heat transfer enhancement
The third group of studies investigated the heat transfer enhancement mechanism. Although it is known from the study of Kestin et al. (Reference Kestin, Maeder and Wang1961) that the primary reason for heat transfer is the mean straining of the flow, the complete mechanism can be obtained from rapid distortion theory (refer to Hunt (Reference Hunt1973)). Small-scale eddies increase heat transfer upon being stretched by the mean accelerating boundary layer due to the amplification of their turbulence intensity. This effect is felt up to three radii from the centre of the cylinder. The large-scale eddies are blocked by the boundary layer, and this effect is felt up to one integral length scale from the surface of the cylinder.
Most of the experimental studies provided validation of this mechanism only by checking if the boundary layer is accelerating or not as they were limited to measure only one point statistics. Yet, the experimental study of Hubble, Vlachos & Diller (Reference Hubble, Vlachos and Diller2013) provided an elegant picture of the role of vortical structures in stagnation heat transfer enhancement. In particular, they observed that the oncoming vortical structure has little impact on heat transfer when it is far from the surface. As the vortex approaches near the surface, its vorticity and circulation is enhanced and this vortex indulges in heat transfer enhancement through sweeping cold fluid towards the surface.
Numerical studies also have painted a better picture of this mechanism. For example, the DNS studies of Wissink & Rodi (Reference Wissink and Rodi2006), Wissink & Rodi (Reference Wissink and Rodi2009, Reference Wissink and Rodi2011a ) showed that the increase in heat transfer occurs through an up-wash of hot fluid away from the cylinder and a down-wash of cold fluid towards the cylinder. The LES studies of Xiong & Lele (Reference Xiong and Lele2007) and Bhaskaran & Lele (Reference Bhaskaran and Lele2010) observed longitudinal streamwise vortical structures that increase heat transfer by being stretched along the surface of the turbine blade.
1.2 The research gap and present investigation
Almost all of the experimental studies found in the literature on laminar heat transfer have used a classical grid to generate the oncoming turbulence. In a few studies the turbulence generator was in the form of a circular cylinder. Yet, all these studies are similar in one particular aspect: the oncoming turbulence was always observed to be homogeneous, Gaussian and fully turbulent.
Recently there has been increased interest in turbulence generated by fractal grids. Following the work of Seoud & Vassilicos (Reference Seoud and Vassilicos2007), many studies have focused on the turbulent flow generated by multi-scale or fractal grids (Mazellier & Vassilicos Reference Mazellier and Vassilicos2010; Valente & Vassilicos Reference Valente and Vassilicos2011; Gomes-Fernandes, Ganapathisubramani & Vassilicos Reference Gomes-Fernandes, Ganapathisubramani and Vassilicos2012). In these flows, an extended production region exists immediately downstream of the grid, besides the usual decay region far downstream. The production region is characterised by increasing turbulence intensity, while in the decay region the turbulence intensity decreases. Even though the decay region is close to homogeneous and Gaussian, the dissipation coefficient of turbulent kinetic energy is not constant. This non-equilibrium scaling of dissipation is reviewed by Vassilicos (Reference Vassilicos2015). Recent DNS studies have revealed that the fractal grid turbulence characteristics can also be observed behind the square grid-element i.e. the largest-scale feature of a fractal grid without fractal iterations (Zhou et al. Reference Zhou, Nagata, Sakai, Suzuki, Ito, Terashima and Hayase2014, Reference Zhou, Nagata, Sakai, Ito and Hayase2016a ,Reference Zhou, Nagata, Sakai, Ito and Hayase b ; Paul, Papadakis & Vassilicos Reference Paul, Papadakis and Vassilicos2017). In particular, the production region behind the grid-element is found to be inhomogeneous and non-Gaussian, similar to that of the fractal grid turbulence. The effect of developing inhomogeneous turbulence on heat transfer has not been considered in the literature. Consequently, the following questions arise.
(i) What is the effect of different regions such as the production, peak and decay, on the heat transfer characteristics?
(ii) Are the existing correlations for the stagnation point heat transfer coefficient valid for a developing intermittent turbulence?
(iii) How does heat transfer enhancement happen when the oncoming turbulence characteristics are different from those reported in the literature?
This paper aims to answer the aforementioned questions by considering the effect of free-stream turbulence on heat transfer from a circular cylinder. A square grid-element is used to generate the oncoming free-stream turbulence. In order to study the effect of turbulence, the grid-element is insulated (i.e. adiabatic) while the circular cylinder is heated. The cylinder is placed at three distinct locations in the wake of the grid-element. These locations are carefully chosen such that the production and decay regions have the same turbulence intensity.
The rest of this paper is structured as follows. Section 2 highlights the numerical challenges associated with studying the current configuration before presenting details of the numerical set-up and boundary conditions. The characteristics of oncoming turbulence are discussed in § 3 in terms of velocity, root-mean-square (r.m.s.) profiles and statistical measures such as skewness and flatness. The intermittent nature of the oncoming flow is also properly characterised in the same section. This is followed by analysis of the effects of free-stream turbulence on flow and thermal characteristics on the surface of the cylinder in §§ 4 and 5 respectively. Section 6 assesses the validity of the existing stagnation point heat transfer coefficient correlations, and they are found to be invalid in the production and peak regions. The following sections (§§ 7 and 8) provide explanations as to why these correlations are not valid. This includes an analysis of the dominant frequency of turbulent fluctuations and a time scale analysis. The physical mechanism responsible for heat transfer increase is also identified and explained for each region in § 8. Finally, the results of this DNS are compared with high Reynolds numbers experiments in § 9; similarities and differences are identified and explained.
2 Computational details
2.1 Numerical method
Throughout this paper, instantaneous, mean and fluctuating velocity fields are denoted as
 $u_{i}^{\ast }$
,
 $U_{i}$
and
 $u_{i}$
respectively (where
 $i=1,2,3$
), and the corresponding variables for pressure and temperature are
 $p^{\ast }$
,
 $P$
,
 $p$
and
 $T^{\ast }$
,
 $\langle T\rangle$
,
 $T$
respectively. Close to the cylinder, the velocity vector is decomposed into radial, azimuthal and spanwise components which are represented with the subscripts
 $r,\unicode[STIX]{x1D703}$
and
 $z$
respectively. Following the above notation, the instantaneous velocities are represented as
 $u_{r}^{\ast }$
,
 $u_{\unicode[STIX]{x1D703}}^{\ast }$
,
 $u_{z}^{\ast }$
, the mean velocities as
 $U_{r}$
,
 $U_{\unicode[STIX]{x1D703}}$
,
 $U_{z}$
and the fluctuating components as
 $u_{r}$
,
 $u_{\unicode[STIX]{x1D703}}$
and
 $u_{z}$
. The continuity, momentum and temperature conservation equations are written for an incompressible flow as
 $$\begin{eqnarray}\displaystyle & \displaystyle \frac{\unicode[STIX]{x2202}u_{i}^{\ast }}{\unicode[STIX]{x2202}x_{i}}=0, & \displaystyle\end{eqnarray}$$
 $$\begin{eqnarray}\displaystyle & \displaystyle \frac{\unicode[STIX]{x2202}u_{i}^{\ast }}{\unicode[STIX]{x2202}t}+u_{j}^{\ast }\frac{\unicode[STIX]{x2202}u_{i}^{\ast }}{\unicode[STIX]{x2202}x_{j}}=-\frac{1}{\unicode[STIX]{x1D70C}}\frac{\unicode[STIX]{x2202}p^{\ast }}{\unicode[STIX]{x2202}x_{i}}+\unicode[STIX]{x1D708}\frac{\unicode[STIX]{x2202}^{2}u_{i}^{\ast }}{\unicode[STIX]{x2202}x_{j}\unicode[STIX]{x2202}x_{j}}, & \displaystyle\end{eqnarray}$$
 $$\begin{eqnarray}\displaystyle & \displaystyle \frac{\unicode[STIX]{x2202}T^{\ast }}{\unicode[STIX]{x2202}t}+u_{j}^{\ast }\frac{\unicode[STIX]{x2202}T^{\ast }}{\unicode[STIX]{x2202}x_{j}}=\unicode[STIX]{x1D6FC}\frac{\unicode[STIX]{x2202}^{2}T^{\ast }}{\unicode[STIX]{x2202}x_{j}\unicode[STIX]{x2202}x_{j}}, & \displaystyle\end{eqnarray}$$
where
 $\unicode[STIX]{x1D70C}$
,
 $\unicode[STIX]{x1D708}$
and
 $\unicode[STIX]{x1D6FC}$
are the density, kinematic viscosity and thermal diffusivity respectively.
These governing equations are solved using an in-house parallel code named ‘Pantarhei’. It is an unstructured finite volume solver in collocated variable arrangement. The convective and diffusion terms are discretised by a second-order central differencing scheme, while the transient term is discretised by a second-order backward scheme. The code is parallelised using the PETSc libraries (Balay et al. Reference Balay, Abhyankar, Adams, Brown, Brune, Buschelman, Eijkhout, Gropp, Kaushik and Knepley2014). Details of the solver have been reported in previous studies (Paul Reference Paul2017; Paul et al. Reference Paul, Papadakis and Vassilicos2017; Paul, Papadakis & Vassilicos Reference Paul, Papadakis and Vassilicos2018), and are not repeated here.
2.2 Numerical challenges
This study presents DNS results of heat transfer from a circular cylinder immersed in the turbulent wake generated by a single square grid-element. A study of this kind is numerically challenging due to several factors. Firstly, the surfaces of the grid-element require fine resolution to capture the correct dynamics of the turbulent flow it generates, while the flow close to the surface of the cylinder also has to be resolved well in order to predict the correct heat transfer. Such requirements increase the number of cells significantly, in particular for high Reynolds numbers. To the best of authors’ knowledge, only the semi-DNS studies of Venema et al. (Reference Venema, Von Terzi, Bauer and Rodi2011, Reference Venema, Von Terzi, Bauer and Rodi2014) included the turbulence-generating body in the computational domain. Nonetheless, the flow around the body was not fully resolved and these studies are, therefore, only semi-DNS studies. In the studies of Wissink & Rodi (Reference Wissink and Rodi2011a ,Reference Wissink and Rodi b ), the inlet fluctuations were obtained from a separate precursor simulation.
Secondly, the spanwise length of the grid-element is larger compared to the standard spanwise size used to compute the flow around a single cylinder. For example, the study of Venema et al. (Reference Venema, Von Terzi, Bauer and Rodi2011) had a spanwise length of
 $2.5D$
, while Wissink & Rodi (Reference Wissink and Rodi2011a
,Reference Wissink and Rodi
b
) had
 $2D$
and
 $0.6D$
respectively. The presence of the grid-element increases this size by a factor of 7, which in turn increases the number of cells accordingly.
Thirdly, in our study the distance between the cylinder and the turbulence-generating body is larger than the typical distances used in previous works. In Wissink & Rodi (Reference Wissink and Rodi2011a
,Reference Wissink and Rodi
b
) this distance is usually set to less than
 $2D$
, but in the present study the cylinder is placed up to a maximum of 27
 $D$
from the turbulence-generating body. This increases the number of computational cells substantially.
Taking these factors into consideration, simulating heat transfer from a cylinder in the presence of a grid-element, even at a moderate Reynolds number, requires a large number of cells. As shown in Paul et al. (Reference Paul, Papadakis and Vassilicos2017), the turbulence generated by a single square element shares many similarities with the turbulence generated by regular or fractal grids. A regular or fractal grid will increase the complexities of the simulation as they have a larger wetted area compared to the grid-element. Due to these reasons, this work explores the effect of turbulence generated by a single square grid-element.
2.3 Simulation set-up
Sketch of the computational domain: (a) front view, (b) sectional view at the plane
 $z/D=0$
, (c) sectional view at the plane
 $y/D=0$
. (The sketches are not to scale.)

The front view of the computational domain is shown in figure 1(a) where the dimensions of the grid-element and the cylinder are noted. The square grid-element has a lateral thickness of
 $t_{0}=43~\text{mm}$
, a length of
 $L_{0}=5.3t_{0}=229~\text{mm}$
and a streamwise thickness of
 $0.14t_{0}\approx 6~\text{mm}$
. Thus, the aspect ratio (defined as the ratio between streamwise to lateral thickness) of the grid-element is 0.14, and not 1.0 as in the case of classical grids. We have chosen this aspect ratio because we also want to compare with fractal grid turbulence experiments of Melina et al. (Reference Melina, Bruce, Hewitt and Vassilicos2017). Since the fractal grid has a streamwise thickness equal to the thickness of the smallest grid-element, the streamwise thickness of the current grid-element is 6 mm. The effect of grid-element aspect ratio on turbulence dynamics has already been addressed in Paul et al. (Reference Paul, Papadakis and Vassilicos2017).
The diameter of the cylinder (
 $D$
) is equal to the lateral thickness of the grid-element bar, i.e.
 $D=t_{0}$
. The side view of the computational domain (figure 1
b) shows that the square grid-element is placed at a distance 9.25
 $D$
from the inlet. The size of the computational domain in the cross-streamwise and spanwise directions is
 $2L_{0}\times 2L_{0}$
. The distance between the cylinder and the outlet is kept constant at 10
 $D$
for all simulations. The dimensions of our computational domain are taken from the experiments of Melina et al. (Reference Melina, Bruce, Hewitt and Vassilicos2017).
For this simulation set-up, two different variables and their corresponding length scales are used to represent the streamwise distance. The variable
 $x_{g}$
is used to represent the streamwise distance with origin at the grid-element as shown in figure 1(b). On the other hand, the variable
 $x_{c}$
, with its origin at the centroid of the cylinder (see the polar coordinates in figure 1
b), is used to represent the streamwise distance with respect to the cylinder centre. A wake-interaction length scale, defined as
 $x^{\ast }=L_{0}^{2}/t_{0}$
, is used to normalise
 $x_{g}$
. The diameter of the cylinder,
 $D$
, is used to normalise
 $x_{c}$
.
As mentioned earlier, the cylinder is placed at three different locations downstream of the turbulence-generating grid-element. The terminology of these simulations is based on the turbulent kinetic energy evolution along the grid-element centreline as shown in figure 21(a): it increases for
 $x_{g}/x^{\ast }<$
0.5 (production region), it attains its maximum value around
 $x_{g}\approx 0.5x^{\ast }$
(peak region) and decreases for
 $x_{g}/x^{\ast }>0.5$
(decay region). Accordingly, the simulations are termed ‘production’, ‘peak’ and ‘decay’ and the cylinder is placed at
 $x_{g}=0.35x^{\ast }$
,
 $0.5x^{\ast }$
and
 $0.95x^{\ast }$
respectively. The locations are carefully chosen so as to have similar oncoming turbulence intensity values for the ‘production’ and ‘decay’ simulations, while the simulation ‘peak’ has the highest turbulence intensity value. Behind the bars of the grid-element, the turbulent kinetic energy decays monotonically (see figure 21
a).
The Reynolds number based on the inlet velocity and diameter of the cylinder (or the thickness of the grid-element) is
 $Re_{D}=U_{\infty }D/\unicode[STIX]{x1D708}=Re_{t_{0}}=U_{\infty }t_{0}/\unicode[STIX]{x1D708}=500$
. The blockage ratio for the grid-element is 20 %, while for the cylinder is approximately 10 %. The details of these simulations are documented in table 1. The Prandtl number (defined as
 $Pr=\unicode[STIX]{x1D708}/\unicode[STIX]{x1D6FC}$
) is always 0.71.
We have performed also two baseline simulations. The first simulation is the flow past the grid-element without a cylinder. The Reynolds number
 $Re_{t_{0}}$
is 500. This simulation is termed ‘grid-element’ and the details were already reported in Paul et al. (Reference Paul, Papadakis and Vassilicos2017). The second baseline simulation is the heat transfer for a single cylinder at
 $Re_{D}=500$
with steady approaching flow (no oncoming turbulence) and this simulation is termed ‘cylinder’.
2.4 Boundary conditions and computational mesh details
(a) Sectional view of an O-type mesh around the cylinder. (b) Variation of
 $\unicode[STIX]{x0394}r^{+}$
of the first grid point in the radial direction.

Uniform velocity and temperature profiles are prescribed at the inlet and a convective boundary condition at the outlet. No-slip condition is applied on all solid surfaces. The grid-element is insulated (corresponding to zero heat flux), while a uniform heat flux is imposed on the cylinder. All lateral boundaries are periodic.
Details of the simulations.

The mesh resolution for the grid-element is the same as the one reported in Paul et al. (Reference Paul, Papadakis and Vassilicos2017). The generated turbulence is resolved up to the order of the Kolmogorov length scale. The cross-sectional view of the mesh around the cylinder is shown in figure 2(a). An O-type mesh is used which allows for fine resolution of boundary layers. Figure 2(b) quantifies the resolution of the mesh in terms of wall units along the circumference of the cylinder. This figure illustrates that the boundary layer is well resolved, as the radial distance between the wall and the nearest mesh point is always less than 0.15 wall units. Mesh details for all simulations can be found in table 1. Every case is simulated approximated for 15 flow-through times or 250 vortex shedding cycles. This shows that our simulation has been run for much longer time than the previous DNS studies (Wissink & Rodi Reference Wissink and Rodi2006, Reference Wissink and Rodi2009).
2.5 Validation
(a) Comparison of the skin-friction coefficient with the literature. The data for
 $Re_{D}=339$
are taken from Dimopoulos & Hanratty (Reference Dimopoulos and Hanratty1968), and for
 $Re_{D}=500$
from Son & Hanratty (Reference Son and Hanratty1969). (b) Comparison of mean Nusselt number variation with the experiments of Eckert (Reference Eckert1952).

We validate our DNS solver for flow around the grid-element as well as the cylinder. The validations pertaining to the grid-element are presented later when characterising the oncoming turbulence. There is a lack of detailed reference data for the flow around the cylinder at
 $Re_{D}=500$
. Since this study deals with near-wall phenomena, in figure 3 we present results for the skin-friction coefficient (
 $C_{f}=(\unicode[STIX]{x1D708}\unicode[STIX]{x2202}U_{\unicode[STIX]{x1D703}}/\unicode[STIX]{x2202}r)/U_{\infty }^{2}$
) and the time-averaged Nusselt number (
 $\langle Nu\rangle$
). The variation of
 $C_{f}$
along the circumference of the cylinder, shown in figure 3(a), is in good agreement with the experimental study of Dimopoulos & Hanratty (Reference Dimopoulos and Hanratty1968). Zdravkovich (Reference Zdravkovich1997) reports that the mean separation angle for
 $Re_{D}=500$
is approximately
 $90^{\circ }$
, and our study also produces a similar result. The time-averaged Nusselt number, shown in figure 3(b), is also found to be in good agreement with the experiment of Eckert (Reference Eckert1952).
Krall & Eckert (Reference Krall and Eckert1973) proposed correlations for the stagnation point Nusselt number (
 $\langle Nu\rangle _{0}$
), and for the overall Nusselt number (
 $\langle Nu\rangle _{overall}$
, which is the circumferential average of
 $\langle Nu\rangle$
). They are given as
 $\langle Nu_{0}\rangle =0.95Re_{D}^{0.5}$
, and
 $\langle Nu_{overall}\rangle =0.43+0.48Re_{D}^{0.5}$
. The
 $\langle Nu_{0}\rangle$
and
 $\langle Nu_{overall}\rangle$
are 21.9 and 11.5 respectively, and their percentage errors with respect to the correlations of Krall & Eckert (Reference Krall and Eckert1973) for
 $Re_{D}=500$
are 1.6 % and 3.19 % respectively.
This validation provides evidence that the numerical mesh resolution employed in this study is adequate to compute the correct near-wall parameters of fluid flow and heat transfer.
3 Characteristics of oncoming turbulence
Visualisation of turbulent coherent structures through isosurfaces of the second invariant of the fluctuating velocity gradient tensor (
 $Q/(U_{\infty }/D)^{2}=3$
): (a) circular, (b) production, (c) peak, (d) decay.

This study focuses only on the
 $x-y$
centre plane at
 $z/D=0$
(see figure 1
b) for two reasons. Firstly, as shown in Paul et al. (Reference Paul, Papadakis and Vassilicos2017), in this plane the oncoming flow is strongly inhomogeneous and non-Gaussian. Secondly, as shown later in this paper, the stagnation point heat transfer coefficient correlations are not valid along the grid-element centreline in this plane.
Typical instantaneous flow fields are visualised in terms of isosurfaces of
 $Q$
-criterion in figure 4. The turbulent flow from the grid-element has a wider range of scales compared to that of flow past the cylinder at this Reynolds number. This section is devoted to the characterisation of the oncoming turbulence generated by the single square grid-element.
3.1 Mean and r.m.s. velocity profiles
(a) Variation of mean velocity along the grid-element centreline. (b) Mean velocity profiles upstream of the cylinder in the plane
 $z/D=0$
. Note the different horizontal axes in (a) and (b).

Mean velocity profiles along the centreline of the grid-element are shown in figure 5(a) for all the cases considered. The values are normalised by the free-stream velocity (
 $U_{\infty }$
). The approaching flow reaches zero at the streamwise location where the cylinder is placed due to the no-slip boundary condition. The velocity profiles are indistinguishable for
 $x_{g}/x^{\ast }<0.2$
. The velocity profile exhibits a jet-like behaviour close to the grid-element, followed by a monotonic decrease further downstream. Such a mean velocity variation implies that the incident Reynolds number near the cylinder is not the same as the inlet Reynolds number. The former is defined in terms of the incident velocity (
 $U_{inc}$
) outside the boundary layer. In the cases considered, this is measured at
 $x_{c}/D=-1.5$
, as this location is well outside the boundary layer, and the mean and r.m.s. velocities do not vary significantly as seen in figures 5(b) and 6(b) respectively. As expected, the incident mean velocity for the production case is the largest due to the jet-like behaviour. The incident velocities of the decay and the cylinder cases are almost equal. The computed incident Reynolds numbers (
 $Re_{inc}=U_{inc}D/\unicode[STIX]{x1D708}$
) are documented in table 1. The mean velocity profiles in figure 5(a) are also compared against the experimental results of Laizet, Nedić & Vassilicos (Reference Laizet, Nedić and Vassilicos2015), and the match is good. This provides the first evidence that the mesh resolution downstream of the grid-element is similar to the mesh used in Paul et al. (Reference Paul, Papadakis and Vassilicos2017), and the grid-element and its wake are properly resolved.
(a) Variation of r.m.s. velocity along the grid-element centreline, (b) r.m.s. velocity profiles upstream of the cylinder in the plane
 $z/D=0$
. Note the different horizontal axes in (a,b).

The r.m.s. velocity profiles along the grid-element centreline are shown in figure 6(a) together with the experimental results of Laizet et al. (Reference Laizet, Nedić and Vassilicos2015). Again, the comparison is good which further proves that the turbulent flow generated by the grid-element is indeed resolved properly. The production, peak and decay regions can be clearly identified in the r.m.s. velocity profile. Turbulence intensity is defined as in previous studies (Venema et al.
Reference Venema, Von Terzi, Bauer and Rodi2011; Wissink & Rodi Reference Wissink and Rodi2011a
,Reference Wissink and Rodi
b
),
 $Tu=\sqrt{(1/3)(\langle u_{i}u_{i}\rangle /U_{\infty }^{2})}\times 100\,\%$
. We chose to present r.m.s. velocity profiles instead of turbulence intensity profiles solely because the former can be compared against available experiments. Yet, the variation of
 $Tu$
is similar to that of
 $u_{rms}$
(see figure 21
a). Upstream of the cylinder, the
 $u_{rms}$
profile (as well as the
 $Tu$
profile) reaches a plateau at approximately the edge of the stagnation boundary layer, much like the mean velocity profile, as shown in figure 6(b). The values of
 $Tu$
at the edge of the boundary layer (i.e. at
 $x_{c}/D=-1.5$
) for each case are reported in table 1. It is important to note that the oncoming turbulence intensities for the production and decay cases are approximately similar, but the incident Reynolds numbers differ.
Development of mean velocity profiles upstream of the cylinder in the plane
 $z/D=0$
(red, production; green, peak; blue, decay; purple, cylinder).

The profiles of mean velocity along the cross-stream direction
 $y/D$
at different
 $x_{c}/D$
locations upstream of the cylinder are plotted in figure 7. The
 $x_{c}/D$
locations are chosen to be
 $-5$
,
 $-4$
,
 $-3$
,
 $-2$
,
 $-1$
. At
 $x_{c}/D=-5$
, although the profile of the cylinder case is uniform in the cross-stream direction, the profiles of other cases exhibit velocity deficits around
 $y/D\approx \pm 3$
due to the presence of grid-element bars. This velocity deficit is more prominent for the production and peak cases, while it is weaker for the decay case. This is expected as the production and peak regions are closer to the grid-element, while the decay region is further away. Downstream of
 $x_{c}/D=-5$
, the wake deficits decrease in magnitude and the profile becomes more uniform. At
 $x_{c}/D=-2$
, the velocity for the cylinder and decay cases almost match each other. The profiles at
 $x_{c}/D=-1$
clearly feel the presence of the cylinder. At the grid-element centreline, the value of mean velocity is the highest for the production case due to the jet-like behaviour discussed earlier. For the cases of cylinder and decay, the mean velocity at the grid-element centreline is observed to be similar, supporting the conclusions made earlier on the mean velocity evolution along the streamwise direction. Although the transverse average of the mean velocity profiles of the decay case is not 1, we noted the
 $y$
–
 $z$
plane-averaged velocity as 1. Therefore, mass conservation is indeed satisfied in all our simulations.
Development of r.m.s. velocity profiles upstream of the cylinder in the plane
 $z/D=0$
(red, production; green, peak; blue, decay; purple, cylinder).

The development of
 $u_{rms}$
profiles upstream of the cylinder is illustrated in figure 8. The presence of grid-element bars make the turbulence in the production and peak cases highly inhomogeneous with higher values behind the bars. On the other hand, the turbulence appears to be nearly homogeneous for the decay region. Mazellier & Vassilicos (Reference Mazellier and Vassilicos2010) reported that the turbulence behind a fractal grid becomes approximately homogeneous around
 $x\approx x^{\ast }$
. Therefore, it is not surprising that the turbulence upstream of the cylinder in the decay region is nearly homogeneous. The values of
 $u_{rms}$
at
 $y/D=0$
are similar for the production and decay regions at
 $x_{c}/D=-2$
and
 $-1$
.
3.2 Statistical characteristics of the oncoming turbulence
Variation of skewness, flatness and length scales of turbulence along the grid-element centreline: (a) skewness, (b) flatness, (c) length scale.

The oncoming turbulence is further characterised using the skewness and flatness of the streamwise fluctuating velocity. Their profiles are depicted in figure 9(a,b) respectively. For Gaussian distribution, the skewness and flatness are 0 and 3 respectively; these are shown as dashed lines in figure 9(a,b). Comparison with the experimental results of Laizet et al. (Reference Laizet, Nedić and Vassilicos2015) is good, especially for flatness. In the production region, both skewness and flatness deviate from the Gaussian values. Large negative values of skewness in the production region represent extreme decelerating turbulent events (Mazellier & Vassilicos Reference Mazellier and Vassilicos2010), while the large positive values of flatness denote intense rare events. Therefore, the production region is identified as non-Gaussian with intense rare events of decelerating turbulence. In the decay region, the values of skewness and flatness indicate that the turbulence is closer to Gaussian. It is interesting to observe that placing a cylinder in the production region further decelerates the turbulence (figure 9 a) and aids the creation of even more intense events (9 b). However, such an observation is not made for the peak region and decay region cases.
The integral length scale (
 $L_{u}$
) of the oncoming turbulence is computed using the time auto-correlation of fluctuating streamwise velocity defined as
 $R_{uu}(\unicode[STIX]{x1D70F})=\langle u(t)u(t+\unicode[STIX]{x1D70F})\rangle /u_{rms}^{2}$
. An integral time scale is computed as
 $L_{time}=\int _{0}^{R_{\unicode[STIX]{x1D713}}}R_{uu}(\unicode[STIX]{x1D70F})\,\text{d}\unicode[STIX]{x1D70F}$
, where
 $R_{\unicode[STIX]{x1D713}}$
is the first zero crossing of
 $R_{uu}(\unicode[STIX]{x1D70F})$
. This time scale is multiplied by the local mean velocity to obtain the integral length scale:
 $L_{u}=U_{local}L_{time}$
.
 $L_{u}$
normalised by the diameter of the cylinder is plotted in figure 9(c). The integral length scale profile qualitatively resembles that of Valente & Vassilicos (Reference Valente and Vassilicos2011) reported for a fractal grid.
3.3 Characterisation of oncoming turbulence intermittency
(a) Calculation of vorticity magnitude threshold, (b) sensitivity of intermittency factor to vorticity magnitude threshold.

(a) Visualisation of the turbulent/non-turbulent (T/NT) interface and vortical structures surrounding the centreline. The two-dimensional region plotted in this figure has the dimensions of
 $-5.3\leqslant z/t_{0}\leqslant 5.3$
, and
 $0\leqslant x_{g}/x^{\ast }\leqslant 0.5$
downstream of the grid-element. The purple lines represent the T/NT interfaces with
 $|\unicode[STIX]{x1D74E}^{\ast }|_{th}=0.2$
while the black lines represent the isolines of
 $0\leqslant |\unicode[STIX]{x1D74E}^{\ast }|\leqslant 3$
. (b) Evolution of intermittency factor along the grid-element centreline. (c) Evolution of intermittency factor along the spanwise direction at
 $x_{g}/x^{\ast }=0.35$
for the production case.
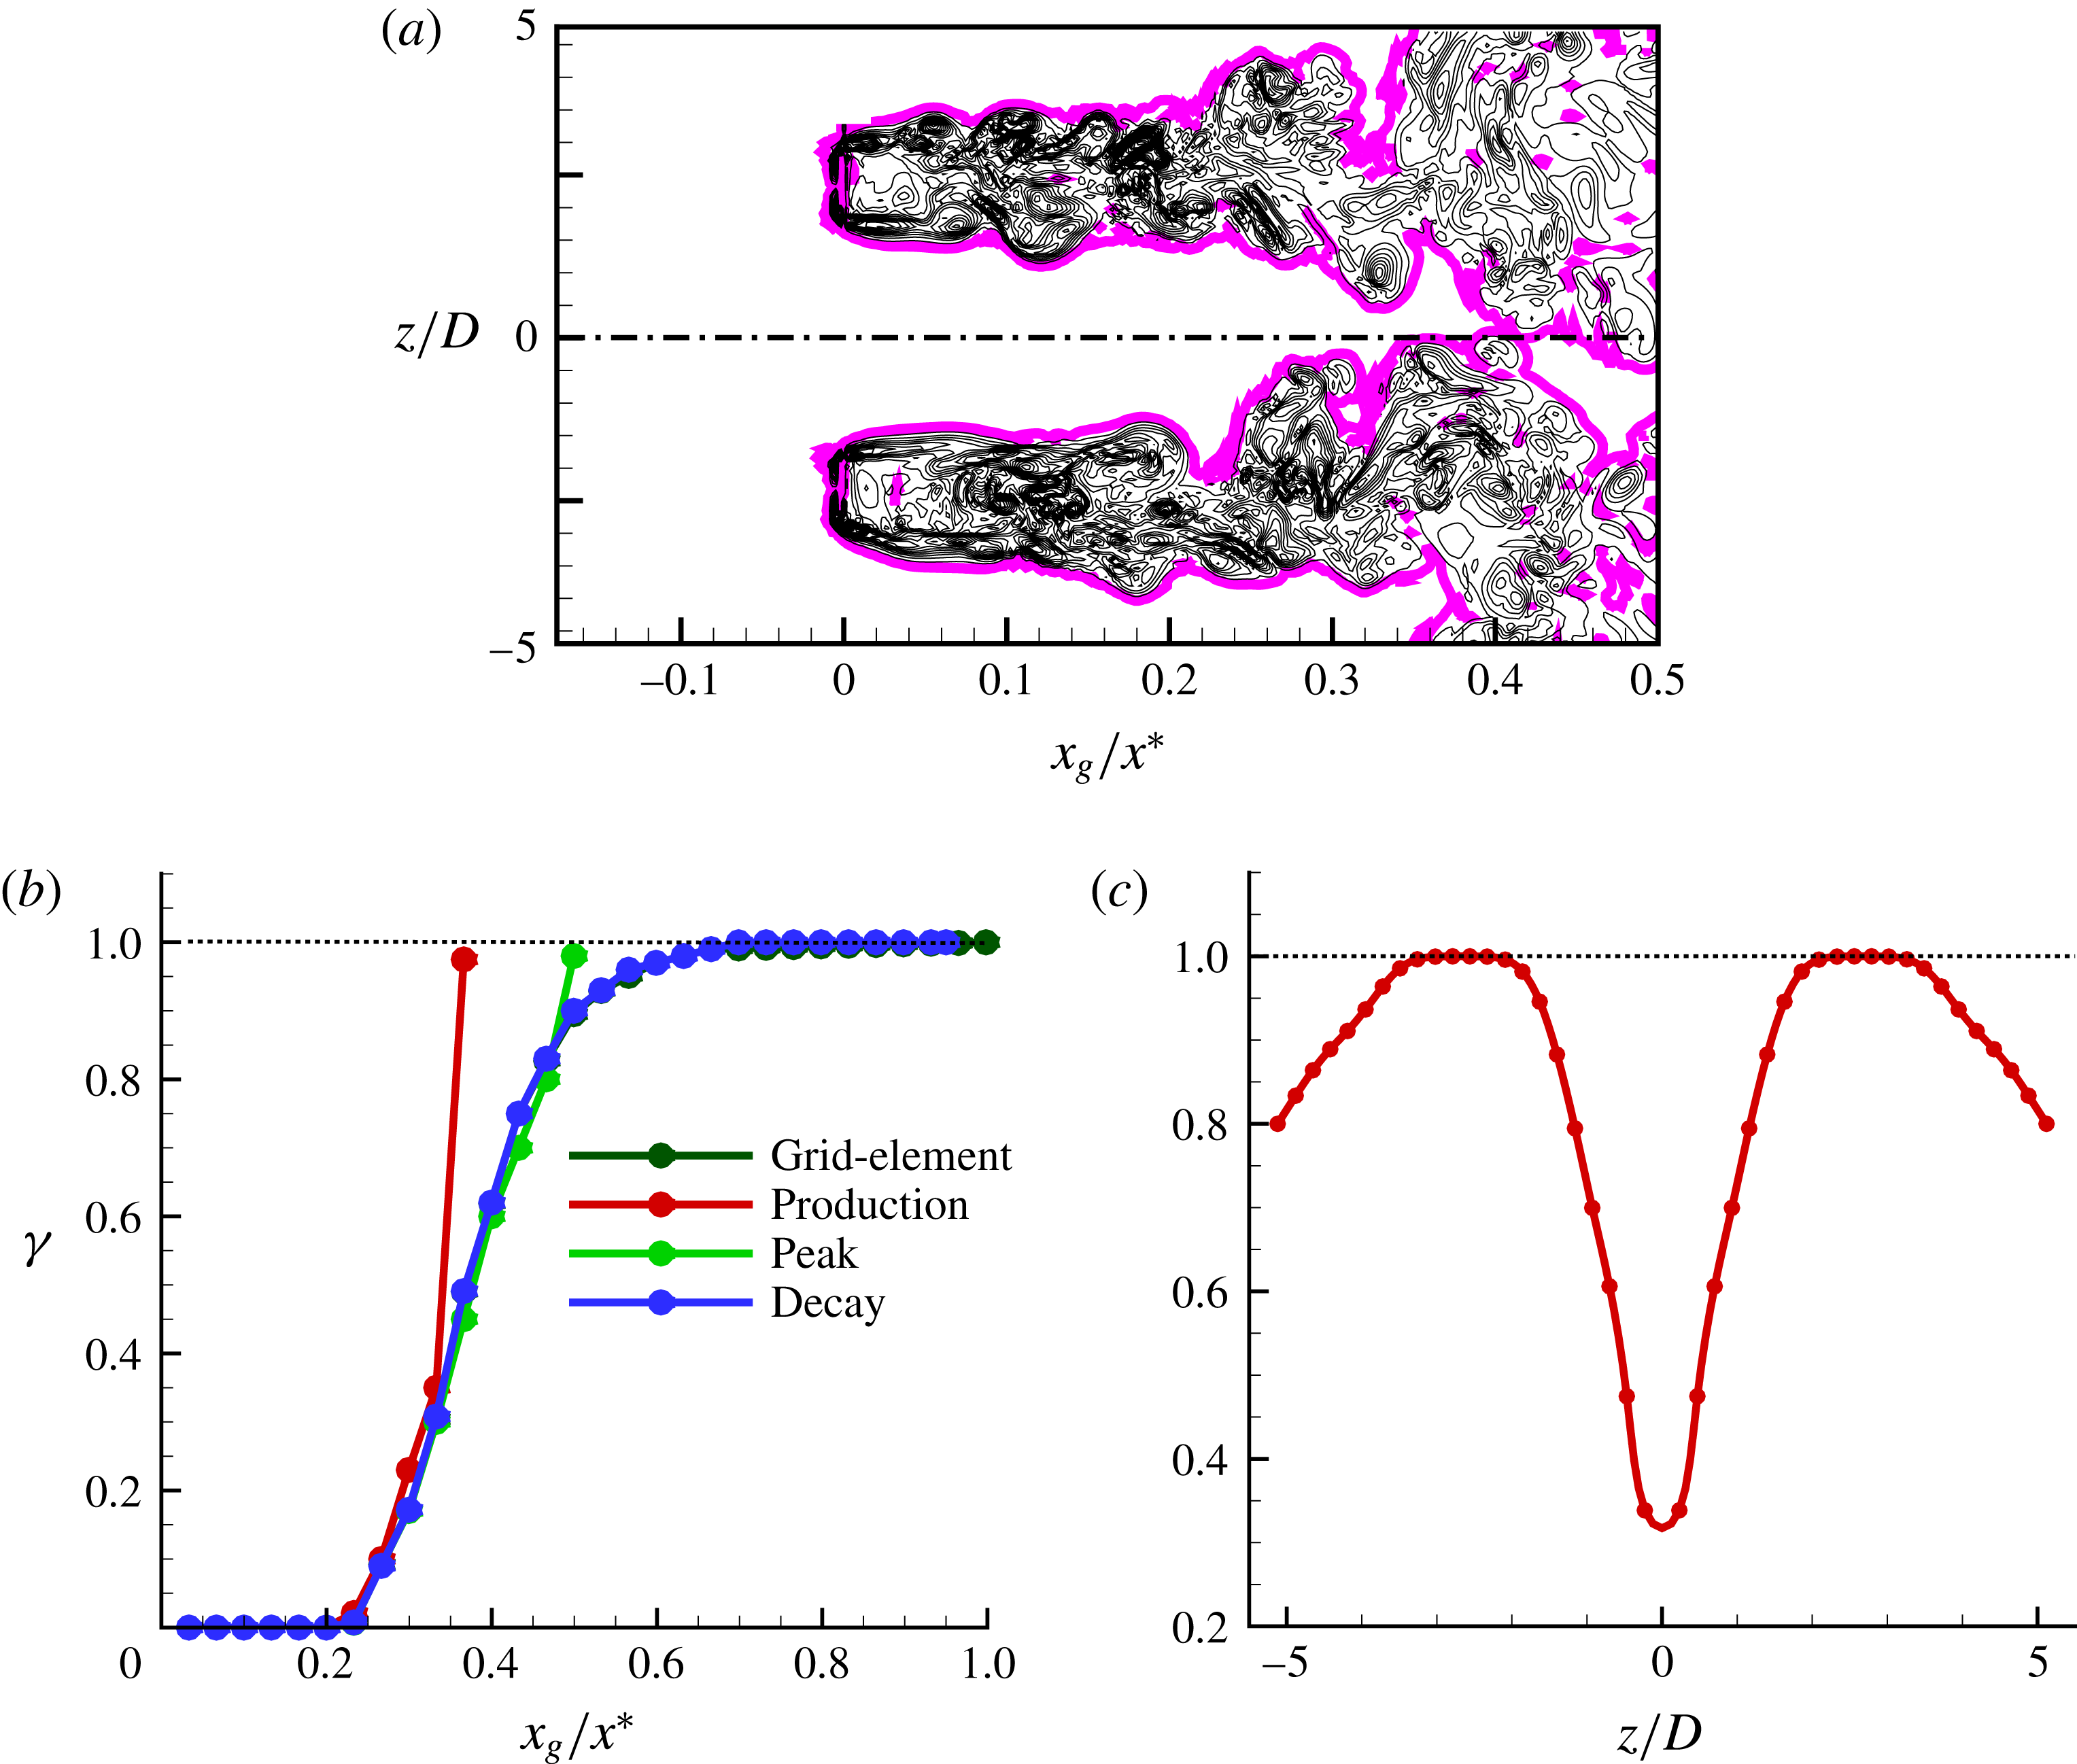
Finally, the intermittency of the oncoming turbulence is analysed. The study of intermittency is pertinent as the flatness of fluctuating streamwise velocity indicated that the production and peak regions are dominated by rare intense events. The intermittency factor (
 $\unicode[STIX]{x1D6FE}$
) is determined from the instantaneous magnitude of the vorticity vector (
 $|\unicode[STIX]{x1D74E}^{\ast }|$
), with components
 $\unicode[STIX]{x1D714}_{i}^{\ast }=\unicode[STIX]{x1D716}_{ijk}(\unicode[STIX]{x2202}u_{k}^{\ast }/\unicode[STIX]{x2202}x_{j})$
. Following studies on turbulent/non-turbulent interfaces (Bisset, Hunt & Rogers Reference Bisset, Hunt and Rogers2002; Taveira et al.
Reference Taveira, Diogo, Lopes and da Silva2013; Watanabe et al.
Reference Watanabe, Sakai, Nagata, Ito and Hayase2014; Zhou & Vassilicos Reference Zhou and Vassilicos2017), the flow is defined as turbulent when
 $|\unicode[STIX]{x1D74E}^{\ast }|$
is greater than a certain threshold,
 ${|\unicode[STIX]{x1D74E}^{\ast }|}_{th}$
. The intermittency factor is defined as
 $\unicode[STIX]{x1D6FE}$
 $=$
probability of (
 $|\unicode[STIX]{x1D74E}^{\ast }|\geqslant |\unicode[STIX]{x1D74E}^{\ast }|_{th}$
). As can be seen from this definition, the vorticity threshold value plays a crucial role in determining the intermittency factor. The method adopted for estimating
 $|\unicode[STIX]{x1D74E}^{\ast }|_{th}$
in this study closely follows that of Taveira et al. (Reference Taveira, Diogo, Lopes and da Silva2013) and Zhou & Vassilicos (Reference Zhou and Vassilicos2017). Since this study focuses only on the grid-element centreline
 $z=0$
plane, a two-dimensional instantaneous vorticity slice with dimensions
 $0\leqslant x\leqslant 0.5x^{\ast }$
and
 $-5.3D\leqslant z\leqslant 5.3D$
is considered in this plane. A wide range of
 $|\unicode[STIX]{x1D74E}^{\ast }|_{th}$
values from 0 to 10 was considered. For each value of
 $|\unicode[STIX]{x1D74E}^{\ast }|_{th}$
, the fraction of turbulent area
 $A_{T}$
 $=$
area of
 $(|\unicode[STIX]{x1D74E}^{\ast }|>|\unicode[STIX]{x1D74E}^{\ast }|_{th})/\max (A_{T})$
is computed. The variation of
 $A_{T}$
with
 $|\unicode[STIX]{x1D74E}^{\ast }|_{th}$
is depicted in figure 10(a). A plateau can be seen for a range of
 $|\unicode[STIX]{x1D74E}^{\ast }|_{th}$
values. It is generally believed that the intermittency factor weakly depends on
 $|\unicode[STIX]{x1D74E}^{\ast }|_{th}$
when the threshold is chosen to be in this plateau (Taveira et al.
Reference Taveira, Diogo, Lopes and da Silva2013; Watanabe et al.
Reference Watanabe, Sakai, Nagata, Ito and Hayase2014; Zhou & Vassilicos Reference Zhou and Vassilicos2017). This is checked in figure 10(b) which shows the variation of intermittency factor for various
 $|\unicode[STIX]{x1D74E}^{\ast }|_{th}$
. The profile of
 $\unicode[STIX]{x1D6FE}$
is found to be insensitive to
 $|\unicode[STIX]{x1D74E}^{\ast }|_{th}$
when
 $0.12\leqslant |\unicode[STIX]{x1D74E}^{\ast }|_{th}\leqslant 0.25$
. Therefore, we choose
 $|\unicode[STIX]{x1D74E}^{\ast }|_{th}=0.2$
.
The detected T/NT interface using this threshold value is visualised in figure 11(a). The figure shows that the vortical structures are enveloped by the interface. The value of
 $|\unicode[STIX]{x1D74E}^{\ast }|_{th}$
depends on the flow configuration. For example, Bisset et al. (Reference Bisset, Hunt and Rogers2002) reported a value of 0.7 for the far wake of a cylinder, while for a jet it is found to be 0.3 (Watanabe et al.
Reference Watanabe, Sakai, Nagata, Ito and Hayase2014). The variation of intermittency factor along the grid-element centreline for all the cases is presented in figure 11(b). As can be seen, the region
 $0\leqslant x_{g}/x^{\ast }\leqslant 0.2$
is purely irrotational and the region
 $0.2\leqslant x_{g}/x^{\ast }\leqslant 0.5$
is intermittent. Note the rapid increase of
 $\unicode[STIX]{x1D6FE}$
for the production and peak cases in points situated inside the developing boundary layer on the surface of the cylinder. This analysis reveals that the oncoming flow is indeed highly intermittent for the production case, less intermittent for the peak case and fully turbulent for the decay case. Since the cylinder is placed at
 $x_{g}/x^{\ast }=0.35$
for the production case, we also need to quantify the intermittency factor along the spanwise direction for this particular case. This information is provided in figure 11(c) where one can note some intermittency of the order of
 $\unicode[STIX]{x1D6FE}=0.8$
in the region between
 $z/D=\pm 5.3$
and
 $z/D=\pm 4$
. As a result, we choose
 $z/D=\pm 5$
for further analysis in the rest of the paper besides the grid-element centreline for the production case. Therefore, we have intermittent flow both at the grid-element centreline (i.e.
 $z/D=0$
) and at
 $z/D=\pm 5$
of the production case.
As an interim summary, the oncoming turbulence generated by the single square grid-element has the following characteristics downstream of the grid-element: in the production and peak regions, the turbulence is highly non-Gaussian, inhomogeneous and intermittent; on the other hand, at the decay region it is Gaussian, approximately homogeneous and fully turbulent.
4 Flow characteristics on the surface of the cylinder
Having examined the characteristics of oncoming turbulence, this section provides details on the flow characteristics around the surface of the cylinder.
4.1 Mean velocity and turbulent stress profiles inside the boundary layer
Mean azimuthal velocity profiles inside the boundary layer in the
 $z/D=0$
plane (red, production; green, peak; blue, decay; purple, cylinder).

The azimuthal velocity profiles at different angles are compared in figure 12 for all cases considered. The variation in the radial direction, normal to the cylinder surface at plane
 $z/D=0$
, is plotted. The value of mean azimuthal velocity at the front stagnation, at
 $\unicode[STIX]{x1D703}=0^{\circ }$
, is zero due to symmetry. Moving clockwise, the velocity gradually increases. The boundary layer theory predicts that the thickness of the laminar boundary layer at the stagnation point (
 $\unicode[STIX]{x1D6FF}$
) has a power-law relationship with Reynolds number as
 $\unicode[STIX]{x1D6FF}/D=Re_{D}^{-0.5}$
(Zdravkovich Reference Zdravkovich1997). This relationship appears to be satisfied for the cases considered in this study, as the simulations indicate a boundary layer thickness of
 $0.05D$
at
 $\unicode[STIX]{x1D703}=0^{\circ }$
, a value close to the theoretical prediction. Despite being exposed to turbulent fluctuations, the boundary layer profiles of production, peak and decay cases are comparable to the cylinder case. This indicates that the boundary layer on the surface of the cylinder in all cases could be laminar. Indeed, Jones & Launder (Reference Jones and Launder1973) showed that the boundary layer remains laminar for acceleration parameter
 $K$
, defined as
 $K=(\unicode[STIX]{x1D708}/U_{\infty }^{2})(\text{d}U_{\unicode[STIX]{x1D703}}/\text{d}s)$
(where
 $\text{d}s$
is the circumferential distance on the surface of the cylinder) in excess of
 $2.5\times 10^{-6}$
. We measure
 $U_{\unicode[STIX]{x1D703}}$
at
 $r/D=0.7$
. The value of
 $K$
at
 $75^{\circ }$
is computed to be around
 $3.5\times 10^{-6}$
, a value close to the critical value. Therefore, the boundary layer flow in the range of
 $0^{\circ }\leqslant \unicode[STIX]{x1D703}\leqslant 75^{\circ }$
is not fully laminar.
Hydrodynamic stress profiles inside the boundary layer in the
 $z/D=0$
plane: (a) radial stress, (b) azimuthal stress, (c) spanwise stress, (d) Reynolds stress (red, production; green, peak; blue, decay; purple, cylinder).

The turbulent stress profiles along the radial direction are plotted in figure 13. The stresses considered here are (i) radial stress (
 $\langle u_{r}u_{r}\rangle$
), (ii) azimuthal stress (
 $\langle u_{\unicode[STIX]{x1D703}}u_{\unicode[STIX]{x1D703}}\rangle$
), (iii) spanwise stress (
 $\langle u_{z}u_{z}\rangle$
) and (iv) Reynolds stress (
 $\langle u_{r}u_{\unicode[STIX]{x1D703}}\rangle$
). They are all normalised by
 $U_{\infty }^{2}$
. The effect of free-stream turbulence has penetrated inside the boundary layer, as the stress magnitudes are larger near the cylinder surface for the production, peak and decay cases while they are zero for the cylinder case. Within the boundary layer, the azimuthal and spanwise stresses are higher than the radial stress, due to the wall blocking that suppresses the latter. The magnitude of stresses gradually increases moving clockwise from the front stagnation point. The peak case exhibits the largest stress at all locations as its oncoming turbulence intensity is maximum. The radial and spanwise stress profiles collapse for the production and decay cases, especially for
 $\unicode[STIX]{x1D703}\geqslant 45^{\circ }$
. This is not the case however for the azimuthal as well as the Reynolds stress profiles.
Variation of friction coefficient along the circumference of the cylinder in the
 $z/D=0$
plane.

The effect of free-stream turbulence on the skin-friction coefficient (
 $C_{f}$
) along the circumference of the cylinder is shown in figure 14. The mean separation angles,
 $\unicode[STIX]{x1D703}_{s}$
, for the cylinder, production, peak and the decay cases are computed to be 93.5, 100.2, 103.5 and 97 respectively. The higher values of separation angle for the production, peak and decay cases compared to that of the cylinder case signify the influence of free-stream turbulence in energising the laminar boundary layer and delaying its separation from the cylinder surface.
5 Heat transfer characteristics on the surface of the cylinder
This section explores the effect of free-stream turbulence on heat transfer characteristics.
5.1 Mean temperature and turbulent heat-flux profiles inside the boundary layer
(a) Mean temperature profiles inside the thermal boundary layer in the plane
 $z/D=0$
, (b) wall-normal turbulent heat-flux (
 $|\langle u_{r}T\rangle |$
) profiles inside the thermal boundary layer in the plane
 $z/D=0$
(red, production; green, peak; blue, decay; purple, cylinder).

Figure 15(a) shows the thermal boundary layer profiles at different angles. These profiles are normalised by
 $q_{w}D/k$
, where
 $k$
is the thermal conductivity. The thermal boundary layer is thicker than the hydrodynamic boundary layer, because
 $Pr<1$
and therefore the thermal diffusion is larger than the viscous diffusion. Indeed, the thickness
 $\unicode[STIX]{x1D6FF}_{T}$
is approximately
 $0.1D$
, which is twice the hydrodynamic boundary layer thickness,
 $\unicode[STIX]{x1D6FF}$
. The mean temperature profiles of the production, peak and decay cases exhibit larger gradients compared to the cylinder case, indicating larger heat transfer. Between production and decay cases, the former has clearly larger gradients, and therefore higher heat transfer rate is expected. These observations are verified in the time-averaged Nusselt number (
 $\langle Nu\rangle$
) profiles, presented in the following subsection.
The wall-normal heat-flux profiles (
 $|\langle u_{r}T\rangle |$
) are depicted in figure 15(b). The presence of the cylinder blocks the radial fluctuation
 $u_{r}$
, and therefore the heat transfer near the cylinder is mainly due to molecular diffusion (Wissink & Rodi Reference Wissink and Rodi2011a
). Moving clockwise from
 $\unicode[STIX]{x1D703}=0^{\circ }$
, the wall-normal region where turbulent fluctuations are active is expanding radially outwards from the surface. The maximum turbulent heat flux is observed in the peak case, as expected. Comparing the profiles of the production and decay cases, the decay case has larger turbulent heat flux than the production case.
5.2 Effect of free-stream turbulence on Nusselt number profiles
Variation of mean Nusselt number along the circumference of the cylinder in the plane
 $z/D=0$
: (a) production, (b) peak, (c) decay.

The variation of mean Nusselt number,
 $\langle Nu\rangle$
, for the production, peak and decay cases is shown in figure 16(a–c) respectively. The
 $\langle Nu\rangle$
for the cylinder case is also plotted for comparison. The observations noted from the mean temperature and turbulent heat-flux profiles are reflected in the
 $\langle Nu\rangle$
. The heat transfer rate of the production, peak and decay cases is higher than that of the cylinder. The maximum increase of heat transfer at the front stagnation point occurs for the production case with a substantial
 $63\,\%$
rise. On the other hand, the peak case, which has a maximum oncoming turbulence intensity of 15 %, results in a
 $61\,\%$
increase. The decay case exhibits the smallest increase of
 $28\,\%$
, although the oncoming turbulence intensities of the production and decay cases are similar.
Effect of incident Reynolds number on stagnation point heat transfer coefficient.

It can be argued that the increase of the incident velocity for the production and peak cases can explain the observed heat transfer enhancement. Therefore, we need to account for the effect of different Reynolds numbers on the stagnation point Nusselt number,
 $\langle Nu_{0}\rangle$
. Table 2 compares the present
 $\langle Nu_{0}\rangle$
against the values predicted by theory using the correlation
 $\langle Nu_{0}\rangle =0.95Re_{D}^{0.5}$
(Krall & Eckert Reference Krall and Eckert1973). The cylinder case value of
 $\langle Nu_{0}\rangle$
is closer to that obtained by Krall & Eckert (Reference Krall and Eckert1973). The results also reveal that the effect of the present Reynolds number range is weak when there is no oncoming turbulence and, therefore, cannot explain the large increase predicted in the production region. The largest deviation from theory is observed for the peak case, and the smallest for the decay case. This observation is expected as the peak case has the highest oncoming turbulence intensity of all other cases. It is interesting, however, to note that the production case has much higher heat transfer increase than that of the decay case although both cases have a similar turbulence intensity value. Clearly, the difference in heat transfer enhancement is not due to differences in the incident Reynolds number. The reasons are explored later in this study by means of time scale separation analysis and examining the dominant frequency of the turbulent fluctuations.
The next important observation in the
 $\langle Nu\rangle$
profiles (figure 16) is the location of the maximum. The front stagnation point on the surface of the cylinder is expected to have the highest heat transfer rate. This is because the cold oncoming flow makes contact with the cylinder surface first on the front stagnation point. As the flow warms up, the rest of the cylinder surface is exposed to flow with higher temperature than the one that has impinged on the front stagnation point (Paul et al.
Reference Paul, Prakash, Vengadesan and Pulletikurthi2016). This observation is valid only in the cylinder case, when there is no oncoming turbulence. When a turbulence-generating grid-element is introduced, figure 16(a–c) shows that the
 $\langle Nu\rangle _{max}$
is shifted around
 $45^{\circ }$
away from the front stagnation point. Similar observations have been noted in the experimental study of Magari & LaGraff (Reference Magari and LaGraff1994) and the semi-DNS study of Venema et al. (Reference Venema, Von Terzi, Bauer and Rodi2011). In those studies the cylinder was subject to wake turbulence generated by a small cylinder placed upstream. They concluded that the shift in
 $\langle Nu\rangle _{max}$
is due to the presence of the small cylinder which creates a wake deficit which in turn decreases the convective heat transfer at the front stagnation point. The study of Wissink & Rodi (Reference Wissink and Rodi2011a
,Reference Wissink and Rodi
b
), where the wake generator was simulated in a precursor simulation and the turbulence data were imposed on the inlet of the domain, could not detect such a shift in
 $\langle Nu\rangle _{max}$
.
In order to gain more insight into the effect of flow on heat transfer, contour plots of
 $\langle Nu\rangle$
on the surface of the cylinder are shown for all the cases in figure 17. For the cylinder case, the
 $\langle Nu\rangle$
contour is uniform in the spanwise direction (figure 17
a) as expected. The presence of the vertical bars of the grid-element results in non-uniform distribution of
 $\langle Nu\rangle$
in the spanwise direction. This is attributed to the fact the local velocity, turbulence intensity and integral length scales vary drastically along the spanwise direction. As can be seen in figure 17(b),
 $\langle Nu\rangle$
attains its maximum value around
 $\unicode[STIX]{x1D703}\approx 45^{\circ }$
along the grid-element centreline. This feature is more prominent in the production case and becomes milder for the decay case. Since the grid-element centreline is not directly immersed in the wakes of the bars, there is no wake deficit, and so the argument of Venema et al. (Reference Venema, Von Terzi, Bauer and Rodi2011) cannot explain why the location of
 $\langle Nu\rangle _{max}$
is shifted from the front stagnation point. We propose a novel explanation for this observation in the next subsection.
Contours of mean Nusselt number on the cylinder surface: (a) cylinder, (b) production, (c) peak, (d) decay. The isocontours range from 8 to 36.

Figure 17(b) also reveals yet another intriguing behaviour. We know that the oncoming flow characteristics at the grid-element centreline (i.e.
 $z/D=0$
) and at
 $z/D=\pm 5$
of the production case are similar, meaning that both are intermittent, non-Gaussian and inhomogeneous. The only difference between these two locations (i.e.
 $z/D=0$
and
 $z/D=\pm 5$
) is the turbulence intensity values. At
 $z/D=0$
, the oncoming turbulence intensity is 11 % while it is approximately 24 % at
 $z/D=\pm 5$
. On the other hand,
 $\langle Nu\rangle _{0}\approx 35.3$
at
 $z/D=0$
while it is only 25.1 at
 $z/D\pm 5$
. These values and figure 17(b) vividly reveal that neither the intermittent, non-Gaussian nature of the flow nor the turbulence intensity are the most important parameters for the heat transfer. Note also that although the turbulence intensity is very high along the bar centreline, in particular for the production case (see figure 21
a), the maximum
 $\langle Nu\rangle$
is not observed along the bar centreline, instead it is located at the grid-element centreline. These observations also testify that the flow along the grid-element centreline has some unique characteristics that cause higher heat transfer for a lower oncoming turbulence intensity. These unique characteristics are explored in §§ 7 and 8.
Finally, we can note that the
 $\langle Nu\rangle$
contour of the decay case, shown in figure 17(d), is non-uniform along the spanwise direction although the oncoming turbulence is similar to the one considered in the literature. It appears that the flow at the decay region is only approximately homogeneous and it still remembers the upstream condition. Due to this reason, non-uniformity in
 $\langle Nu\rangle$
is not fully vanished for the decay case. Note also that the experiments, that used regular grids to generate oncoming turbulence, placed cylinders after
 $x/x^{\ast }\approx 4$
from the grid. Therefore, their results cannot be compared with our result in figure 17(d) as we are still in the near field of the grid and the flow is not fully disconnected from the upstream conditions.
5.3 Factors causing the shift in the location of
 $\langle Nu\rangle _{max}$

Probability density functions of Nusselt number at different locations along the circumference of the cylinder in the plane
 $z/D=0$
: (a) cylinder, (b) production, (c) peak, (d) decay.

The shift in the location of
 $\langle Nu\rangle _{max}$
from the front stagnation point is further explored through probability density functions (PDFs) of Nusselt number at various azimuthal locations, plotted in figure 18. The PDFs of Nusselt number for the cylinder case appear to be Gaussian with a near-perfect symmetry. The other cases exhibit an interesting behaviour. The PDF at the stagnation point appears to be near-symmetric with a Gaussian profile. Yet, for the region of
 $0^{\circ }<\unicode[STIX]{x1D703}\leqslant 45^{\circ }$
, the PDFs lose their symmetry with more skewness towards higher values of
 $Nu$
. The level of skewness increases from
 $\unicode[STIX]{x1D703}>0^{\circ }$
to
 $\unicode[STIX]{x1D703}\approx 45^{\circ }$
. After
 $\unicode[STIX]{x1D703}\approx 45^{\circ }$
, the PDFs again translate to a near-symmetric shape for the production, peak and decay cases. It appears that additional intense events occur in the region of
 $0<\unicode[STIX]{x1D703}\leqslant 45$
compared to the front stagnation point that cause the skewness of the PDFs. Such events can be more clearly seen in figure 19 where the PDFs of Nusselt number at the front stagnation point and at
 $\unicode[STIX]{x1D703}=45^{\circ }$
are compared. The green shaded areas in these figures represent the additional intense events occurring at
 $\unicode[STIX]{x1D703}=45^{\circ }$
. Note that the shaded area in these figure is largest for the production case, and progressively decreases in the peak and decay cases. These events cause the PDFs of Nusselt number to skew more towards higher values, resulting in a higher heat transfer rate at
 $\unicode[STIX]{x1D703}=45^{\circ }$
.
Illustration of additional intense events occurring at the
 $\langle Nu\rangle _{max}$
point in the plane
 $z/D=0$
for the case of (a) circular, (b) production, (c) peak, (d) decay.

Having identified the presence of intense events at
 $\unicode[STIX]{x1D703}=45^{\circ }$
, the question now is what causes such events. The answer can be found in the oncoming turbulence profiles. It is known that the Nusselt number is primarily a function of Reynolds number, turbulence intensity and length scales. The length scales are not expected to change drastically in the limited range of
 $0\leqslant \unicode[STIX]{x1D703}<45^{\circ }$
. However, the profiles of mean velocity show that there exists a jet-like behaviour as discussed earlier. Therefore, the cylinder sees a much higher velocity at locations
 $0<\unicode[STIX]{x1D703}\leqslant 45$
as seen in figure 7 for
 $x_{c}/D=-1$
. Adding to that, the oncoming turbulence intensity is also highly inhomogeneous in the cross-stream direction with less intensity at the stagnation point and higher values away from it (see figure 8). Therefore, it is believed that the increase in local mean incident flow and its turbulence intensity at
 $\unicode[STIX]{x1D703}\approx 45^{\circ }$
compared to the front stagnation point is related to the additional intense events which in turn shift the
 $\langle Nu\rangle _{max}$
by
 $45^{\circ }$
from the stagnation point.
6 Validity of the existing stagnation point heat transfer correlations
Assessment of (a) the correlation (1.1) of Dullenkopf & Mayle (Reference Dullenkopf and Mayle1994) and (b) the correlation (1.2) of Dullenkopf & Mayle (Reference Dullenkopf and Mayle1995). The square symbols represent data for the bar centreline (see figure 1
c), and they are differentiated in terms of their colour: red, production; green, peak; blue, decay; purple, cylinder. The red-coloured right triangles are for the production case at
 $z/D=\pm 5$
. The filled inverted triangles are the literature data from Venema et al. (Reference Venema, Von Terzi, Bauer and Rodi2011), Wissink & Rodi (Reference Wissink and Rodi2011a
,Reference Wissink and Rodi
b
), and Venema et al. (Reference Venema, Von Terzi, Bauer and Rodi2014). The other symbols represent the grid-element centreline correlations: triangle, production; diamond, peak; circle, decay. The open symbols are the results obtained with the potential value of free-stream straining
 $a_{1}=4$
, and the filled symbols are from the computed value of
 $a_{1}$
. The dotted lines represent the
 $\pm 5\,\%$
error bounds of the correlations.

The validity of existing correlations for the stagnation point heat transfer coefficient is assessed in this section. These correlations are given by equations (1.1) and (1.2) and they require the calculation of free-stream straining,
 $a_{1}$
. The value of
 $a_{1}$
is difficult to measure experimentally, and most of the experimental studies assume
 $a_{1}=4$
which corresponds to potential flow. The procedure outlined in Venema et al. (Reference Venema, Von Terzi, Bauer and Rodi2011) is followed in this study to determine the value of
 $a_{1}$
. On the grid-element centreline,
 $a_{1}$
is defined as
 $a_{1}=-(\unicode[STIX]{x2202}U/\unicode[STIX]{x2202}x)(D/U_{inc})$
. The variation of
 $a_{1}$
along the centreline reaches a plateau around
 $x_{c}/D=-1.5$
(much like the plateau observed for the mean and r.m.s. velocity profiles), and the values chosen from this plateau are 1.8, 2.8, 3.6 and 3.8 for the production, peak, decay and circular cases respectively. The values of
 $Nu_{a}$
and
 $Tu_{a}$
are checked against the correlation curve in figure 20(a). As the computation of
 $a_{1}$
involves uncertainties, the correlation parameters are also computed using the potential flow constant
 $a_{1}=4$
. The closed symbols represent the computed values of
 $a_{1}$
, while the open symbols represent the potential flow value. The cylinder case, which also forms the origin of the correlation curve, is well predicted. It is interesting, however, to note that the correlation curve is not valid for the production and peak cases, where the computed values are much higher, and outside the correlation error bound region. On the other hand, the correlation curve is satisfied in the decay case. One could presume that the exclusion of the turbulence length scale in equation (1.1) could be the reason why the correlation is not satisfied in the production and peak cases. Therefore, the correlation proposed by Dullenkopf & Mayle (Reference Dullenkopf and Mayle1995), which includes the effect of the integral length scale (refer to equation (1.2)), is also assessed.
The two sides of the correlation equation (1.2) are computed and compared against the correlation curve in figure 20(b). It is observed that this correlation is also invalid for the production and peak cases, similar to the previous correlation. Therefore, the inclusion of length scale does not change the scenario. Note, however, that the parameter
 $Tu_{\unicode[STIX]{x1D706}}$
in (1.2) is for a spectra without any shedding frequency while the production and peak cases clearly have a shedding effect (see figure 21
b). Therefore, the correlation equation (1.2) is not fully reliable for the production and peak cases. Yet, it is intriguing to note that the production case at
 $z/D=\pm 5$
does satisfy the correlations (1.1) and (1.2), where the flow is inhomogeneous, non-Gaussian and intermittent (look for right triangles in figure 20). The failure of both the existing correlations for the grid-element centreline indicates that the turbulence in the grid-element centreline production and peak cases possess some unique characteristics which produce higher heat transfer compared to previous studies. The reasons for this excessive heat transfer rate are discussed in the next two sections. Note also that this is the first DNS study that reports some invalidity of correlations (1.1) and (1.2). The previous numerical studies (Venema et al.
Reference Venema, Von Terzi, Bauer and Rodi2011; Wissink & Rodi Reference Wissink and Rodi2011a
,Reference Wissink and Rodi
b
) showed that the correlation curves are valid for the case of wake turbulence generated by a small cylinder placed upstream of a larger cylinder. In the present configuration, the correlations are found to be valid also along the bar centreline (see figure 20(a,b), filled square symbols). It is indeed intriguing to note that the presence of turbulence along the grid-element centreline exhibits such unusual heat transfer results, while the bar centreline and the location
 $z/D=\pm 5$
exhibit results which are consistent with the literature. This is the main reason, as mentioned at the beginning of this section, why this study focuses only on the
 $x$
–
 $y$
plane which has the grid-element centreline (i.e.
 $z=0$
plane).
7 Effect of the dominant frequency of fluctuations on heat transfer
(a) Evolution of turbulence intensity along the bar and grid-element centrelines. (b–d) Energy spectrum at
 $x_{c}/D=-1.5$
in the plane
 $z/D=0$
: (b) production, (c) peak, (d) decay. The dominant frequency and its corresponding spectral density in the grid-element and bar centrelines are marked by green and brown lines respectively. The dominant frequency range is indicatively marked with dotted blue and purple lines for the grid-element and bar centreline respectively. The spectra and its dominant frequency in black lines in (b) represent the production case at
 $z/D=\pm 5$
.

This section initiates the investigation why the stagnation point heat transfer correlations are not valid in the production and peak cases. Receptivity theory states that the laminar boundary layer is sensitive (or receptive) to the free-stream disturbances only in a selective band of frequencies. The representative frequency of this band is obtained using receptivity theory as
 $f_{\unicode[STIX]{x1D706}}=\unicode[STIX]{x1D706}U_{\infty }/\unicode[STIX]{x1D6FF}$
, where
 $\unicode[STIX]{x1D706}$
is a constant which was computed to be in the range of 0.01 to 0.04 (Schlichting & Gersten Reference Schlichting and Gersten2016). Therefore, it is not the root mean square of the fluctuations, but it is the spectral energy content of the fluctuations that determines the response of the boundary layer to the free-stream turbulence. For stagnation flows, the boundary layer thickness is
 $\unicode[STIX]{x1D6FF}\approx 2.4\sqrt{\unicode[STIX]{x1D708}/a}$
(Schlichting & Gersten Reference Schlichting and Gersten2016). Using this expression, Dullenkopf & Mayle (Reference Dullenkopf and Mayle1995) derived an equivalent frequency to which the stagnation point boundary layer is most receptive and it is given as
 $f_{\unicode[STIX]{x1D706}}=0.03U_{\infty }/\unicode[STIX]{x1D6FF}$
. Using this expression, the normalised dominant frequency of fluctuations to which the stagnation boundary layer is most receptive, can be computed as
 $$\begin{eqnarray}\displaystyle \unicode[STIX]{x1D719}_{\unicode[STIX]{x1D706}}=\frac{f_{\unicode[STIX]{x1D706}}D}{U_{inc}}0.0125\sqrt{Re_{inc}a_{1}}. & & \displaystyle\end{eqnarray}$$
In order to investigate the effect of dominant frequency of fluctuations, the variation of turbulence intensity and its spectra at three locations along the bar and grid-element centrelines are presented in figure 21. The dominant frequency
 $\unicode[STIX]{x1D719}_{\unicode[STIX]{x1D706}}$
is plotted in figure 21(b–d) along with the spectra of velocity fluctuations computed at a distance
 $1.5D$
upstream of the cylinder for both grid-element and bar centrelines. A selective bandwidth of frequencies (
 $\unicode[STIX]{x0394}\unicode[STIX]{x1D719}$
) to which the boundary layer is receptive is also shown indicatively in the figure. This frequency band is constructed with the constraint
 $\unicode[STIX]{x0394}\unicode[STIX]{x1D719}/\unicode[STIX]{x1D719}_{\unicode[STIX]{x1D706}}\ll 1$
as proposed by Dullenkopf & Mayle (Reference Dullenkopf and Mayle1995). In this study, the ratio
 $\unicode[STIX]{x0394}\unicode[STIX]{x1D719}/\unicode[STIX]{x1D719}_{\unicode[STIX]{x1D706}}$
is taken as
 $10^{-3}$
.
The turbulence intensity is very high in the near field of the bar centreline, while both grid-element and bar centrelines have similar values of turbulence intensity far downstream (see figure 21
a). At
 $x/x^{\ast }\approx 0.35$
(i.e. in the production region), although the turbulence intensity of the bar centreline is at least twice that of the grid-element centreline (figure 21
a), it is clear from figure 17(b) that the maximum heat transfer occurs only along the grid-element centreline. As seen in figure 21(b), the dominant frequency range lies very close to the shedding frequency which has the highest energy content for the production case grid-element centreline, while it lies in higher frequencies that have lower energy for the production case bar centreline. This means that although the r.m.s. of velocity fluctuations is higher for the bar centreline production case, their energy content at the dominant frequency is much less than that of the grid-element centreline. Therefore, they are not as effective as the grid-element centreline disturbances in penetrating the boundary layer.
The energy spectrum and its dominant frequency range for the production case spanwise location
 $z/D=\pm 5$
is also plotted as a black line in figure 21(b). Recall that the flow at this location shares similar characteristics to that of the flow along the production case grid-element centreline. That is, the flow is intermittent, non-Gaussian and inhomogeneous. At this location, the oncoming turbulence intensity is 24 %. Yet, the dominant frequency lies in higher frequencies as the mean straining behaviour here is equivalent to that of the bar centreline. As a result, although the flow at
 $z/D=\pm 5$
intermittent and has higher oncoming turbulence intensity, it is not as effective as the grid-element centreline flow in interacting with the laminar boundary layer and is thus also less effective in causing higher heat transfer.
One can note by comparing figure 21(b,d) that, along the grid-element centreline, the energy content of the dominant frequency is higher for the production case while it is lower for the decay case, although the turbulence intensities are similar at 11 % (see figure 21 a). The higher energy content of the production region dominant frequency is one of the reasons why the grid-element production case results in very high heat transfer and thus fails to satisfy the existing stagnation point correlations. This evidence proves that the most important parameter for heat transfer increase is the dominant frequency of fluctuations rather than the turbulence intensity. In the next section, we further investigate the unusual heat transfer increase for the grid-element centreline production and peak cases.
8 Time scale separation analysis and mechanisms of heat transfer enhancement
(a) A typical segment of intermittency function signal with the corresponding instantaneous Nusselt number. The Nusselt number signal is recorded at
 $x_{c}/D=-0.5$
(i.e. at the surface of the cylinder) while the intermittency function signal is at
 $x_{c}/D=-1.5$
. (b) An example of a shedding event. (c) An example of a non-shedding event. (d) Probability of time scales of turbulent events.

In this section, a novel approach is used to provide more insight into the nature of the flow that causes a higher heat transfer rate for the production case. A time scale analysis is performed at
 $x_{c}/D=-1.5$
(i.e. at the edge of the laminar boundary layer where the plots of 21(b–d) were computed) as explained below. The turbulent flow events are identified at that point through the intermittency function,
 $I(t)$
, which is defined as
 $$\begin{eqnarray}I(t)=\left\{\begin{array}{@{}ll@{}}0,\quad & \text{if }|\unicode[STIX]{x1D74E}^{\ast }(t)|<|\unicode[STIX]{x1D74E}_{th}^{\ast }|,\\ 1,\quad & \text{otherwise},\end{array}\right.\end{eqnarray}$$
where
 $I(t)=0$
means that the flow can be considered irrotational while
 $I(t)=1$
means it is turbulent. We choose
 $|\unicode[STIX]{x1D74E}_{th}^{\ast }|=0.2$
as determined in § 3.3. A typical intermittency function and the corresponding instantaneous Nusselt number signal is shown in figure 22(a) for the production case. Note that, while the intermittency function is computed at
 $x_{c}/D=-1.5$
, the
 $Nu$
signal is at the front stagnation point (
 $x_{c}/D=-0.5$
). Therefore, the time lag between these two points is approximately estimated from the distance between the points and the local mean velocity (
 $U_{inc}$
). Consequently, the
 $Nu$
signal is shifted in time according to the time delay. As can be seen in figure 22(a), the flow is highly intermittent, and the turbulent flow (i.e. the events for which
 $I(t)=1$
) has a wide range of time scale events (
 $\unicode[STIX]{x1D70F}=\unicode[STIX]{x0394}tU_{inc}/D$
, where
 $\unicode[STIX]{x0394}t$
is the time step of the turbulent event) ranging from short to long. Typical short and long time scale events are shown in figure 22(b,c) respectively. Computing the probability of the time scale events (
 $\unicode[STIX]{x1D70C}_{\unicode[STIX]{x1D70F}}(\unicode[STIX]{x1D70F})$
) for the entire signal reveals that the flow is dominated by shorter rather than longer time scale events (figure 22
d). The smallest time scale event observed in our data set is represented as
 $\unicode[STIX]{x1D70F}_{min}$
. As the current simulation has run for sufficiently long time (as evidenced by the well-converged statistics presented earlier), it is expected that the turbulent events of time scale
 $\unicode[STIX]{x1D70F}<\unicode[STIX]{x1D70F}_{min}$
could occur very rarely. The time scale of the short events, as noted in figure 22(d), is comparable to the time scale of vortex shedding (
 $\unicode[STIX]{x1D70F}_{vs}=1/St$
), where
 $St$
is the Strouhal number (
 $St=f_{vs}D/U_{inc}$
, see figure 21
b–d). Therefore, the short time scale events are called shedding events, while the long time scale events are called non-shedding events. In this way, the energetic shedding events that have a time scale of
 $\unicode[STIX]{x1D70F}_{vs}$
are considered as equivalent to those with the dominant frequency (
 $\unicode[STIX]{x1D719}_{\unicode[STIX]{x1D706}}$
). It must be stressed here that the Strouhal frequency in figure 21 is the frequency of the flow itself, while the frequency in figure 22(d) is only the representative frequency of a turbulent event.
(a) Variation of instantaneous Nusselt number in a shedding event. (b) Variation of instantaneous Nusselt number in a non-shedding event. (c) Variation of conditional mean Nusselt number with respect to the time scales of turbulent events. (d) Calculation of optimum
 $\unicode[STIX]{x1D70F}_{2}$
.

Typical variations of instantaneous
 $Nu$
for the shedding and non-shedding events are depicted in figure 23(a,b) respectively. The time-averaged Nusselt number conditioned for every time scale event
 $\unicode[STIX]{x1D70F}$
,
 $\langle Nu\rangle _{\unicode[STIX]{x1D70F}}$
, is given in figure 23(c). The shaded area in this figure represents the lack of statistical convergence in
 $\langle Nu\rangle _{\unicode[STIX]{x1D70F}}$
as only a few non-shedding events occur in the production case. Yet, the main interpretation from this figure is that the largest heat transfer occurs at the shedding events, and the value of
 $\langle Nu\rangle _{\unicode[STIX]{x1D70F}}$
decreases for increasing
 $\unicode[STIX]{x1D70F}$
. This signifies the importance of shedding events for higher heat transfer rates. These shedding events, as noted earlier, are able to penetrate the boundary layer, because they have a frequency close to
 $\unicode[STIX]{x1D719}_{\unicode[STIX]{x1D706}}$
. The
 $Nu$
values corresponding to
 $I(t)=0$
events are found to be small compared with the events of
 $I(t)=1$
.
Based on the DNS results of this study, a simple model for the mean Nusselt number is proposed. It is given as
 $$\begin{eqnarray}\displaystyle \langle Nu\rangle _{model}=\int _{\unicode[STIX]{x1D70F}_{min}}^{\unicode[STIX]{x1D70F}_{2}}\unicode[STIX]{x1D70C}_{\unicode[STIX]{x1D70F}}(\unicode[STIX]{x1D70F})\langle Nu\rangle _{\unicode[STIX]{x1D70F}}\,\text{d}\unicode[STIX]{x1D70F}. & & \displaystyle\end{eqnarray}$$
Mathematically, equation (8.2) should be integrated from 0 to infinity. For intermittent flows, however, it is integrated from
 $\unicode[STIX]{x1D70F}_{min}$
to
 $\unicode[STIX]{x1D70F}_{2}$
. The optimum value of
 $\unicode[STIX]{x1D70F}_{2}$
,
 $\unicode[STIX]{x1D70F}_{2(opt)}$
, is determined by integrating equation (8.2) for various values of
 $\unicode[STIX]{x1D70F}_{2}$
and
 $\unicode[STIX]{x1D70F}_{2(opt)}$
is chosen to be the value of
 $\unicode[STIX]{x1D70F}_{2}$
for which the
 $\langle Nu\rangle _{model}$
becomes equal to the value computed by the simulations (see figure 23
d). We observed that the optimum time scale event (
 $\unicode[STIX]{x1D70F}_{2(opt)}$
) is approximately six times of the shortest time scale event (
 $\unicode[STIX]{x1D70F}_{min}$
). The time scale range
 $\unicode[STIX]{x1D70F}_{min}<\unicode[STIX]{x1D70F}<\unicode[STIX]{x1D70F}_{2(opt)}$
is termed the effective time scale range for heat transfer. Note also that equation (8.2) is applicable only for production and peak cases as there is no proper way to compute
 $|\unicode[STIX]{x1D74E}_{th}^{\ast }|$
for the fully turbulent decay region.
(a) Variation of vorticity components in a shedding event, (b) variation of vorticity components in a non-shedding event, (c) conditional probability of
 $|\unicode[STIX]{x1D74E}^{\ast }|_{rz}\approx 10^{-3}$
.

Having identified the effective time scale range, the next step is to classify the shedding and non-shedding events based on this effective time scale range. To this end, the time scale events are further analysed using the instantaneous vorticity components decomposed with respect to the polar coordinates (similar to the velocity field). The radial, azimuthal and spanwise components of instantaneous vorticity are denoted as
 $\unicode[STIX]{x1D714}_{r}^{\ast }$
,
 $\unicode[STIX]{x1D714}_{\unicode[STIX]{x1D703}}^{\ast }$
and
 $\unicode[STIX]{x1D714}_{z}^{\ast }$
respectively. Variations of vorticity components in the shedding and non-shedding events are shown in figure 24(a,b) respectively. It is interesting to observe that the non-shedding event consists of all three components of vorticity, while the shedding event is dominated by the azimuthal vorticity component (
 $\unicode[STIX]{x1D714}_{\unicode[STIX]{x1D703}}^{\ast }$
). This observation is further checked for all the time scale events by computing the probability of time duration of events for which the radial and spanwise vorticity components are zero (i.e.
 $|\unicode[STIX]{x1D74E}^{\ast }|_{rz}\approx 10^{-3}$
, where
 $|\unicode[STIX]{x1D74E}^{\ast }|_{rz}=\sqrt{{\unicode[STIX]{x1D714}^{\ast }}_{r}^{2}+{\unicode[STIX]{x1D714}^{\ast }}_{z}^{2}}$
), and the result is presented in figure 24(c). This plot clearly shows that the probability of a dominating azimuthal component is maximum for the shedding events, and this probability decreases for increasing time scales. The vortical structures generated due to the vertical bars are predominately dominated by the azimuthal component. Now it is surmised that, for the shedding event, these vortical structures move fast and impinge on the cylinder with the same predominance as the azimuthal component. On the other hand, the predominance of the azimuthal component is lost for the long non-shedding events. Therefore, we classify the shedding events as the ones that have the time scale which is closer to that of vortex shedding and contain more than
 $50\,\%$
dominance of
 $\unicode[STIX]{x1D714}_{\unicode[STIX]{x1D703}}^{\ast }$
compared with the other two vorticity components. On the other hand, the non-shedding events are classified as the ones having large time scales and less than
 $50\,\%$
dominance of
 $\unicode[STIX]{x1D714}_{\unicode[STIX]{x1D703}}^{\ast }$
compared with
 $\unicode[STIX]{x1D714}_{r}^{\ast }$
and
 $\unicode[STIX]{x1D714}_{z}^{\ast }$
. Figure 21(c) also shows that more than 75 % of the effective time scale range (i.e.
 $\unicode[STIX]{x1D70F}_{min}<\unicode[STIX]{x1D70F}<0.75\unicode[STIX]{x1D70F}_{2(opt)}$
) is occupied by azimuthally dominated events (which also happen to be the shedding events). At the same time, there is also some contribution to the effective time scale range from the non-shedding events although the probability of such events is lower compared with the shedding events (see figure 22
d). In summary, the turbulent events of time scale
 $\unicode[STIX]{x1D70F}<0.75\unicode[STIX]{x1D70F}_{2(opt)}$
are the shedding events which have frequencies closer to
 $\unicode[STIX]{x1D719}_{\unicode[STIX]{x1D706}}$
and are dominated by azimuthal vortical structures. On the other hand, the turbulent events for which
 $\unicode[STIX]{x1D70F}>0.75\unicode[STIX]{x1D70F}_{2(opt)}$
represent the non-shedding events whose frequencies are much higher than
 $\unicode[STIX]{x1D719}_{\unicode[STIX]{x1D706}}$
and contain all vorticity components in their vortical structures.
Typical vortical structures of a non-shedding event. (a) While approaching the cylinder. (b) After having been stretched by the mean boundary layer. The three-dimensional region plotted in this figure has the dimensions
 $-1\leqslant y/D\leqslant 1$
,
 $-1\leqslant z/D\leqslant 1$
and
 $-1\leqslant x_{c}/D\leqslant 1$
.

While we have established that much of the heat transfer in the production case is due to azimuthal vortical flow, the underlying mechanism remains unclear. Analysing how vortical structures transfer heat from the cylinder surface can shed light on this mechanism. We also compare our mechanism with that of Hubble et al. (Reference Hubble, Vlachos and Diller2013). As mentioned earlier, the heat transfer in the production case is mostly due to shedding events, with a small contribution from the non-shedding events (i.e.
 $\unicode[STIX]{x1D70F}_{min}<\unicode[STIX]{x1D70F}<\unicode[STIX]{x1D70F}_{2(opt)}$
). The heat transfer mechanism for the non-shedding events is addressed first as it is similar to the one found in the literature. It was shown that the structures for the non-shedding events have all three vorticity components. Let us consider a turbulent event having a time scale greater than
 $\unicode[STIX]{x1D70F}_{2(opt)}$
.
A typical vortical structure approaching the cylinder in this non-shedding event is shown in figure 25(a). This vortical structure does not leave a footprint on the surface, even as it approaches the cylinder, so the
 $Nu$
contour on the wall is almost uniform (figure 25
a). This result closely resembles that of Hubble et al. (Reference Hubble, Vlachos and Diller2013) who reported that the proximity of the vortex influences the heat transfer. In figure 25(a), the vortex is relatively far from the cylinder surface compared with figure 25(b), and thus its effectiveness on heat transfer is limited. Once the vortical structure comes closer to the cylinder, it is stretched by the action of the accelerating boundary layer, the effect is felt on the surface; notice the larger
 $Nu$
in the location where the vortex lies (denoted as ‘A’ in figure 25
b), and smaller
 $Nu$
in other locations (points ‘B’ and ‘C’ in figure 25
b). This again validates the mechanism of Hubble et al. (Reference Hubble, Vlachos and Diller2013) that the vortex has a considerable role in heat transfer when it is very close to the surface. They also reported that the vorticity magnitude of the oncoming vortex increases when it approaches the cylinder. This also found to be valid in our case as figure 24(b) shows increase in vorticity magnitude during the approach process (i.e. from
 $tU_{inc}/D=2550$
to 2570). However, it is extremely difficult to measure vortex size and circulation in three-dimensional flows, and therefore the influence of these parameters is not discussed here. Yet, one can apply the Taylor hypothesis to the time scale events and conclude that the large vortical structures are of little importance in heat transfer enhancement.
In summary, in the case of non-shedding events, the oncoming vortex does not contribute much to heat transfer, unless it is stretched by the accelerating boundary layer. Note also that the vortex is stretched in the azimuthal direction causing an increase in azimuthal vorticity while reducing the other two components. Due to this, the free-stream cold fluid is transported towards the cylinder, and the hot fluid from the surface is transported away. The aforementioned stretching mechanism by the boundary layer is similar to the hypothesis proposed by Hunt (Reference Hunt1973) based on rapid distortion theory, and it is similar to the one observed in the simulations of Wissink & Rodi (Reference Wissink and Rodi2006), Xiong & Lele (Reference Xiong and Lele2007) and Bhaskaran & Lele (Reference Bhaskaran and Lele2010).
Typical vortical structures of a shedding event. (a) While approaching the cylinder. (b) After having been stretched by the mean boundary layer. The three-dimensional region plotted in this figure has the dimensions of
 $-1\leqslant y/D\leqslant 1$
,
 $-1\leqslant z/D\leqslant 1$
and
 $-1\leqslant x_{c}/D\leqslant 1$
.

Attention is now turned to the heat transfer mechanism for the shedding events which have more than 50 % of
 $\unicode[STIX]{x1D714}_{\unicode[STIX]{x1D703}}$
dominance (i.e.
 $\unicode[STIX]{x1D70F}<0.75\unicode[STIX]{x1D70F}_{2(opt)}$
). A typical vortical structure of a shedding event approaching the cylinder is depicted in figure 26(a). An interesting observation can be made. The heat transfer on the cylinder is clearly affected by the presence of the vortex even before this is stretched by the accelerating boundary layer. The
 $Nu$
contour on the cylinder wall is not uniform, and the largest values align with the vortex direction (point ‘A’ in figure 26
a) and the smallest values are on the flanks of the vortex (points ‘B’ and ‘C’). This can be attributed to the fact that the azimuthal vortex transports fluid perpendicular to the cylinder surface causing an effective heat transfer from the cylinder. This mechanism is similar to the one observed for the vortex-ring–wall interaction in the experimental study of Hubble et al. (Reference Hubble, Vlachos and Diller2013). Here, the stagnation point always feels the effect of down-wash as the approaching vortex is azimuthally dominant. The effectiveness of this vortex is further increased when the mean accelerating flow acts on it (by means of stretching) along the cylinder surface as seen in figure 26(a). This stretching increases further the azimuthal vortical strength causing even higher heat transfer in areas that align with the vortex (point ‘A’ in figure 26
b). This heat transfer mechanism is different to the previously noted mechanism for the non-shedding event as the approaching vortex contributes to heat transfer even before it gets stretched.
Therefore, the shedding events, which consist of a dominant azimuthal vortical component, increase heat transfer even without the help of the mean accelerating flow. In this respect, turbulence in the production case is unique: firstly the boundary layer is receptive to the shedding frequency, and secondly the flow is dominated by shedding events that carry mostly azimuthal vorticity which is very effective in transferring heat. These characteristics explain why the production case has much higher heat transfer rate than the decay case although the oncoming turbulence intensities are similar.
We also extended this time scale analysis to the production case at
 $z/D=\pm 5$
and the peak case. We noted that the intermittency level decreases for both the cases, and thus the number of shedding events is smaller when performing the time scale separation analysis. Yet, we observed once again that the shedding events have higher heat transfer due to their azimuthal vorticity dominance. Therefore, the results presented in this subsection are also applicable to the production case at
 $z/D=\pm 5$
and to the peak case. In these two cases, the heat transfer is because of the dominance of azimuthal vorticity component associated with the shedding events combined with higher turbulence intensity. On the other hand, the time scale separation analysis is not applicable to the decay case as it is fully turbulent and
 $|\unicode[STIX]{x1D74E}_{th}^{\ast }|$
cannot be determined. However, the heat transfer mechanism discussed for the non-shedding event is valid for the decay case. This is the same mechanism also reported in the literature.
9 Comparison with high Reynolds number experiments
In this section, the observations of this DNS study are compared with the experimental study of Melina et al. (Reference Melina, Bruce, Hewitt and Vassilicos2017). The lowest Reynolds number of these experiments is
 $Re_{D}=11\,100$
. Two significant differences are noted: first the decay region of the experiment was observed to have higher heat transfer than the production region, although the locations examined in both the regions had approximately similar turbulence intensity. Secondly, the maximum heat transfer coefficient was observed at the front stagnation point unlike the shift of approximately
 $45^{\circ }$
observed in this DNS study. These two differences are explained below.
Regarding the heat transfer rates in the decay and production cases, equation (7.1) predicts that the value of
 $\unicode[STIX]{x1D719}_{\unicode[STIX]{x1D706}}$
scales with the square root of Reynolds number. It appears that in the high Reynolds number experiment of Melina et al. (Reference Melina, Bruce, Hewitt and Vassilicos2017), the dominant frequency is higher and is located in an area of the spectrum that is less energetic. Therefore, in the experiments, the characteristics of turbulence in the production case are not as effective compared to the present low Reynolds number DNS, and that is why the production case exhibits lower heat transfer than the decay case.
The second difference can also be explained based on the dominant frequency concept and figure 17. Notice in figure 17(a) that the shift in
 $\langle Nu\rangle _{max}$
is more prominent only along the grid-element centreline where the dominant frequency of the fluctuations is more energetic. Along the bar centreline, where the oncoming turbulence intensity is much higher, the shift in
 $\langle Nu\rangle _{max}$
is less prominent. Turbulence intensity increases along the azimuthal direction from the front stagnation point to a certain angle due to the presence of the grid-element bars for the production case (see figure 8). Due to higher values of turbulence intensity along with an energetic dominant frequency,
 $\langle Nu\rangle _{max}$
is shifted by
 $45^{\circ }$
from the front stagnation point. On the other hand, in the experiments, although the turbulence intensity also increases along the azimuthal direction from the front stagnation point, this increase becomes less effective as the laminar boundary layer is not receptive. Due to this, the experiments (as well the bar centreline of the simulations) have a near-constant or a slow decay of
 $\langle Nu\rangle$
from the front stagnation point to
 $45^{\circ }$
.
10 Conclusions
This paper presented the first ever DNS study devoted to the investigation of the effect of different regions in the wake of a grid-element on the heat transfer from a circular cylinder. Unlike previous studies, this paper has a single square grid-element to generate turbulence upstream of the cylinder. Due to the fine resolution requirements for the grid-element and cylinder, the simulations have been carried out for small Reynolds number. The cylinder is placed at three distinct locations downstream of the grid-element, namely the production, peak and decay regions. In order to make meaningful comparisons between these regions, the turbulence intensity of the production and decay regions is kept similar. The peak case has the highest turbulence intensity of 15 %, while the production and peak cases have a turbulence intensity of 11 %.
The oncoming turbulence in the production and peak regions is identified to have the following characteristics: non-Gaussian, inhomogeneous and intermittent. On the other hand, the turbulence in the decay region is Gaussian, homogeneous and fully turbulence.
There are three important take-away results from this study. The first is related to the heat transfer rate between different regions of grid-element. It is established that the production region has the highest heat transfer increase although its turbulence intensity is the same as that of the decay region. The second important result is on the existing stagnation point heat transfer correlations. It was found that the production and peak turbulence cases do not satisfy the existing correlations, but the decay case does fulfil the correlation. Note that this is the first DNS study that reports invalidity of such correlations. The final important finding concerns the maximum heat transfer on the surface of the cylinder. It is found that the maximum occurs around
 $45^{\circ }$
away from the front stagnation point even in the decay case where the turbulence is nearly homogeneous.
We explored why the production and peak turbulence cases have different heat transfer increase compared to the previously reported studies. It is found that the turbulence in the production and peak regions is unique, in the sense that the dominant boundary layer frequency (
 $\unicode[STIX]{x1D719}_{\unicode[STIX]{x1D706}}$
) lies closer to the vortex shedding frequency. This makes the boundary layer very susceptible to the impinging disturbances. Besides this, the flow is dominated by short time scale shedding events (i.e. turbulence events where
 $\unicode[STIX]{x1D70F}<0.75\unicode[STIX]{x1D70F}_{2(opt)}$
) that have time scales of the order of the shedding time scale. These shedding events mainly carry azimuthal vorticity, which increases the heat transfer even before it is stretched by the mean accelerating boundary layer. These two unique characteristics results in very high increase of heat transfer, thus making the existing stagnation point heat transfer correlations invalid for the production and peak regions.
The answer for why the maximum heat transfer is shifted away from the front stagnation point is explored through statistical analysis of the Nusselt number. Our results show that additional intense events occur at the maximum heat transfer point compared to the front stagnation point. It is believed that the presence of the grid-element bars gives rise to occurrence of such additional intense events.
As a final comment, our DNS provides evidence of different heat transfer enhancement when fluctuations with the same turbulence intensity have different spectral content. We suggest that in order to gain maximum increase in heat transfer, the flow should be tuned so that the fluctuating energy is concentrated in the frequency band that maximises the receptivity of the boundary layer developing in the solid body. This result can be exploited for engineering applications such as optimal extraction of heat transfer in a heat exchanger.
Acknowledgements
This research project was funded by the European Commission through MULTISOLVE (grant agreement no. 317269) under the Initial Training Networks-ITN Marie Curie framework. The simulations were carried out on the facilities of ARCHER, the UK national high-performance computing service, under the grant EP/L000261/1 of the UK Turbulence Consortium (UKTC), and on the High Performance Computing Service of Imperial College London. J.C.V. acknowledges support from ERC Advanced grant no. 320560.



