



1. Introduction
There exist many deformation models for liquid droplet in air flow or in liquid flow. Most of them are based on simple assumptions, however. The oldest, such as the models of Lamb (Reference Lamb1932) and Miller & Scriven (Reference Miller and Scriven1968) are based on linear instability theory involving spherical harmonics. This leads to the droplet's natural oscillations due to surface tension force, which is valid for low Weber number, as in Becker, Hiller & Kowalewski (Reference Becker, Hiller and Kowalewski1991), Stückrad, Hiller & Kowalewski (Reference Stückrad, Hiller and Kowalewski1993), Becker, Hiller & Kowalewski (Reference Becker, Hiller and Kowalewski1994) and Abi Chebel et al. (Reference Abi Chebel, Vejraka, Masbernat and Risso2012).
Another class of models has been devised, mostly adapted to higher Weber regime where the droplet, initially at rest, is exposed to an outer flow and can eventually break. Among them, the Taylor analogy breakup (TAB) model (O'Rourke & Amsden Reference O'Rourke and Amsden1987) circumvents difficulties in modelling by building the oscillator equation from dimensional analysis and fitting coefficients; for instance using Lamb's oscillation frequency. However, simple this modelling may be (cf. appendix A.1), this is, yet, one of the most used models today in so-called atomisation modelling. In an attempt to deepen our understanding of the underlying physics, the droplet deformation and breakup (DDB) model (Ibrahim, Yang & Przekwas Reference Ibrahim, Yang and Przekwas1993) considers large deformations of the droplet and is based on an energy balance between kinetic energy of deformation, surface energy creation, external pressure work and viscous dissipation. However, the DDB model leads to very strange conclusions when considering low Weber number deformation and oscillations (cf. appendix A.2). In most of these models, the deformation of the droplet is not fully taken into account, either due to the linearisation process (mostly around spherical shape) or just for the sake of simplicity. For instance, the DDB model assumes that the aerodynamic pressure acts on the un-deformed droplet. However, it is well known that it is the pressure difference between the centre of the drop and its edge that governs its deformation (Moore Reference Moore1959; Villermaux & Bossa Reference Villermaux and Bossa2009) and this pressure difference increases precisely when the droplet deforms. This latter work has been extended to the viscous case and to a system of two equations to describe the two dimensions of bag breakup by Kulkarni & Sojka (Reference Kulkarni and Sojka2014). More recently, Sichani & Emami (Reference Sichani and Emami2015) have used the virtual work principle to study bag breakup of a droplet. All these works, however, involve somewhere some empirical modelling and parameter fitting.
The present work is focused on following the DDB framework, assuming that the droplet follows a spheroidal path of deformation (with one degree of freedom) and makes an energy balance between kinetic energy of deformation, surface energy creation, external pressure work and viscous dissipation inside the droplet. Part of the present procedure was already attempted in Schmehl (Reference Schmehl2002) but this work contained some issues that will be corrected here. The main difference is that every coefficient of the present model is given in a closed analytic form. As in Schmehl (Reference Schmehl2002), both oblate and prolate spheroids will be considered as they are sometimes observed in direct numerical simulation (Han & Tryggvason Reference Han and Tryggvason1999). In the present work, empirical modelling will be kept at a minimal level (mainly by considering different configurations or using some simplifying assumptions). The most important (and new) physical hypothesis is that the pressure is computed around the deformed spheroidal droplet using potential flow theory. Moreover, in order to obtain an analytical model for the different coefficients involved in the oscillator equation, the work of Benjamin (Reference Benjamin1987), which allows for the simple computation of an analytical equilibrium shape of a spheroidal bubble in an outer flow, will be used.
Before delving too deeply into the equations, § 2 of this paper is devoted to a qualitative presentation of the problem, showing that prolate spheroid should always be unstable but that oblate spheroid can be stable. It also introduces the proper time scale and shows how the Weber number is the most important non-dimensional number for the present case. Section 3 describes present modelling, including potential flow around both oblate and prolate spheroids and analytical derivations of the kinetic energy of the deformation terms, of the viscous term, of the surface energy terms and the carrier fluid pressure work. Section 4 analyses the nonlinear ordinary differential equation obtained for the droplet deformation and some of its sequels. Section 5 considers a linearised version of the ordinary differential equation and analyses the stability of the linearised systems and of the steady states. Limit domain and frequency of the oscillations are given as a function of Weber and Ohnesorge numbers. Comparison is made with previously published results on the oscillation frequency of falling rain droplets at terminal velocity or of some liquid–liquid cases and some new direct numerical simulation (DNS) results in the liquid–liquid metal case. Section 6 describes the liquid–liquid metal DNS simulations and, more importantly, shows the similarity and the discrepancy between these DNS and present analytical model, showing the intrinsic limitation of present, and also of all former, models. Lastly, comparison of the breakup dynamics of a droplet in gas with either DNS or experiments (shock tube, cross-flow) is presented in § 7. The result is a single analytical framework giving approximations for the steady deformation, oscillation frequency, stability limit and breakup time of a droplet set in a uniform exterior flow.
2. Qualitative modelling
Physical principles behind the large deformation of a droplet/globule initially at rest in a fluid flow are very simple (Moore Reference Moore1959): due to the Bernoulli effect, pressure increases on the stagnation point while pressure decreases on the edges of the droplet, this pressure difference creates a flow inside the droplet, from the stagnation point to the edge, inflating the droplet into a spheroid or disc shape. This analysis neglects viscosity effects but is adequate to describe the short-time behaviour of the droplet. Actually, putting these considerations into an equation can lead to a very simple linear oscillation equation. Villermaux & Bossa (Reference Villermaux and Bossa2009) develop this idea for a disc-shaped deformed droplet (neglecting the squared edge and assuming the external flow field potential) but it can be extended to either an oblate or a prolate spheroidal droplet. As far as free fall droplets are concerned, their equilibrium shapes are known to be far from spheroidal (Beard & Chuang Reference Beard and Chuang1987), therefore this can also be considered as an approximation.
Let us assume that a liquid droplet (whose properties will be denoted using the subscript  $L$) of initial radius
 $R_0$ deforms, thanks to the action of an external carrier fluid (cf. figure 1) (whose properties will be subscripted
 $C$), homothetically into a spheroid of semi-axes
 $a$ and
 $b$ (
 $a$ is the length of the two semi-axes of equal length while
 $b$ is the length of the third one, if
 $a>b$ the spheroid is said to be oblate while if
 $b>a$ it is said to be prolate). Volume conservation therefore ensures that
 \begin{equation} \tfrac{4}{3}{\rm \pi} a^2 b = \tfrac{4}{3}{\rm \pi} R_0^3. \end{equation}
With this hypothesis, the droplet has only one deformation parameter which will be the deformed droplet meridian radius, normalised, and denoted  $y$, as can be seen in figure 1 (note that
 $y= a/R_0$). Note that the droplet deforms continuously from the prolate (
 $y<1$) to the oblate (
 $y>1$) state when
 $y$ increases. Likewise, the normalised droplet half-length along the flow
 $z$-axis will be denoted
 $h=b/R_0$ and volume conservation now reads
 \begin{equation} y^2h=1. \end{equation}
Here, ( $r, \theta , z$) are cylindrical coordinates along the air flow direction. Using the Bernoulli equation, one gets for the pressure
 $P_+$ on the stagnation point
 \begin{equation} {P_ + } = {P_\infty } + {\tfrac{1}{2}}{\rho _C}U_\infty^2, \end{equation}
and for the pressure  $P_-$ on the edge of the droplet
 \begin{equation} {P_ - } + \tfrac12 {\rho _C}{\lambda^2}U_\infty^2 = {P_\infty } + \tfrac12 {\rho _C}U_\infty^2, \end{equation}
where  $\rho _C$ is the carrier fluid density and
 $\lambda$ is a coefficient corresponding to the velocity increase on the edge of the droplet (e.g. 1.5 for the sphere cf. Batchelor Reference Batchelor2000). Introducing the droplet surface tension
 $\sigma$ and using the Laplace equation, the pressure inside the droplet
 $P^{(i)}$ reads, for an oblate spheroid using the mean curvature of an ellipsoid (cf. Darboux Reference Darboux1915, p. 392)
 \begin{gather} P_ + ^{(i)} = {P_ + } + \sigma \frac{{b}}{a^2}, \end{gather}
 \begin{gather}P_ - ^{(i)} = {P_ - } + \sigma \frac{a}{2} \left( {\frac{1}{b^2} + \frac{1}{a^2}} \right). \end{gather}
The droplet is in equilibrium when
 \begin{equation} P_ + ^{(i)} = P_ - ^{(i)}. \end{equation}
Introducing the Weber number for the carrier fluid,
 \begin{equation} We = We_C = \frac{{\rho _C U_\infty^2 2R_0 }}{\sigma }, \end{equation}
we must therefore find solutions (for both oblate and prolate cases) to
 \begin{equation} \frac{{\lambda {{( y )}^2}}}{4}We = \frac{( ({{y^6+1})y^3-2} )}{y^4}, \end{equation}
where  $\lambda ( y )$ is still unknown (but likely to be monotonically increasing with
 $y$). It can be seen that prolate shapes (
 $y<1$) lead to a negative right term in (2.9) while the left term should be positive; they should therefore never be observed as steady states. To determine the equilibrium shape of an oblate droplet, knowledge of the function
 $\lambda$ is needed. This can be achieved by assuming a potential flow around the droplet. However, we will not follow this ‘two-point’ route as a more complete and developed model will be devised in the next section.
Hypothesis of the deformation of the droplet into an oblate spheroid in a surrounding uniform flow field.

Note that when writing (2.3) or (2.4), the unsteady term has been neglected in the Bernoulli equation; however, the problem of oscillation of a droplet is time dependent. When the droplet deforms and oscillates, time variation of the velocity potential  $\varphi$ can be assumed to be of the order of
 \begin{equation} \frac{{\partial \varphi }}{{\partial t}} \cong \frac{{{U_\infty }2{R_0}}}{{{\tau}}}, \end{equation}
where the oscillation characteristic time can be approximated by  $\tau$, the characteristic Ranger & Nicholls (Reference Ranger and Nicholls1969) time (which governs the fragmentation time of a droplet in an air stream)
 \begin{equation} \tau = \sqrt {\frac{{\rho _L }}{{\rho _C }}} \frac{{2R_0 }}{{U_\infty }}. \end{equation}
Origin of this characteristic time can be found using the present simplified analysis. For the oblate case, it is possible to estimate the magnitude  $V$ of the velocity inside the droplet by
 \begin{equation} \frac12 {\rho _L}{V^2} = P_ + ^{(i)} - P_ - ^{(i)} = \frac12 {\rho _C}{\lambda^2}{U_\infty^2} + \sigma \left( {\frac{b}{a^2} - \frac{a}{2}} \left( \frac{1}{a^2}+\frac{1}{b^2}\right) \right). \end{equation}
So that, for large Weber number, neglecting the surface tension effects,
 \begin{equation} V \approx \sqrt {\frac{{{\rho _C}}}{{{\rho _L}}}} {U_\infty }, \end{equation}
is the deformation velocity of the droplet and  $\tau = 2R_0/V$ is the characteristic time. Note that Rayleigh’s characteristic oscillation time
 $t_R$ can also be recovered from (2.12) by setting
 $U_\infty = 0, a = b = R_0$, leading to
 \begin{equation} t_R = \sqrt {\frac{{\rho _L R_0^3}}{{\sigma }}}. \end{equation}
As both time scales behave like  $\tau / t_R \propto 1.27 We^{-1/2}$ (Gelfand Reference Gelfand1996),
 $\tau$ increasingly becomes the shorter time when the Weber number increases.
Therefore, using the correct characteristic time  $\tau$, it is possible to consider that
 \begin{equation} \rho_C \frac{{\partial \varphi }}{{\partial t}} \ll \frac{1}{2}{\rho _C}U_\infty^2, \end{equation}
when
 \begin{equation} {\rho _L}/{\rho _C} \gg 4, \end{equation}
which is usually the case in gas–liquid experiments but is infrequent in liquid–liquid experiments and needs usually a very dense droplet (note that liquid metal droplets in water may fall into this category). Note that other possibilities exist when balancing or neglecting the unsteady terms (cf. appendix B). Nevertheless, with this hypothesis, it is possible to model the droplet deformation as a sequence of steady states where the flow field around the droplet adjusts almost instantaneously to the new droplet shape.
3. New droplet deformation and oscillation model
The following section focuses, as implied in the introduction, on a more detailed modelling of the droplet deformation based on the energy approach. Hypotheses of § 2 will be kept, among which, that the droplet does deform into a spheroid. Along this fixed path of deformation, it is possible to make an energy balance in the droplet's centre of mass reference frame (and assuming a constant velocity lag between the droplet and the surrounding fluid)
 \begin{equation} \frac{{\textrm{d} T_L}}{{\textrm{d} t}} + \frac{{\textrm{d} E_S }}{{\textrm{d} t}} = \dot{W}_P - D, \end{equation}
where  $T_L$ is the kinetic energy of the drop deformation,
 $E_S$ its surface energy,
 $\dot {W}_P$ the pressure power on the droplet and
 $D$ is the viscous dissipation due to internal flow inside the droplet. In this work, viscous dissipation of the outer potential flow will not be considered, as it mainly contributes to deceleratation of the droplet (cf. appendix C) and we will make either a short- or a long-time assumption by neglecting the induced variation of the velocity. Assuming that the droplet deforms homothetically into a spheroid of equal volume yields the following inner velocity field
 \begin{equation} {\boldsymbol{V}} = \frac{{\dot y} }{y}r{\boldsymbol{e}}_{\boldsymbol{r}} - 2\frac{{\dot y} }{y}z{\boldsymbol{e}}_{\boldsymbol{z}} , \end{equation}
for both an oblate and a prolate spheroid (the factor 2 in (3.2) stems from the fact that ‘two’ radii or semi-axes are feeding ‘one’ when the spheroid deforms). As the flow is assumed to be bi-dimensional and axisymmetric, the  $\theta$ coordinate is not taken into account in the remaining. Lastly, this model does not include the famous Hill's vortex (Hill Reference Hill1894) in the inner flow field. This mainly concerns droplets falling at terminal velocity, however. Note that these hypotheses (neglecting the boundary layer at the interface, Hill's vortices, assuming potential flows) are mainly made to keep the model simple enough to be solved analytically and should be validated by confrontation with experiments and DNS. Having set the flow field inside the droplet allows for computing both terms
 $T_L$ and
 $D$.
3.1. Kinetic energy term
By definition, the kinetic energy of deformation of the droplet is
 \begin{equation} T_L = \tfrac{1 }{2}\rho _L {\iiint}_{{V( t )}} {{\boldsymbol{V}}^{{2}}\, \textrm{d}^3 x}, \end{equation}
where  $V(t)$ is the volume occupied by the droplet. This integral can be computed once the velocity field is known. Using (3.2), one gets, for the oblate case,
 \begin{equation} T_L = \frac{1 }{2}\rho _L \left( {\frac{{\dot y} }{y}} \right)^2 \iint_{Ellipse(yR_0 ,R_0 /y^2 )} {( {r^2 + 4z^2 } )2{\rm \pi} r\, \textrm{d} r\, \textrm{d} z} = \frac{2 }{3}{\rm \pi}\rho _L R_0^5 K_C ( y )\left( {\frac{{\dot y} }{y}} \right)^2 , \end{equation}
where the non-dimensional term  $K_C$ should be of order unity. This leads to
 \begin{equation} K_C^O( y ) = \frac{4}{5}\frac{{2 + {y^6}}}{{{y^4}}}, \end{equation}
where the superscript letter  $O$ indicates oblate deformation. However, in order to later develop a simplified model, it will be more convenient to develop
 $K_C$ around the spherical shape using the new deformation parameter
 $\varepsilon = y-1 \ll 1$,
 \begin{equation} \tilde K_C^O( \varepsilon ) = K_C^O( {1 + \varepsilon } ) = \tfrac{{12}}{5} - \tfrac{{24}}{5}\varepsilon + \tfrac{{84}}{5}{\varepsilon^2} + O( {{\varepsilon ^3}} ), \end{equation}
where the notation  $\tilde {K}(\varepsilon )=K(y)$ has been used. Relevance of this linearisation (when restricted to first order) will be discussed throughout the text. In the case of deformation into a prolate spheroid (
 $\varepsilon <0$), one gets
 \begin{equation} K_C^P( y ) = \frac{4}{5}\frac{{1 + 2{y^{12}}}}{{{y^4}}}, \end{equation}
where the superscript  $P$ indicates prolate deformation and
 \begin{equation} \tilde K_C^P( \varepsilon ) = K_C^P( {1 + \varepsilon } ) = \tfrac{{12}}{5} + \tfrac{{48}}{5}\varepsilon + \tfrac{{264}}{5}{\varepsilon^2} + O( {{\varepsilon ^3}} ). \end{equation}
Note that  $K_C(1)=\tilde {K}_C(0) = 2.4$ in both cases and is of order unity. Note also that, while
 $K_C$ is continuous in 1, its derivatives are not. Lastly, note that these values may be slightly underestimated for a droplet falling at terminal velocity since the inner vortices are not included.
3.2. Viscous dissipation term
Likewise, the viscous dissipation due to internal flow can be estimated through
 \begin{equation} D = \mu _L \int_V {\frac{{\partial V_i } }{{\partial x_j }}\frac{{\partial V_i } }{{\partial x_j }}}\, \textrm{d}^3 x. \end{equation}
In the case of a purely extensional flow, as given by (3.2), the computation leads to
 \begin{equation} D = \mu _L \iiint_{{S( y )}} {12\left( {\frac{{\dot y} }{y}} \right)^2 \, \textrm{d}^3 x} = 16{\rm \pi} R_0^3 \mu _L \left( {\frac{{\dot y} }{y}} \right)^2 . \end{equation}
This is exactly the result given by Schmehl (Reference Schmehl2002) and, similarly, only the value of the constant coefficient in (3.10) differs from the original DDB model.
3.3. Surface energy term
Surface of an oblate ellipsoid is given by the exact formula
 \begin{equation} S = 2{\rm \pi} a^2 + {\rm \pi}\frac{{b^2 } }{e} \log \left( {\frac{{1 + e} }{{1 - e}}} \right), \end{equation}
where eccentricity  $e$ is given by
 \begin{equation} e = \sqrt {1 - \frac{{b^2 } }{{a^2 }}}. \end{equation}
Note that  $e$ relates to the other deformation parameters as
 $e=\sqrt { 1- {1}/{y^6}} \approx \sqrt {6\varepsilon }$. Time variation of surface energy can now be expressed as
 \begin{equation} \frac{{\textrm{d} E_S } }{{\textrm{d} t}} = \sigma \frac{{\textrm{d} S } }{{\textrm{d} y}}\frac{{\textrm{d} y} }{{\textrm{d} t}} = \sigma 4{\rm \pi} R_0^2 K_S ( y ) \frac{{\dot y} }{y}. \end{equation}
When  $1 < y$, the non-dimensional surface energy function
 $K_S$ is equal to
 \begin{equation} K_S^O( y ) = \frac{{2{y^5}\sqrt {\dfrac{{ - 1 + {y^6}}}{{{y^4}}}} ( {1 + 2{y^6}} ) + ( {1 - 4{y^6}} )\log \left[ { - 1 + 2{y^5}\left( {y + \sqrt {\dfrac{{ - 1 + {y^6}}}{{{y^4}}}} } \right)} \right]}}{{4{y^7}{{\left( {\dfrac{{ - 1 + {y^6}}}{{{y^4}}}} \right)}^{3/2}}}}, \end{equation}
and can be approximated by
 \begin{equation} \tilde K_S^O( \varepsilon ) = K_S^O( {1 + \varepsilon } ) = 0 + \tfrac{{16}}{5}\varepsilon + \tfrac{{24}}{{35}}{\varepsilon^2} + O( {{\varepsilon^3}} ). \end{equation}
Likewise, considering that the formula for the surface of a prolate spheroid is
 \begin{equation} S = 2{\rm \pi} {a^2}\left( {1 + \frac{b}{{ae}}\arcsin e} \right), \end{equation}
this leads to the exact formula
 \begin{equation} K_S^P( y ) = - \frac{{{y^3}\sqrt {1 - {y^6}} ( {1 + 2{y^6}} ) + ( {1 - 4{y^6}} )\arccos [ {{y^3}} ]}}{{2y{{( {1 - {y^6}} )}^{3/2}}}}. \end{equation}
One gets as an approximation, when  $\varepsilon < 0$,
 \begin{equation} \tilde K_S^P( \varepsilon ) = K_S^P( {1 + \varepsilon } ) = 0 + \tfrac{{16}}{5}\varepsilon + \tfrac{{24}}{{35}}{\varepsilon^2} + O( {{\varepsilon^3}} ). \end{equation}
Note that  $K_S$ is negative in the prolate case (
 $\varepsilon < 0$), as when
 $y$ decreases i.e.
 $\dot {y}<0$, the surface energy should still increase over time (i.e. the product
 $K_S \dot {y} > 0$), as the sphere is the volume of minimal surface. Note also that the identity of developments (3.15) and (3.18) shows that the coefficient
 $K_S$ is at least
 $C^2$ smooth around the spherical shape.
3.4. Carrier fluid pressure term
Carrier fluid pressure term is actually the gist of the present droplet oscillator model. When a droplet oscillates, deforms and eventually breaks up in an exterior flow field, the Reynolds number is usually not small and it is therefore possible to make the assumption that the carrier fluid flow around the drop is a potential flow. Classical analytical results for potential flow around a spheroid can therefore be used (Lamb Reference Lamb1932; Milne-Thomson Reference Milne-Thomson1968). This is not a new idea, as the possibility for the flow to be potential on the upwind side of a falling droplet has been emphasised for some time (cf. Fuchs (Reference Fuchs1964) for instance). However, on the downwind side, flow separation is to be expected; therefore, two hypotheses will be developed hereafter: one will assume that the pressure works symmetrically on the two sides of the droplet ( $C_P=1$) whereas the second will assume that the pressure only works on the forward half of the droplet (
 $C_P=1/2$).
Using Stokes’ axisymmetric streamfunction  $\psi$, the velocity field can be computed with
 \begin{equation} U_{{z}} = \frac{{ - 1}}{r}\frac{{\partial \psi }}{{\partial r}} \quad \textrm{and} \quad U_{{r}} = \frac{1}{r}\frac{{\partial \psi }}{{\partial z}}, \end{equation}
and the streamfunction  $\psi$ is given, in the droplet frame of reference, by
 \begin{align} \psi &= \frac{{ - \frac12 U_\infty ( {a^2 - b^2 } )} }{{e\sqrt {1 - e^2 } - \textrm{Sin}^{ - 1} ( e )}}( \textrm{Sinh} ( \xi ) - \textrm{Cosh}^2 ( \xi )\textrm{Cot}^{-1} ( \textrm{Sinh} (\xi)))\textrm{Sin}^2 ( \eta )\nonumber\\ &\quad - \frac{1}{2}U_\infty r( {\xi ,\eta } )^2 , \end{align}
where spheroidal coordinates  $(\xi ,\eta )$ are obtained from the cylindrical coordinates
 $(r,z)$ through the conformal mapping
 \begin{equation} z + ir = \sqrt {a^2 - b^2 } \textrm{Sinh} ( {\xi + i\eta } ). \end{equation}
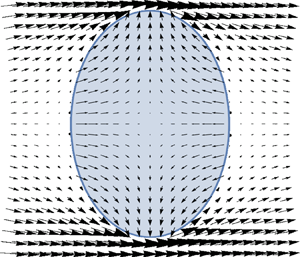
Note that (3.21) must be inverted (analytically) before using (3.19a,b) and (3.20). Figure 2 shows the resulting potential flow. Pressure power is then computed using (cf. appendix D for details of the approximation)
 \begin{equation} \dot{W}_P = - \mathop{{\int\!\!\!\!\!\int}\mkern-21mu \bigcirc}\limits_{\partial V} {P( {{\boldsymbol{V}}{\boldsymbol{\cdot} \boldsymbol{n}}} )\, \textrm{d} S} \approx 2\rho _C \int_0^a {\tfrac12 {\boldsymbol{U}}^2 ( {{\boldsymbol{V}}{\boldsymbol{\cdot} \boldsymbol{n}}} )2{\rm \pi} r\, \textrm{d} l(r)} , \end{equation}
where  $\boldsymbol {n}$ is the outer normal to the spheroid and
 $\textrm {d} l(r)$ a small length increase along the ellipse generating the ellipsoid. Note that introducing Hill's vortex should not change this value as
 ${\boldsymbol {V}}_{Hill}\boldsymbol {\cdot } \boldsymbol {n} = 0$. Note also that
 $\dot {W}_P$ should be positive for the droplet to deform, (note also that this is one of the main differences from Schmehl (Reference Schmehl2002)). When the droplet deforms into a spheroid, this integral can be given the form
 \begin{equation} \dot{W}_P = \rho _C U_\infty^2 {\rm \pi}R_0^3 C_P K_P ( y ) \frac{{\dot y} }{y}, \end{equation}
where non-dimensional function  $K_P$ is also expected to be of order unity;
 $C_P$ is a coefficient whose value equals either 1 or
 $1/2$, respectively, if the pressure work is computed on the whole droplet or only on the forward half of the droplet. Deriving a closed form for
 $K_P$ in (3.23) is a little tricky; therefore, as a first approach, a polynomial interpolation of the value of
 $K_P$ in the range
 $1< y < 3$ has been computed with
 $Mathematica$ (Wolfram Research, Inc 2014)
 \begin{equation} K_P^O( y ) \approx 0.171103 - 0.924041y + 1.21925{y^2} + 0.473157{y^3} + 0.263002{y^4}. \end{equation}
Although a way of computing the exact expression will be presented now, this polynomial approximation is naturally smooth when  $y \to 1$, paradoxically this may not be the case (numerically) when using the exact expression, as there is a singularity in the conformal transformation (3.21) when
 $a \to b$. Therefore, the polynomial interpolation will be mainly used in the numerical solution of the oscillator equation.
Axisymmetric potential flow around an oblate spheroid. Inner deformation field corresponding to (3.2) is also illustrated. Velocity is computed using the formulas (3.19a,b), (3.20) and (3.21). Note that norm of the velocity vectors inside the droplet is arbitrary as it should be the result of the final oscillator equation.

As stated, it is possible to derive an analytical solution (cf. appendix E). The final result is
 \begin{equation} K_P^O( y ) = \frac{{6 - 6{y^6} + 2\sqrt {1 - \dfrac{1}{{{y^6}}}} {y^3}( {2 + {y^6}} )\textrm{Arcsec} [ {{y^3}} ]}}{{{{\left( {\sqrt {1 - \dfrac{1}{{{y^6}}}} - {y^3}\textrm{Arcsec} [ {{y^3}} ]}\right)}^2}}}, \end{equation}
which can be approximated by
 \begin{equation} \tilde K_P^O( \varepsilon ) = K_P^O( {1 + \varepsilon } ) = \tfrac{6}{5} + \tfrac{{684}}{{175}}\varepsilon + \tfrac{{3366}}{{875}}{\varepsilon^2} + O( {{\varepsilon ^3}} ). \end{equation}
For the prolate case ( $y < 1$), (cf. appendix F) this equation reads
 \begin{equation} K_P^P( y ) = - \frac{{4{y^6}\sqrt {1 - {y^6}} \left( {6\sqrt {1 - {y^6}} + ( {2 + {y^6}} )\log \left[ { - \dfrac{{ - 2 + {y^6} + 2\sqrt {1 - {y^6}} }}{{{y^6}}}} \right]} \right)}}{{{{\left( {2\sqrt {1 - {y^6}} + {y^6}\log \left[ { - \dfrac{{ - 2 + {y^6} + 2\sqrt {1 - {y^6}} }}{{{y^6}}}} \right]} \right)}^2}}}, \end{equation}
which can be linearised into
 \begin{equation} \tilde K_P^P( \varepsilon ) = K_P^P( {1 + \varepsilon } ) = \tfrac{6}{5} + \tfrac{{684}}{{175}}\varepsilon + \tfrac{{3366}}{{875}}{\varepsilon^2} + O( {{\varepsilon ^3}} ). \end{equation}
Note that, again, the identity of developments (3.26) and (3.28) shows that the coefficient  $K_P$ is at least
 $C^2$ smooth around the spherical shape.
4. Nonlinear oscillator
4.1. Nonlinear ordinary differential equation
The final equation is obtained by combining (3.1), (3.4), (3.10), (3.13) with (3.23). Using the Weber and Ohnesorge numbers as dimensional numbers, one gets the following oscillator equation:
 \begin{equation} \frac{\textrm{d}}{{\textrm{d}{t^*}}}\left( {{{\left( {\frac{{\dot y}}{y}} \right)}^2}{K_C}( y )} \right) + \frac{{96Oh}}{{\sqrt {We} }}{\left( {\frac{{\dot y}}{y}} \right)^2} + \frac{{48}}{{We}}{K_S}( y )\left( {\frac{{\dot y}}{y}} \right) = 6{K_P}( y )\left( {\frac{{\dot y}}{y}} \right), \end{equation}
where the non-dimensional time  $t^*$ and the Ohnesorge number read
 \begin{gather} t^* = \frac{t}{\tau }, \end{gather}
 \begin{gather}Oh = \frac{{\mu _L }}{{\sqrt {\sigma \rho _L 2R_0 } }}, \end{gather}
and  $We$ is the parameter that has been introduced in (2.8). In the following, this equation will be solved using
 $Mathematica$ (Wolfram Research, Inc 2014) and the stability of the steady state or of the initial spherical state will be studied.
4.2. Steady state computation
Steady state of the oscillator is given by the implicit relation
 \begin{equation} We = \frac{{8K_S ( y )} }{{K_P ( y )}}. \end{equation}
This leads to a formula identical to El Sawi's (Reference El Sawi1974) result for bubbles (note that this can be applied to the present case even when condition (2.16) is not met since El Sawi's work on ellipsoidal bubble deformation is about the steady state) and given by
 \begin{align} &We_{{El\ Sawi}}( y ) \nonumber\\ &\quad = \frac{{2{{( {\sqrt { - 1 + {y^6}} - {y^6}\textrm{Arcsec} [ {{y^3}} ]} )}^2}\left( {{y^3}\sqrt { - 1 + {y^6}} ( {1 + 2{y^6}} ) + ( {1 - 4{y^6}} )\textrm{Arctanh} \left[ {\dfrac{{\sqrt {- 1 + {y^6}} }}{{{y^3}}}} \right]} \right)}}{{{y^7}{{( { - 1 + {y^6}} )}^2}( { - 3\sqrt { - 1 + {y^6}} + ( {2 + {y^6}})\textrm{Arcsec} [ {{y^3}} ]} )}}. \end{align}
Figure 3 shows the graph of (4.4) for the oblate case (as in § 2 the prolate case has no steady solution as  $K_S$ is negative while
 $K_P$ is positive). As pointed out by El Sawi (Reference El Sawi1974), there is no longer an oblate steady state for a Weber number greater than 3.27 (there also seems to be a branch for very large
 $y$ but it does not seem very likely to have any physical reality). For the sake of completeness, this result is compared to Moore's (Reference Moore1965) formula resulting from a two-point analysis based on potential flow around a spheroid
 \begin{equation} We_{Moore}( y ) = \frac{{4( {{y^9} + {y^3} - 2} )}}{{{y^4}{{( {{y^6} - 1} )}^3}}}{( {{y^6}\textrm{Arcsec} {(y^3)} - \sqrt {{y^6} - 1} } )^2}. \end{equation}
Note that combining (2.9) and (4.6) allows for the computation of function  $\lambda$. Moore's result is still widely used in the analysis of bubble shape (Legendre, Zenit & Velez-Cordero Reference Legendre, Zenit and Velez-Cordero2012). The reader can see in this latter work that, while it is dedicated to developing new correlations, the shapes of bubbles are still well described by Moore's formula up to a Weber number approximately equal to 3.

There are, however, fewer comparisons in the liquid–liquid or the liquid–droplet/gas case and it will be shown here that the present result compares rather well with the data given in Hsiang & Faeth (Reference Hsiang and Faeth1995). Agreement between (4.4) and droplet/gas experiments in shock tubes (labelled by stars in figure 3) is rather good when  $We < 3$. For liquid/liquid experiments agreement is also rather good for the lower Weber number (
 $We <1$) but there seems to be a tendency for intermediate Weber numbers (
 $1< We <4$) to follow an equilibrium shape given by twice the result of (4.4) and corresponding to the computation of the pressure work on the forward half of the droplet (i.e.
 $C_P=1/2$ corresponding to the dotted line in figure 3). Note that in the liquid–liquid case, it is likely that measurements have been made close to the limit falling velocity (this is not detailed, however, by Hsiang & Faeth Reference Hsiang and Faeth1995). Note also that the Taylor Analogy Breakup (TAB) model gives good values for the steady deformation when compared with gas-liquid cases (cf. appendix A.1).
4.3. Phase space analysis
Figure 4(a) shows the oscillatory behaviour for both initially oblate and prolate spheroids for  $We = 2$ and
 $Oh = 0.001$. Note that, in most works, the initial shape is assumed to be spherical but it may actually depend on the experimental protocol devised (for instance a levitated droplet impinged by a horizontal shock or air blow might be slightly oblate but hit on the greater semi-axis; or a pendant drop detaching and hitting a liquid pool might still begin slightly prolate when it hits the surface). Figure 4(b) shows the phase plot for the previous oscillations. The fixed point is clearly visible as the centre of the circling motion (and is an attractor). Note that when the droplet begins in the prolate shape, this is equivalent to (i.e. it follows part of the same trajectory as) the oscillation of a spherical droplet with a non-zero initial deformation velocity, as there is some stored surface energy in the deformed droplet. This explains why the amplitudes of the oscillations are larger when the droplet begins in the prolate shape. Most experimental interpretations begin with a perfectly round droplet and a zero initial deformation velocity, however.
Comparison between oscillation time series and phase plot. (a) Oscillations,  $\ We = 2, Oh = 0.001$; and (b) phase plot,
 $We = 2, Oh = 0.001$.

5. Stability limits and linearised oscillator
5.1. Stability of the steady states
From a mathematical point of view, studying the stability of a fixed point should be done by linearising around said fixed points, i.e. those obtained by (4.4) (this is also known as Lyapunov's first method). Setting  $y_{eq}$ as the implicit solution of (4.4) and writing
 $\epsilon =y-y_{eq}$, one gets
 \begin{equation} {K_C}( {{y_{eq}}( {We} )} )\ddot \epsilon + \frac{{48Oh}}{{\sqrt {We} }}\dot \epsilon + \left( {\frac{{24}}{{We}}{\sigma _1}( {{y_{eq}}( {We} )} ) - 3{{\rm \pi} _1}( {{y_{eq}}( {We} )} )} \right)\epsilon = 0, \end{equation}
where
 \begin{gather} { K_S}( \epsilon ) \approx \sigma _0 + \sigma _1\epsilon + \sigma _2{\epsilon^2}, \end{gather}
 \begin{gather}{ K_P}( \epsilon ) \approx {\rm \pi}_0 + {\rm \pi}_1\epsilon + {\rm \pi}_2{\epsilon^2}. \end{gather}
In this new analysis, only values of the coefficients  $\tilde {K}_C, \sigma _1, {\rm \pi}_1$ vary and they are now functions of the steady deformation
 $y_{eq}$ and henceforth of the Weber number (these relations are given by polynomial approximations in appendix G).
5.2. Stability of the initial spherical state
Although not very rigorous mathematically speaking, it is possible, however, to linearise equation (4.1) around  $y=1$, using the previous definition
 $\varepsilon = y-1$; this leads to
 \begin{equation} {K_C}( 1 )\ddot \varepsilon + \frac{{48Oh}}{{\sqrt {We} }}\dot \varepsilon + \left( {\frac{{24}}{{We}}{{\tilde K}_S}( \varepsilon ) - 3{{\tilde K}_P}( \varepsilon )} \right) = 0. \end{equation}
Therefore, keeping the same notation as in (5.2) and (5.3), one gets
 \begin{equation} \ddot \varepsilon + \frac{{48Oh}}{{{K_C}( 1 )\sqrt {We} }}\dot \varepsilon + \frac{1}{{{K_C}( 1 )}}\left( {\frac{{24}}{{We}}{\sigma _1} - 3{{\rm \pi} _1}} \right)\varepsilon = \frac{1}{{{K_C}( 1 )}}\left( { - \frac{{24}}{{We}}{\sigma _0} + 3{{\rm \pi} _0}} \right), \end{equation}
and, using exact values of the coefficients found in (3.15), (3.18), (3.26) and (3.28) this leads to
 \begin{equation} \ddot \varepsilon + \frac{{20Oh}}{{\sqrt {We} }}\dot \varepsilon + \left( {\frac{{32}}{{We}} - \frac{{342}}{{35}}} \right)\varepsilon = \frac{3}{2}. \end{equation}
It can be noticed that the final results is very close to Reference Kulkarni and SojkaKulkarni & Sojka's (Reference Kulkarni and Sojka2014) model given by
 \begin{equation} \ddot y + \frac{{16Oh}}{{\sqrt {We} }}\frac{1}{{{y^2}}}\dot y + \left( {\frac{{24}}{{We}} - \frac{{{\alpha^2}}}{4}} \right)y = 0. \end{equation}
Note that in (5.7), the value of the damping coefficient has been set to 16 instead of 8, as in the original work, as there seems to be a mistake in their derivation. The coefficient  $\alpha$ is a fitting coefficient that is based, according to the authors, on the stretching rate of the air around the droplet and considering § 2, it corresponds to
 $\alpha =2\lambda$. Therefore, it should be greater than 3 (twice the spherical droplet case). However, Kulkarni and Sojka decided to set it equal to
 $2\sqrt {2}$ in order to recover the classical value of the critical Weber number, usually set to 12 (q.v.). Note that there is no right-hand term in their model, so that, rigorously, the equilibrium shape should be given by
 $y=0$ (i.e. a zero width) which is somewhat non-physical. The right-hand term in (5.5) does, however, lead to steady deformations
 $\bar \varepsilon$. They can be easily computed and this leads to
 \begin{equation} \bar \varepsilon = \frac{{( {{{{{\rm \pi} _0}}/{{{\rm \pi} _1}}}} )We}}{{W{e_{cr}} - We}} \simeq \frac{{0.3We}}{{W{e_{cr}} - We}}. \end{equation}
Here,  $We_{cr}$ is a critical Weber number which reads
 \begin{equation} W{e_{cr}} = \frac{{8{\sigma _1}}}{{{{\rm \pi} _1}}}. \end{equation}
In the case of linearisation around the sphere with  $C_P=1$, in (5.9) we get
 $We_{cr}= ( {{1120}}/{{171}}) \simeq 6.54$ (and
 $C_P=1/2$ leads to
 $We_{cr}=13.08$). Figure 3 compares the steady deformation obtained by (4.4) (full nonlinear model) and (5.8) (linearised) and the two seem to be in agreement up to a Weber number of 2.4.
5.2.1. Linear stability
Stability of either (5.1), (5.5) or (5.7) can be obtained using the discriminant which reads
 \begin{equation} \varDelta = {\alpha^2}\left( {\left( {\frac{{W{e_{cr}}}}{{We}}} \right)\left( {{{\left( {\frac{{Oh}}{{O{h_{cr}}}}} \right)}^2} - 1} \right) + 1} \right), \end{equation}
after introducing
 \begin{equation} \alpha = \sqrt {\frac{{12{{\rm \pi} _1}}}{K_{C(1)}}}, \end{equation}
( $\alpha =4.42$ when
 $C_P=1$ and
 $\alpha =3.12$ when
 $C_P=1/2$) and the critical Ohnesorge number
 $Oh_{cr}$ defined by
 \begin{equation} Oh_{cr} = \sqrt {\frac{{K_{C(1)} \sigma _1 } }{{24 }}}. \end{equation}
In the case of linearisation around the sphere with  $C_P=1$,
 $Oh_{cr} \simeq 0.54$, the condition for oscillation,
 $\varDelta < 0$, sums up to
 \begin{equation} Oh^2 < (Oh_{cr})^2 \left( {1 -\frac{{We }}{{We_{cr} }}} \right). \end{equation}
This limits the oblate oscillation zone (cf. figure 5). For the model given by (5.1),  $Oh_{cr}$ is a function of
 $We$: this is referred as the ‘Analytical’ model in figure 5. Note that Reference Kulkarni and SojkaKulkarni & Sojka's (Reference Kulkarni and Sojka2014) model corresponds to
 $\alpha ^2= 8, We_{cr}=12$ and
 $Oh_{cr}=1.63$. They, however, did not compute
 $Oh_{cr}$ or its equivalent as they wrongly computed the oscillation domain. Note also, and more importantly, that the real parts of the roots of the characteristic equation are positive when
 $We > We_{cr}$ leading to a possible droplet blow-up. There is also an area of critical damping of oscillation when
 $We < We_{cr}$ and Ohnesorge number is large enough.


5.3. Oscillation frequency
The non-dimensional oscillation frequency is given by
 \begin{equation} f = \frac{\alpha}{{4{\rm \pi} }}{\left( {\left( {\frac{{W{e_{cr}}}}{{We}}} \right)\left( {1 - {{\left( {\frac{{Oh}}{{O{h_{cr}}}}} \right)}^2}} \right) - 1} \right)^{1/2}}. \end{equation}
Which in the linearised case around a sphere with  $C_P=1$, leads to
 \begin{equation} f \simeq \left( {\frac{{0.81}}{{We }} - 0.12} \right)^{1/2}, \end{equation}
where influence of the Ohnesorge number has been neglected in the last equation (when  $C_P=1/2$ this equation becomes
 $f=\sqrt {.81/We-0.06}$). Note that the Weber number dependency of the frequency is mainly coupled to the ratio between surface and kinetic energy of deformation (through (5.11), (5.9) and (5.14)). Therefore, discrepancies between these models and experiments can be somewhat related to the different hypotheses that are validated. For instance, increase of surface area (e.g. by non-spheroidal deformation) will increase the frequency while increase of the kinetic energy (by introducing, for instance, Hill's vortices) would decrease it. Next section will therefore test the different oscillation models against DNS and experiments.
5.3.1. Comparison with data
In figure 6 we show a comparison of the frequency predicted by the present model and previous ones. Lamb's result given by (5.16) gives much higher frequencies
 \begin{equation} {f_{Lamb}} = \frac{{1,27}}{{\sqrt {1 + \dfrac{2}{3}\dfrac{{{\rho _C}}}{{{\rho _L}}}} }}\frac{1}{{\sqrt {We} }}, \end{equation}
while Villermaux & Bossa's (Reference Villermaux and Bossa2009) model gives much lower frequencies. The TAB model gives the same frequency as Lamb's model since this was a reference used to fix some constants of the model. Lastly, owing to its similarity with the present model, the model of Kulkarni & Sojka (Reference Kulkarni and Sojka2014) gives comparable (albeit slightly smaller) frequencies.
Non-dimensional oscillation frequency  $f$ of the droplet as a function of Weber number
 $We$ in the
 $Oh=0$ limit. For the present analytical models, the frequencies of oscillations are computed using (5.14), (5.9), (5.12) and in the nonlinear cases, (G 2), (G 3), (G 4) or (G 6), (G 7), (G 8).

Figure 6 also shows a comparison of the present model with some available experimental and numerical results. There are no available data for the oscillation of a droplet set suddenly in an exterior flow field as is usual in atomisation experiments. Therefore, Castrillon-Escobar (Reference Castrillon-Escobar2016) developed a direct numerical simulation of the oscillations of a gallium droplet into water (therefore satisfying (2.16)). His results (which will be discussed in § 6) can be found in figure 6. Agreement is very good between the analytical model and the DNS results up to a Weber number of 2, and a Weber number of 5 when considering the  $C_P=1/2$ (pressure on the half-drop) case. The linearised models seem to perform initially in a similar way but are still valid for high Weber numbers when the analytical model predicts instability.
Comparatively, more data can be found for the oscillations of a droplet at terminal velocity. For instance, when comparing with the liquid/liquid experimental results of Winnikow & Chao (Reference Winnikow and Chao1966) ( $\rho _L/\rho _C=1.2$,
 $686 \leq Re_C \leq 876$), agreement is also good. The same can be concluded when comparing with the numerical liquid–liquid results of Lalanne, Tanguy & Risso (Reference Lalanne, Tanguy and Risso2013) (
 $\rho _L/\rho _C=0.99$,
 $50 \leq Re_C \leq 287$). While these measurements were made under gravity at the droplet terminal velocity, this good agreement may be explained by the fact that the hypothesis of a constant velocity of the droplet is an underlying hypothesis of the present analysis. Although condition (2.16) is not valid in these cases, the model gives good results. Appendix B gives an explanation for this fact by extending the range of applicability of (2.16).
Lastly, in meteorology, while rain droplet oscillation frequencies have been studied, it is mostly as a function of their size (in mm) and not of their terminal Weber number (Beard, Bringi & Thurai Reference Beard, Bringi and Thurai2010). Using the droplet terminal velocity (which is, most of the time, given as a function of their size) allows us, however, to find the relationship between the size and terminal Weber number. Falling rain droplets’ terminal velocity has been studied experimentally by Gunn & Kinzer (Reference Gunn and Kinzer1949) and their data have then been processed in a correlation by Best (Reference Best1950), cf. (Foote & Du Toit Reference Foote and Du Toit1969)
 \begin{equation} V_{\lim}=9.43( {1 - \exp ( { - {{(D/1.77)}^{1.147}}} )} ), \end{equation}
where the limit velocity  $V_{\lim }$ is given in (m/s) as a function of the droplet diameter
 $D$ (in mm). Note that, in Gunn & Kinzer (Reference Gunn and Kinzer1949), uncertainties on the velocity are close to 10 % and that this should translate in large error bars in figure 6 (on both axes due to the use of non-dimensional variables) but they have not been shown for the sake of clarity. While the smaller droplets are known to be very close to Lamb's oscillation frequency, there are some discrepancies for the higher droplet diameter (Goodall Reference Goodall1976). In this latter work (Goodall Reference Villermaux and Bossa1976), the oscillation frequency is measured indirectly by considering the backscattering of 11 GHz radar microwaves. The data reported in figure 6 are those given for horizontal polarisation of the microwave which departs the most from Lamb's frequency (reported uncertainty can be estimated to be approximately 5 %, leading to an estimated uncertainty in figure 6 of 20 % on the
 $We$ axis and 15 % on the
 $f$ axis). More recently, in his DNS of raindrop oscillations at terminal falling velocity, Appleyard (Reference Appleyard2013) observed that the oscillations frequencies were quite inferior to Lamb's but attributed this discrepancy to some numerical errors (also note that, in this work, the frequency is computed by Fourier transform and is therefore dependent on the time series size sample). These data are also shown in figure 6 and are in agreement with present model (the most efficient model being the linearised model with
 $C_P=1/2$).
To conclude with this section, note that, while (5.14) is very similar to a Strouhal number, the real Strouhal number should be computed according to
 \begin{equation} St = \frac{{fD}}{\tau U} \simeq \sqrt {\frac{{{\rho _C}}}{{{\rho _L}}}} {\left( {\frac{{0.81}}{{We}} - 0.12} \right)^{1/2}}, \end{equation}
so that the density ratio plays an important part in its determination. In the liquid–liquid case, this ratio is close to unity and non-dimensional frequency  $f$ and Strouhal number
 $St$ are similar, so oscillations can be observed; but in the gas–liquid case the density ratio is very low, therefore the Strouhal number is much smaller than the non-dimensional frequency. This may explain why the oscillations of the droplet have not been reported in gas–liquid atomisation experiments for a Weber number close to unity: the droplets were carried outside the measurement zone before the oscillation could be detected.
6. Comparison with direct numerical simulations using Gerris
6.1. Direct numerical simulation in the liquid–liquid metal case
In Castrillon-Escobar (Reference Castrillon-Escobar2016), a spherical, 3 mm diameter, liquid gallium droplet is placed in a uniform water flow (cf. appendix H). Different water flow velocities are considered in order to explore the limit breakup regimes. The Weber and Reynolds numbers studied in this work are  $0.59<We<11.86$ corresponding to
 $1117.69<Re_C<4998.48$. An inlet velocity is considered on the inlet boundary and a pressure outlet is considered at the outlet boundary. Other boundaries are set with a slip boundary condition. The size of the domain is
 $7.5D_0 \times 7.5D_0 \times 22.5D_0$ to ensure no effects of the boundaries during either oscillations or breakup. Fluid physical properties are listed in table 1.
Fluid physical properties.

6.2. Flow field and differences with the potential model
Figures 7 and 8 illustrate some similarities and differences between the results of DNS computations and the potential flow modelling of § 3.
Pressure field  $t^*=1.22, Re_C=2499, We = 2.96$.

Velocity field  $t^*=0.16, 0.32, 0.48, 0.64$,
 $Re_C = 2499$,
 $We = 2.96$. Velocity inside the droplet has been increased fivefold for the sake of clarity.

First, figure 7 shows the pressure field around the drop. It can be seen that there exists, as expected, a high pressure area on the stagnation point and a low pressure area on the edge of the drop, generating deformation; also, however, due to flow separation, there is an asymmetry between the forward and the backward parts of the drop (which is actually generating pressure drag). This contrasts quite strongly with flow of figure 2 which is perfectly symmetric and was the incentive for developing a model where pressure work is computed only on the forward half-droplet.
Secondly, figure 8 shows the velocity field inside and around the drop for a droplet in the case of a Weber number equal to 2.96 (i.e. when the nonlinear oscillator equation where  $C_P=1$ starts to depart from the DNS). Two vortex rings are actually present in the simulation. The first one (which can be seen at
 $t^*= 0.48$) is a ‘classical’ vortex ring appearing in the wake of the droplet for high enough Reynolds number. The second one (which can be seen birthing at
 $t^*= 0.32$) is a vortex ring slowly building up inside the droplet. The presence of both vortices will greatly influence the subsequent behaviour of the droplet and makes it depart from the analytical model. The velocity field inside the droplet will therefore be quite different from the simple stretching given by (3.2). This is not the case, however, during the first period of oscillation of the droplet (
 $t^*=0.64$ in figure 8 where it is still not dominant.
Figure 9 shows the evolution of the deformation parameter  $y$ over time for different Weber numbers. This can be post-processed to extract the frequency of the oscillation of the droplet. However, it can be seen that both amplitudes and frequencies are actually decreasing (it is easier to see that periods are increasing) from one oscillation cycle to the other. This is likely to be related to the slow decrease of relative velocity between fluids and to the build-up of the vortex rings both inside and outside the drop: it both draws energy from the main flow and qualitatively limits the instability. It can be also seen quantitatively as, when the pressure work coefficient
 ${\rm \pi} _1$ decreases, due to (5.14), (5.10) and (5.11), the frequency also decreases. Therefore, figure 6 shows only the frequency of the first period of oscillation. This also allows us to compute an ‘oscillation frequency’ when the droplet begins its oscillating behaviour but has it interrupted by a fragmentation event.
Non-dimensional deformation parameter  $y$ (Ferret half-diameter in the axial direction) as a function of non-dimensional time
 $t^*$ for different Weber numbers. Results of the DNS with Gerris.

6.3. Switching from axisymmetric two dimensions to three dimensions
Table 2 presents the different cases that have been computed in this work. For the lower value of the Weber number, computations have been performed using a two-dimensional axisymmetric formulation. Some comparisons have been performed with three-dimensional computations and it has been decided to completely switch to three dimensions after a Weber number of 5.93 where oscillation ends due to fragmentation by stretching along its main axis (cf. figure 10 for such an instance).
DNS set-up. Note that Weber number is computed after one time step using the velocity difference between the centre of mass of the droplet and the surrounding fluid.

Elongational fragmentation of the drop.  $We = 10.38$.

This was done empirically, as can be seen in table 2; but it is interesting to see that this choice is rather in agreement with the numerical works of Blanco & Magnaudet (Reference Blanco and Magnaudet1995) and Magnaudet & Mougin (Reference Magnaudet and Mougin2007). In these studies, the authors showed that for values of  $y \leq 1.18$, there was no standing eddy behind a fixed spheroidal bubble, while for
 $y \leq 1.30$, there was an axisymmetric standing eddy. For greater deformations, there are losses of symmetry but there is actually a Reynolds number dependency of the limiting deformation values and the values reported here are minima concerning this dependency. Using figure 3 and (4.4), it is, however, possible to see that
 $y=1.18$ corresponds to
 $We \approx 2.2$ on the
 $C_P=1$ analytical model equilibrium curve (i.e. without wake vortex) and
 $y=1.30$ corresponds to
 $We \approx 5.8$ on the
 $C_P=1/2$ analytical equilibrium curve (i.e. with wake vortex) almost in agreement with our empirical choices (2.96 for a first three-dimensional test and then 5.93 for a full three-dimensional switch).
Figure 11 illustrates the oscillatory behaviour of the droplet in very nonlinear configurations ( $3 \leq We \leq 12$). It can be seen that, for these values, the shape of the droplet begins to deviate more and more from the proposed ellipsoidal shape (cf. figure 7 for instance). Comparison with the fixed ellipsoidal shape of Magnaudet & Mougin (Reference Magnaudet and Mougin2007) can therefore be qualitative at best and, for
 $We = 2.96$, there is a 16.6 % difference between the frequency computed using the three-dimensional set-up and the two-dimensional axisymmetric set-up (the three-dimensional case generating lower frequencies) which can be related to a symmetry breakup happening earlier than expected for a fixed shape. It can be seen on figure 6 that agreement between present oscillatory modelling is very good when the simulation stays two-dimensional axisymmetric and stays good when it becomes three-dimensional.
Three-dimensional DNS nonlinear oscillations. From left to right the Weber numbers are 2.96, 5.93, 8.89, 11.96.

7. Droplet blowup
While it was devised to characterise droplet breakup, the TAB model is actually unable to describe a complete droplet blow-up as it always predicts stable oscillations (as these oscillations can have large amplitudes, the breakup is introduced when the deformations reach a given ratio  $y=1.5$). This was one of the main motivations behind the DDB model which, however, predicts too high frequency oscillations and also a non-zero deformation when the Weber number equals zero. Kulkarni & Sojka's (Reference Kulkarni and Sojka2014) two-point model is, however, much more successful in determining the critical Weber number (albeit by tuning its parameters), and, more importantly, the kinetics of the drop deformation. In this section, the present model will be compared with some available experimental and numerical results. However, to be successful, it will be necessary to separate the experimental results into two categories: the ‘shock tube’ experiments and the ‘drop-flow’ experiments (where a droplet is actually dropped into a cross-flow). The main reason behind this classification is that, as pointed out in Jain et al. (Reference Jain, Prakash, Tomar and Ravikrishna2015), DNS and drop-flow experiments do not compare well.
7.1. Comparison with correlations
Figure 12 shows a comparison of the present analytical model with  $C_P=1$ and the correlations of Chou & Faeth (Reference Chou and Faeth1998), (cf. (7.1)), of Cao et al. (Reference Cao, Sun, Li, Liu and Yu2007), (cf. (7.2)) and of Zhao et al. (Reference Zhao, Liu, Xu, Li and Lin2013), (cf. (7.3)). Up to a non-dimensional time of 1.0, agreement with most correlations (except Cao's) is acceptable. This leads to a deformation
 $y=1.5$ large enough to let other mechanisms, such as non-spheroidal deformation, flow separation, Rayleigh–Taylor instability…, etc. (remember that
 $y=1.5$ is the breakup condition for TAB model), dominate over the present model to govern the subsequent behaviour of the droplet. Note that the droplet deformation is independent of the Weber number in all these empirical correlations while there is clearly an asymptotic behaviour for the analytical model when the Weber number goes to infinity:
 \begin{gather} D/D_0 = 1.0 + 0.5t^* ,\quad 0 \le t^* \le 2, \end{gather}
 \begin{gather}D/D_0 = 1.0 \quad \text{if } t^* \le 0.3 \quad \rm{ and } \quad 0.59 + 0.5t^* \quad \text{if } 0.3 \le t^* \le 0.99, \end{gather}
 \begin{gather}D/D_0 = 1.0 + 0.55( {t^* } )^{5/3} ,0 \le t^* \le 1.5. \end{gather}
Among all these correlation, agreement with the most recent formula ((7.3)) given by Zhao et al. (Reference Zhao, Liu, Xu, Li and Lin2013) is the best. As correlations are only indirect images of a chosen set of experimental or numerical results, direct comparison with these data is to be preferred and is the topic of next subsections.
Comparison of present analytical model ( $C_P=1$) with the correlation of Chou & Faeth (Reference Chou and Faeth1998), Cao et al. (Reference Cao, Sun, Li, Liu and Yu2007) and Zhao et al. (Reference Zhao, Liu, Xu, Li and Lin2013).

7.2. Comparison with shock tube experiments and DNS
Shock tube experiments and DNS are located in the same subsection as they behave in the same way when compared to the present model.
7.2.1. Shock tube
Figure 13 shows a comparison between the present analytical and linearised model (with  $C_P=1$) and the shock tube experiments of Dai & Faeth (Reference Dai and Faeth2001). Agreement is very good but, unexpectedly, the linearised model around the spherical shape behaves slightly better than the nonlinear model. A possible explanation would be that the whole flow field is still somehow similar to the flow around a sphere. This may be possible if the system to be considered is the compound system
 $\{{\textrm {{droplet}}}\} \cup \{{\textrm {{its closed wake}}}\}$, which may then take a spherical shape although the droplet does not. In the two-point analysis, for high Weber number, the pressure difference between the stagnation point and the edge of this new compound droplet does not change much while for the present full analytical model, the curvature of streamline has an impact on the evolution as the pressure is computed at every point on the surface of the droplet. From the analysis of these experiments its seems that the curvature of the flow field could be similar to the flow around a growing (and compound) sphere. This also allows for interpreting the good performance of linearised models on oscillation frequencies (cf. figure 6).
Comparison of droplet breakup kinetics with experimental shock tube results of Dai & Faeth (Reference Dai and Faeth2001).

7.2.2. DNS
Figures 14 and 15 show a comparison between present analytical and linearised model (with  $C_P=1$) and DNS data of Jain et al. (Reference Jain, Prakash, Tomar and Ravikrishna2015), Strotos et al. (Reference Strotos, Malgarinos, Nikolopoulos and Gavaises2016) and Yang et al. (Reference Yang, Jia, Che, Sun and Wang2017). The same conclusions as for the comparison with shock tube experiments seems to be valid. Note that, for Strotos et al.'s (Reference Strotos, Malgarinos, Nikolopoulos and Gavaises2016) work, the discrepancies seem to be more related to the numerical scheme used and its implementation as the droplet behaviour clearly departs from known results.
Comparison of droplet breakup kinetics with numerical results of Jain et al. (Reference Jain, Prakash, Tomar and Ravikrishna2015) and Yang et al. (Reference Yang, Jia, Che, Sun and Wang2017).

Comparison of droplet breakup kinetics with numerical results of Strotos et al. (Reference Strotos, Malgarinos, Nikolopoulos and Gavaises2016).

7.3. Drop tube experiments or droplets in crossing flow
As shock tube experiments are difficult to conduct, most recent experimental results resort to a simpler set-up where a droplet is dropped into a cross-flow.
Guildenbecher, López-Rivera & Sojka (Reference Guildenbecher, López-Rivera and Sojka2009) gives some necessary conditions for a proper comparison between shock tube and drop-flow experiments and they are usually thought to be sufficient for the two set-ups to be judged equivalent. However, it has been chosen here to compare them in a different section as the analytical model with  $C_P=1/2$ (rather than
 $C_P=1$) seems to be better at describing the behaviour of drop-flow experiments. Figures 16–19 show a comparison between the present analytical and linearised models (with
 $C_P=1/2$) and a selected (but large) set of experimental data.
Comparison of droplet breakup kinetics with experimental drop-flow (droplet in a cross-flow) results of Krzeczkowski (Reference Krzeczkowski1980).

The oldest data that are compared with are results from Krzeczkowski (Reference Krzeczkowski1980) (cf. figure 16). As it is rather difficult to know exactly when the droplet does exactly penetrate into the cross-flow, the zero time has been shifted in order to obtain the best fit. As our model also allows for a non-initially spherical droplet (and most importantly, for a prolate initial droplet), the initial shape has been slightly altered for  $We=18.4$ allowing for a perfect match. Comparison with the linear model of Kulkarni & Sojka (Reference Kulkarni and Sojka2014) is also shown and its performance is comparable.
Next comparison (cf. figure 17) is with the limited range of Weber number that allowed Kulkarni & Sojka (Reference Kulkarni and Sojka2014) to fit the coefficient of their model. Performances of the model of Kulkarni & Sojka (Reference Kulkarni and Sojka2014) are obviously better than present models in these special cases.
Comparison of droplet breakup kinetic with experimental drop-flow (droplet in a cross-flow) results of Kulkarni & Sojka (Reference Kulkarni and Sojka2014).

However, when comparing with the data of Opfer et al. (Reference Opfer, Roisman, Venzmer, Klostermann and Tropea2014) (cf. figure 18), as the Weber number considered (11.3) is just below their critical Weber number (set purposely to 12.0), the model of Kulkarni & Sojka (Reference Kulkarni and Sojka2014) predicts an oscillating droplet (around a ‘ $y=0$ equilibrium’ shape) and therefore strongly underperforms. This should also be the case of present linearised model with
 $C_P=1/2$ (since
 $We_{cr}=13.08$) except that it predicts a very large equilibrium deformation given by (5.8) and therefore oscillates around this large value, reversing the concavity of the curve. Agreement is therefore better. As a side note, this may constitute an explanation for the widespread use of the TAB model, which always predicts a stable deformation (
 $y_{eq}=1+We/48$ cf. appendix A.1) and oscillates around this value. But in the present case, this would lead, for the TAB model, to a steady value of 1.24 and therefore to very small oscillations around this value. Likewise, it can be noticed that agreement would be impossible to get for any models without imposing an initial deformation of
 $y(0)=1.2$.
Comparison of droplet breakup kinetic with experimental drop-flow (droplet in a cross-flow) results of Opfer et al. (Reference Opfer, Roisman, Venzmer, Klostermann and Tropea2014).

Lastly, when comparing with the experimental results of Jain et al. (Reference Jain, Prakash, Tomar and Ravikrishna2015) (cf. figure 19), agreement is almost perfect when  $C_P=1/2$. It is precisely the disagreement between their experimental results and their DNS results that suggested considering differently the shock tube (
 $C_P=1$) and drop-flow (
 $C_P=1/2$) experiments. The main explanation for this discrepancy may be that, in the drop-flow case, the droplet slowly enters a velocity gradient which creates a strong wake vortex (which moreover should actually be asymmetrical cf. Flock et al. Reference Flock, Guildenbecher, Chen, Sojka and Bauer2012) than in the shock tube case (or DNS) where the full potential flow approximation seems to be appropriate for a longer time.
Comparison of droplet breakup kinetic with experimental drop-flow (droplet in a cross-flow) results of Jain et al. (Reference Jain, Prakash, Tomar and Ravikrishna2015).

8. Conclusion
The present work has been dedicated to the derivation of analytical models for the axisymmetric deformation, oscillation and breakup of a droplet initially at rest and suddenly set into an outer flow. This is a prototypical experiment of what is known as ‘secondary atomisation’ (thought droplets are seldom exposed in that way to a sudden flow: supersonic rain erosion (Ranger & Nicholls Reference Ranger and Nicholls1969), nuclear vapour explosion (Berthoud Reference Berthoud2000; Theofanous Reference Theofanous2011) and some special flow configuration like rocket boosters (Doisneau et al. Reference Doisneau, Sibra, Dupays, Murrone, Laurent and Massot2014) may be the only direct applications).
The main hypothesis is that the droplet remains spheroidal during its deformation, that the surrounding flow is potential and that viscosity inside the droplet only prevents its elongation. Moreover, it is also assumed that the droplet velocity does not change (or changes slowly compared to its oscillation frequency) and that it is possible to neglect the unsteady term in the pressure.
This allows us to write a nonlinear oscillator equation for the droplet evolution in a closed form. The energy approach that has been chosen differs from the two-point approach of Kulkarni & Sojka (Reference Kulkarni and Sojka2014) since it is more rigorously obtained (therefore some caveats are avoided) and does not need fitting parameters. In spirit, this improvement over the model of Kulkarni & Sojka (Reference Kulkarni and Sojka2014) is similar to the improvement of the two-point model of Moore (Reference Moore1965), for the equilibrium shape a bubble rising in a liquid, by El Sawi (Reference El Sawi1974) (using virial theorem) and Benjamin (Reference Benjamin1987) (using a Hamiltonian formulation).
Moreover, by considering the two limiting cases of either computing the pressure work on the whole droplet or only on the forward half, this takes into account the flow separation behind the drop and the wake effect in a simple manner allowing us to either compute more precisely the equilibrium shape of the droplet, its oscillation frequencies or its unstable behaviour.
Interestingly, the present study also gives a physical interpretation for the critical Weber number as it is shown to be proportional to the ratio of some surface energy term to pressure work term (cf. (5.9)). Therefore uncertainties and variations of the critical Weber number in experiments can be related to variations or uncertainties on the pressure field or to the droplet shape (i.e. non-spheroidal droplets).
It also allows for the computation of the droplet deformation rate when the droplet breaches the critical Weber number and bifurcates toward an infinite deformation. To conclude, this new model generalises the TAB (deformation and oscillation), the DDB (steady deformation and kinetic of the breakup) and Kulkarni & Sojka's models in one framework without resorting to fitting parameters.
Lastly, it will be difficult to really conclude this paper without mentioning the good overall performance of the linearised model around the spherical shape (with pressure computation on the forward half of the droplet) and almost equivalently (if we neglect the mathematical inconsistencies of the model) of the two-point model of Kulkarni & Sojka (Reference Kulkarni and Sojka2014). The main interpretation that can be given is that streamlines around a sphere are good candidates to describe the pressure work around the deformed droplet, or to be more exact, around the droplet and the entrained mass of surrounding fluid that is captured in its wake vortex. This can also be correlated to the critical Weber number of the linearised system with  $C_P = 1/2$ whose value of 13.08 is very close to the usual value of 12 (although this value may vary from one study to another). Note that in the droplet case, due to the density difference, the inertia of this wake can be neglected. This could be corrected in the model but it will be difficult to do it analytically as, considering rising bubbles for instance, most wake models (Parlange Reference Parlange1969; Kendoush Reference Kendoush2003; Simcik, Puncochar & Ruzicka Reference Simcik, Puncochar and Ruzicka2014) are still qualitative and semi-empirical. This is therefore left for future work.
Acknowledgements
The work was done under the research programme on nuclear safety and radioprotection (RSNR) and received funding from French government managed by the National Research Agency (ANR) under Future Investments Program (PIA), research grant no. ANR-10-RSNR-01. The authors also acknowledge partial support from COST action MP1305 ‘Flowing Matter’, supported by COST (European Cooperation in Science and Technology). Lastly, the authors would also like to thank Dr F. Candelier for helpful comments during an early presentation of this work. Criticisms and suggestions made by the anonymous referees were also invaluable in improving the present work.
Declaration of interests
The authors report no conflict of interest.
Appendix A. Classical linear oscillators for intermediate Weber number droplet deformation
A.1. Taylor analogy breakup
The original TAB model reads
 \begin{equation} \frac{{{\textrm{d}^2}\tilde y}}{\textrm{d} t^2} + 5\frac{{{\mu _L}}}{{{\rho_L}R^2}}\frac{{\textrm{d}\tilde y}}{{\textrm{d}{t}}} + \frac{8\sigma}{\rho_L R^3}\tilde y = \frac{2}{3}\frac{\rho_C}{\rho_L}\frac{U_\infty^2}{R^2}, \end{equation}
where  $\tilde y = 2 ( y - 1 )$ so that, using the same non-dimensional number as defined in the present paper, one gets
 \begin{equation} \frac{{{\textrm{d}^2}y}}{{\textrm{d} t^{* 2}}} + \frac{{20}}{R}\frac{{\textrm{d} y}}{{\textrm{d} t^*}} + \frac{{64}}{{We}}(y-1) = \frac{4}{3}, \end{equation}
so that the equilibrium equation is
 \begin{equation} y_{eq}=1+\frac{We}{48}. \end{equation}
A.2. Droplet deformation and breakup
The original DDB model was written
 \begin{equation} {\rho _R}\frac{{{\textrm{d}^2}{\tilde y}}}{{\textrm{d} {\tilde t^2}}} + 4\frac{{{\mu _R}}}{{{{ \widetilde{Re}}}}}\frac{1}{{{\tilde y^{2}}}}\frac{{\textrm{d}{\tilde y}}}{{\textrm{d} {\tilde t }}} + \frac{{27{{\rm \pi}^2}}}{{16 \widetilde{We}}}{\tilde y}( {1 - 2{{( {c \tilde y} )}^{ - 6}}} ) = \frac{3}{8}, \end{equation}
where  $\tilde y= ({4}/{3{\rm \pi} }) y = y/c$,
 $\widetilde {Re}=Re_C/2$ and
 $\widetilde {We}=We/2$. Again introducing the present non-dimensional parameter leads to
 \begin{equation} \frac{{{\textrm{d}^2}y}}{{\textrm{d}{t^{* 2}}}} + \frac{{9{\rm \pi}^2 }}{{\textrm{Re}}}\frac{1}{{{y^2}}} \frac{{\textrm{d} y}}{{\textrm{d} t^*}} + \frac{27{\rm \pi}^2}{{2We}}y ( {1 - 2{y^{ - 6}}}) = \frac{9{\rm \pi}}{8 }. \end{equation}
Please note that, steady deformation does exist when  $We=0$ and equals
 $2^{1/6}\approx 1.12$! It then slowly and continuously grows till it reaches its asymptote
 $y=We/{12 {\rm \pi}}$ above eighty. Moreover, the frequency of the implied oscillations is so high that it could not be printed in figure 6.
A.3. Model of Villermaux and Bossa
The model obtained by Villermaux & Bossa (Reference Villermaux and Bossa2009) is written using the same non-dimensional parameters as in the present work and reads
 \begin{equation} \frac{{{\textrm{d}^2}y}}{{\textrm{d} { t^{* 2}}}} + \left( {\frac{6}{{We}} - 1} \right)y = 0. \end{equation}
Appendix B. Condition for density ratio close to one
The reason why liquid–liquid experiments give good results for the droplet oscillation frequency while not verifying (2.16) lies in the hypothesis underlying the derivation of (2.16). From the start, the Bernoulli relation at the interface should read
 \begin{equation} {\rho _C}\frac{{\partial \psi_C }}{{\partial t}} + \frac{1}{2}{\rho _C}U_C^2 + {P_C} = {\rho _L}\frac{{\partial \psi_L }}{{\partial t}} + \frac{1}{2}{\rho _L}U_L^2 + {P_L} + [\![ P ]\!], \end{equation}
where  $[\![ P ]\!]$ is the pressure jump at the interface. It is, however, possible to see that there exists a special case where the two terms
 ${\rho _C}({{\partial \psi _C }}/{{\partial t}})$ and
 ${\rho _L}({{\partial \psi _L }}/{{\partial t}})$ cancel each other out. Actually, using the Ranger and Nicholls characteristic time, they can be approximated by
 \begin{equation} {\rho _C}\frac{{\partial \psi_C }}{{\partial t}} \approx \rho_C \sqrt{\frac{\rho_C}{\rho_L}} U_C^2 \end{equation}
and
 \begin{equation} {\rho _L}\frac{{\partial \psi_L }}{{\partial t}} \approx \rho_L \sqrt{\frac{\rho_C}{\rho_L}} U_C U_L. \end{equation}
Using (2.13), both terms can be shown to be of the same magnitude when  $\rho _C \approx \rho _L$.
Appendix C. Indirect influence of dissipation in the surrounding flow
The goal of this section is to show that, although taking into account the dissipation in the surrounding flow field is possible in the present framework, it does not influence directly the frequency and the amplitude of the oscillations. It does, however, influence them indirectly as the main contribution of the viscous dissipation in the surrounding fluid is to slow down the droplet therefore changing its velocity and, finally, its oscillation frequency and amplitude. However, to show this more quantitatively, we need to switch to two degrees of freedom: the deformation parameter  $y$ previously defined and the position
 $z$ of the droplet centre of mass. For the sake of simplicity when introducing dissipative terms, the Lagrangian formalism will be used to derive the corresponding equations of motion. Let us now demonstrate this assertion.
Proof. First, the kinetic energy can be decomposed into two terms:
 \begin{equation} {T_L}( {y,\dot y} ) = \frac{2}{3}{\rm \pi} {\rho _L}R_0^5{K_C}( y ){\left( {\frac{{\dot y}}{y}} \right)^2}, \end{equation}
the kinetic energy of deformation, and
 \begin{equation} {T_T}( {\dot z} ) = \tfrac{4}{3}{\rm \pi} {\rho _L}R_0^3{( {{U_\infty } - \dot z} )^2}, \end{equation}
the kinetic energy of translation. Total kinetic energy therefore reads
 \begin{equation} T = {T_D}( {\dot z} ) + {T_L}( {y,\dot y} ). \end{equation}
Viscous dissipation of the potential flow inside the droplet is given by (3.10). Using Moore's previous work, viscous dissipation of the potential flow outside the droplet can be written
 \begin{equation} {D_C}( {y,\dot z} ) = 12{\rm \pi} {\mu _C}{( {{U_\infty } - \dot z} )^2}{K_D}( y ){R_0}, \end{equation}
where
 \begin{equation} {K_D}( y ) = G( {\chi ( y )} ), \end{equation}
where  $G$ is the function computed by Moore (Reference Moore1965) and
 $\chi$ the ratio between the greater and the lesser semi-axes. The total dissipation is therefore given by
 \begin{equation} D = {D_L}( {y,\dot y} ) + {D_C}( {y,\dot z} ). \end{equation}
The potential energy is the sum of the surface energy and the pressure work when it does exist. Note that the pressure power should be written now
 \begin{equation} {\dot W_P}( {y,\dot y,\dot z} ) = {\rm \pi}{\rho _C}R_0^3{K_p}( y ){( {{U_\infty } - \dot z} )^2}\frac{{\dot y}}{y} \approx {\rm \pi}{\rho _C}R_0^3{K_p}( y )U_\infty^2\frac{{\dot y}}{y}. \end{equation}
And it can be integrated when the velocity difference vary slowly. This therefore leads to a potential written
 \begin{equation} {W_P}( y ) = \int_{{t_0}}^t {{{\dot W}_P}( {y,\dot y} )\, \textrm{d} t} = {\rm \pi}{\rho_C}R_0^3U_\infty^2\int_{{y_0}}^y {K_p}( {y'} )\frac{{\textrm{d} y'}}{{y'}} , \end{equation}
and total potential energy is given by
 \begin{equation} V = {E_S}( y ) + {W_P}( y ). \end{equation}
The Lagrangian of the system is classically written as
 \begin{equation} L = T - V. \end{equation}
and the equations of motion are given by
 \begin{equation} \frac{\textrm{d}}{{\textrm{d} t}}\frac{{\partial L}}{{\partial \dot y}} = \frac{{\partial L}}{{\partial y}} + \frac{{\partial D}}{{\partial \dot y}}, \end{equation}
for deformation and
 \begin{equation} \frac{\textrm{d}}{{\textrm{d} t}}\frac{{\partial L}}{{\partial \dot z}} = \frac{{\partial L}}{{\partial z}} + \frac{{\partial D}}{{\partial \dot z}}, \end{equation}
for translation. Let us note that
 \begin{equation} \frac{{\partial {D_C}}}{{\partial \dot y}} = 0, \end{equation}
and therefore, with these approximations, there is no contribution from the viscosity of the surrounding fluid in (C 11). This can be understood intuitively as boundary layers do not influence the exterior pressure field which creates the deformation.
Appendix D. Pressure work approximation
There is a small discrepancy in the present model: there should be a stagnation point in front of the droplet, cf. (3.20), and in the meantime, the inner flow is described by (3.2). There is therefore a velocity jump at the interface. Note also that (3.2) corresponds to a flow with axisymmetric streamfunction
 \begin{equation} \psi = \frac{{\dot y}}{y}{r^2}z. \end{equation}
Therefore, a possible way to model the flow without velocity jump in the neighbourhood of the droplet would be to sum the two potential flows  ${\boldsymbol {U}}$ and
 ${\boldsymbol {V}}$ so that (3.22) should exactly read
 \begin{equation} \dot{W}_P = 2\rho _C \int_0^a {\tfrac12 {(\boldsymbol{U}+\boldsymbol{V})}^2 ( {{\boldsymbol{V}}{\boldsymbol{\cdot} \boldsymbol{n}}} )2{\rm \pi} r\, \textrm{d} l(r)}. \end{equation}
However, it can be seen that the velocity inside the drop is smaller than the velocity in the outside flow, at least for a not very large deformation and as far integral (D 2) is concerned. Using the results of § 2, one can see that (2.13) actually implies that
 \begin{equation} V \le \sqrt {\frac{{{\rho _C}}}{{{\rho _L}}}} \lambda {U_\infty }. \end{equation}
Moreover, when developing
 \begin{equation} {( {{\boldsymbol{U}} + {\boldsymbol{V}}} )^2} = {{\boldsymbol{U}}^2} + 2{\boldsymbol{V}} \boldsymbol{\cdot} {\boldsymbol{U}} + {{\boldsymbol{V}}^2} \approx {{\boldsymbol{U}}^2}, \end{equation}
the scalar product  $\boldsymbol {V} \boldsymbol {\cdot } \boldsymbol {U}$ appears and it can be seen that it should be small on the interface as the directions of
 $\boldsymbol {U}$ and
 $\boldsymbol {V}$ differ. However, the value of parameter
 $\lambda$ is greater than 1.5 and can greatly increase when the drop deforms, so the present approximation should do well in the gas–liquid case but less in the liquid–liquid case once large deformations are obtained. It could be possible to keep all the terms in the final oscillation equation but term
 $\boldsymbol {V}^2\boldsymbol {V} \boldsymbol {\cdot } \boldsymbol {n}$ will lead to a third-order ordinary differential equation.
Appendix E. Oblate analytical solution
To find the analytical expression, it is necessary to get inspiration from the way Benjamin (Reference Benjamin1987) simplified El Sawi's (Reference El Sawi1974) work on the equilibrium shape of bubbles. First there is some similarity between (3.22) and the way added mass around an ellipsoid is usually computed (Lamb Reference Lamb1932). A simple way to figure this is to change the system that will be used for energy balance and to consider now {droplet, carrier fluid} as our new system. There is therefore no more pressure work and one gets
 \begin{equation} \frac{{\textrm{d}{T_L}}}{{\textrm{d} t}} + \frac{{\textrm{d}{T_C}}}{{\textrm{d} t}} + \frac{{\textrm{d}{E_S}}}{{\textrm{d} t}} = - D, \end{equation}
where  $T_C$ is the kinetic energy of the carrier fluid. It is therefore easy to see that
 \begin{equation} {\dot{W}_P} = - \frac{{\textrm{d}{T_C}}}{{\textrm{d} t}}. \end{equation}
Moreover, kinetic energy of the carrier fluid can be written
 \begin{equation} {T_C} = \frac{1}{2}{\rho _C}\frac{{4{\rm \pi} }}{3}R_0^3U_\infty^2\mu, \end{equation}
where  $\mu$ is the added mass coefficient (and is equal to
 $1/2$ for a sphere). Let us recall that
 $\dot {W}_P>0$ and that
 $\mu$ increases as the sphere deforms, so a strict application of (E 2) would lead to negative pressure work. Benjamin (Reference Benjamin1987) showed, to describe the steady shape of a bubble, that, using a Hamiltonian equivalent to (E 1), the derivation must be made assuming that the impulse remains constant. As the carrier fluid impulse reads
 \begin{equation} {P_C} = {\rho _C}\frac{{4{\rm \pi} }}{3}R_0^3{U_\infty }\mu, \end{equation}
the kinetic energy can now be written
 \begin{equation} {T_C} = \frac{{P_C^2}}{{2{\rho _C}\frac{{4{\rm \pi} }}{3}R_0^3\mu }}, \end{equation}
and the pressure power is now defined by
 \begin{equation} {\dot{W}_P} = - {\left( {\frac{{\textrm{d}{T_C}}}{{\textrm{d} t}}} \right)_{{P_C}}} = \frac{1}{2}{\rho _C}\frac{{4{\rm \pi} }}{3}R_0^3U_\infty^2\frac{{\textrm{d}\mu }}{{\textrm{d} t}} = \frac{1}{2}{\rho _C}\frac{{4{\rm \pi} }}{3}R_0^3U_\infty^2y\frac{{\textrm{d}\mu }}{{\textrm{d} y}}\frac{1}{y}\frac{{\textrm{d} y}}{{\textrm{d} t}}; \end{equation}
so that
 \begin{equation} {K_P}( y ) = \frac{2}{3}y\frac{{\textrm{d}\mu }}{{\textrm{d} y}}. \end{equation}
An analytical expression for the added mass of an oblate spheroid can be obtained (cf. Lamb (Reference Lamb1932) but the exact formula is actually given in Benjamin (Reference Benjamin1987)) and reads
 \begin{equation} \mu ( y ) = \frac{{\tan \eta ( y ) - \eta ( y )}}{{\eta ( y ) - \sin \eta ( y )\cos \eta ( y )}}, \end{equation}
where
 \begin{equation} \eta ( y ) = \textrm{Arcsec} ( {a/b} ) = \textrm{Arcsec} ( {{y^3}} ). \end{equation}
Appendix F. Prolate analytical solution
For the prolate case ( $y < 1$), ellipsoidal coordinates are a bit different and streamfunction
 $\psi$ now reads
 \begin{align} \psi &= \frac{{\frac12 U_\infty b^2 ( {a^2 - b^2 } )}}{{a\sqrt {a^2 - b^2 } + b^2 \textrm{Log} \left( {\dfrac{{a - \sqrt {a^2 - b^2 } }}{b}} \right)}}\left( \textrm{Cosh} ( \xi ) + \textrm{Sinh} ^2 ( \xi )\textrm{Log} \left( {\textrm{Tanh} \left( {\frac12 \xi } \right)} \right) \right)\textrm{Sin}^2 ( \eta )\nonumber\\ &\quad - \frac{1}{2}U_\infty r( {\xi ,\eta } )^2; \end{align}
and the conformal coordinate change is
 \begin{equation} z + ir = \sqrt {a^2 - b^2 } \textrm{Cosh} ( {\xi + i\eta } ). \end{equation}
Polynomial interpolation of  $K_P$ in the
 $0.5 < y < 1$ range is
 \begin{equation} {K_P^P}( y ) \approx 0.0551404 - 0.128603y - 0.768269{y^2} + 2.61128{y^3} - 0.570044{y^4}; \end{equation}
while the exact formula can be obtained using the added mass coefficient of a prolate spheroid (cf. Lamb Reference Lamb1932, p. 153)
 \begin{equation} \mu ( y ) = \frac{{{\alpha _0}}}{{2 - {\alpha _0}}}, \end{equation}
where
 \begin{equation} {\alpha_0} = \frac{{2( {1 - {e^2}} )}}{{{e^3}}}\left( {\frac{1}{2}Log\frac{{1 + e}}{{1 - e}} - e} \right). \end{equation}
Appendix G. Weber number influence
G.1. Coefficients
As mentioned, coefficients  $\tilde {K}_C, \sigma , {\rm \pi}$ are functions of steady state deformation
 $y_{eq}$ which is itself a function of Weber number, up the maximum Weber number where a steady state still exists (cf. (4.4)). This can be summarised by the following polynomial approximations:
 \begin{gather} {y_{eq}}({We}) = 1.00275 + 0.00482 We + 0.08892 W{e^2}{{ - }}0.05011 W{e^3} + 0.01066 W{e^4}, \end{gather}
 \begin{gather}{K_c}({We}) = 2.41514 - 0.30638 We + 0.13908 W{e^2} - 0.08083 W{e^3} + 0.01690 W{e^4}, \end{gather}
 \begin{gather}{{\rm \pi}_1}({We}) = 3.94524 - 0.11689 We + 0.97820 W{e^2} - 0.56125 W{e^3} + 0.11820 W{e^4}, \end{gather}
 \begin{gather}{\sigma_1}({We}) = 3.2018 + 0.02646 We + 0.08247 W{e^2} - 0.04583 W{e^3} + 0.00952 W{e^4}, \end{gather}
and when computing the pressure work on the forward half of the droplet ( $C_P=1/2$)
 \begin{gather} {y_{eq}}( {We} ) = 1.01012 - 0.01947 We + 0.11506 W{e^2} - 0.06180 W{e^3} + 0.01243 W{e^4}, \end{gather}
 \begin{gather}{{\rm \pi} _1}( {We} ) = 4.0216 - 0.37939 We + 1.26543 W{e^2} - 0.68875 W{e^3} + 0.13722 W{e^4}, \end{gather}
 \begin{gather}{\sigma _1}( {We} ) = 3.2106 - 0.00518 We + 0.03264 W{e^2} - 0.00877 W{e^3} + 0.00085 W{e^4}, \end{gather}
 \begin{gather}{K_c}( {We} ) = 2.41829 - 0.17690 We + 0.05446 W{e^2} - 0.01512 W{e^3} + 0.00147 W{e^4}. \end{gather}
G.2. Nonlinear oscillation domain and frequencies
Determining the oscillation domain can be done graphically thanks to figure 20; for a given value of Weber number the critical value of the Weber number is computed from the coefficients given by (G 2)–(G 4) thanks to (5.9). If the critical value is greater than the current value, the Weber number is still in the oscillatory domain. Conversely, if the current critical Weber number is less than the current Weber number, the current Weber number is outside the oscillation domain. It can be seen in figure 20 that this happens when the  ${We(We)}$ curve meets the first bisectrix, i.e. when
 $We \approx 3.27$, in agreement with the steady state computation. The whole stability domain can be recovered using (5.13) and substituting (G 2)–(G 4) in (5.12) and (5.9), as
 $Oh_{cr}$ and
 $We_{cr}$ are now functions of the Weber number. The result is shown in figure 5 as the ‘Analytical’ black curve. One can also note an increase in the critical Ohnesorge number limit over the linearised case. As for the oscillation frequencies, they are still given by (5.15) but substituting now (G 2)–(G 4). The result is shown in figure 6 again as the ‘Analytical’ black curve. Again, up to a Weber number of approximately two, both the linear and the nonlinear models give close results. The same is true, up to a Weber number of five, for the computations on the half-drop (
 $C_P=1/2$).

Appendix H. Direct numerical simulation with Gerris
Gerris is an open-source code developed by Popinet (Reference Popinet2003) and Fuster et al. (Reference Fuster, Agbaglah, Josserand, Popinet and Zaleski2009) and supported by NIWA (National Institute of Water and Atmospheric research) and Institut Jean le Rond d'Alembert (France). Gerris provides a range of finite-volume discretisation techniques, combining quad/octree discretisation, a projection method and a multilevel Poisson solver. The use of quad/octree structured grids, which enable the use of an advanced adaptive mesh refinement technique, allows us to better resolve the different fluid scales at those places where required, with a significant reduction in computational effort in comparison with uniform meshing. The dimensionless system of equations solved by Gerris is listed below:
 \begin{gather} \bar{\boldsymbol{\nabla}} \boldsymbol{\cdot} \boldsymbol{\tilde{u}} =0, \end{gather}
 \begin{gather}\frac{{\partial {\boldsymbol{\tilde{u}}}}}{{\partial \tilde{t}}} = \frac{1 }{{\tilde{\rho}}}\left[ { - \bar{\boldsymbol{\nabla}} \tilde{p} + \frac{{\tilde{\mu}} }{{\textrm{Re}_C }}\bar{\boldsymbol{\nabla}} \boldsymbol{\cdot} ( {\bar{\boldsymbol{\nabla}} {\boldsymbol{\tilde{u}}} + \bar{\boldsymbol{\nabla}} {\boldsymbol{\tilde{u}}}^T } ) + \frac{{\tilde{\sigma}} }{{We}}\tilde{k}( {\delta _S \boldsymbol{\tilde{n}}} ) } \right], \end{gather}
 \begin{gather}\frac{{\partial {T}} }{{\partial \tilde{t}}} + \bar{\boldsymbol{\nabla}} \boldsymbol{\cdot} T\boldsymbol{\tilde{u}} =0, \end{gather}
 \begin{gather}\tilde{\rho}=\rho_R \cdot T+(1-T), \end{gather}
 \begin{gather}\tilde{\mu}=\mu_R \cdot T+(1-T), \end{gather}
where  $T$ is a ‘colour’ field ranging from 0 to 1 and indicating the presence of the liquid metal (
 $T=1$) or of the carrier phase (
 $T=0$),
 $\tilde {t}= U_0 t/D_0$ (so we need to correct
 $\tilde {t}$ to get
 $t^*$),
 $\rho _R=\rho _L/\rho _C$,
 $\mu _R=\mu _L/\mu _C$,
 $\tilde {k}$ is the Gaussian curvature of surface
 $S$,
 $\boldsymbol {\tilde {n}}$ the outer normal to the liquid metal phase and
 $\delta _S$ a Dirac delta function located on the interface
 $S$. The space domain is discretised using a quadtree (octree in three dimensions) partitioning. The root cell (Level 0) is the base of the cell tree, by increasing the level the adaptation continues up to the leaf cells, namely the maximum level. Three different refinement criteria have been tested, based on the studies performed by Chen & Yang (Reference Chen and Yang2014). Several combinations between different types of refinement criteria are explored and finally, the best cost-efficiency refinement criterion has been chosen. The refinement criteria tested are as follows.
(i) Gradient-based: in this case, we use a refinement using the local gradient of a given variable. We perform a refinement based on the gradient of the variable
 $T$ that represents the volume fraction of liquid metal (droplet) which is not zero only at the interface $S$ when the function $T$ changes from 0 (in the surrounding fluid) to 1 (in the droplet). A refinement based on the gradient of vorticity is also used in order to solve the vortex structures inside and outside the droplet.
(ii) Curvature-based: when the interface is highly deformed and has sharp edges, this means that its curvature is important. These sections are then highly refined because it is where breakup happens.
(iii) Thickness-based: when the fluid tightens and the two interfaces get closer, in order to avoid numerical breakup, the fluid between the interfaces need to be solved by more than three or four grid points. This refinement allows us to solve accurately pinch-off and stripping of fluid ligaments.


Further information about these refinement criteria and their validation can be found in Popinet (Reference Popinet2009), Chen & Yang (Reference Chen and Yang2014) and Castrillon-Escobar (Reference Castrillon-Escobar2016). In the two-dimensional simulation, the three kinds of refinement criteria are used (gradient, curvature and thickness) but in the three-dimensional simulations, only gradient-based and curvature-based types of refinement criteria are used. After comparison with classical test cases, eight levels of refinement are used for the gradient-based algorithm while twelve are used for both the curvature and the thickness based algorithms.



