1. Introduction
China has made remarkable progress in its war on poverty since the launching of economic reforms in 1978 (Lin, Reference Lin1992). Economic growth of about 9 per cent per annum since then has helped to lift several hundred million people out of absolute poverty. Over the past two decades of reform, the share of the population living in poverty fell from 64 per cent in 1981 to 10 per cent in 2004, with the reduction in poverty being greatest in China's coastal and central regions where economic growth has been fastest (Ravallion and Chen, Reference Ravallion and Chen2007; Chen and Ravallion, Reference Chen and Ravallion2008).
But even with the success to date, substantial challenges remain, as there are still more than 100 million rural absolute poor (those living under $1/day consumption). Most of these poor live in western (inland) China and are concentrated in remote townships and villages, often in mountainous areas with low rainfall, or lands with limited potential (World Bank, 2001; Ravallion and Chen, Reference Ravallion and Chen2007). But even western China has pockets of relative wealth amid poverty that are disguised with the more aggregated data (e.g., province-level data) that most poverty analysts rely upon (for example, Ravallion and Chen, Reference Ravallion and Chen2007), as are the pockets of poverty in the more prosperous eastern provinces.
The concentration of the poor in particular areas suggests that geographic targeting of poverty reduction assistance might be useful. But such targeting requires fine spatial detail to prevent leakage of benefits to nonpoor areas and to ensure that aid is channeled to areas in which those who are truly poor live. Previous research has shown that geographic targeting is most effective when the geographic units are relatively small (Baker and Grosh, Reference Baker and Grosh1994). Unfortunately, such targeting is currently impossible since the samples for household surveys that are used to measure poverty in China are too small to permit measuring poverty at fine enough spatial disaggregation. For example, China's rural household survey covers 80,000 households but yields poverty estimates that are representative only for each province (n = 31).
In this context, a recently developed small area estimation approach (Hentschel et al., Reference Hentschel, Lanjouw, Lanjouw and Poggi2000; Elbers et al., Reference Elbers, Lanjouw and Lanjouw2003) might be useful. Analysts using this approach combine household survey data (that are limited in their spatial coverage) with census data that can be disaggregated to a fine level, such as counties or townships. The combined data are needed since a census usually only asks about sources, but not levels, of income and does not ask about consumption. As a result, the census cannot be used directly to measure poverty.
To implement the small area estimation method, several steps are needed. Household survey data are used to estimate a model of consumption. When creating the model, the predictors are restricted to those variables that are also available from a recent census. The coefficients from this estimated model are then combined with the overlapping variables from the census, and consumption is predicted for each household in the census. The odds of being poor are then predicted for every household and added up to yield estimated poverty rates for every small area (Hentschel et al., Reference Hentschel, Lanjouw, Lanjouw and Poggi2000). Elbers et al. (Reference Elbers, Lanjouw and Lanjouw2003) show that the incidence of poverty calculated from a census, using the imputed consumption figures, is close to that calculated from survey data but with a much greater level of statistical precision. The ability to produce reliable estimates of poverty for small geographic areas, without the added costs of fielding additional household surveys, has made this technique popular in developing countries, and in some cases, the poverty maps are used by governments to target financial resources to poor areas.
One problem with the way this small area estimation technique is often applied is that many studies neglect information on the environmental factors that influence poverty. Yet there are theoretical links between poverty and the environment (Ekbom and Bojo, Reference Ekbom and Bojo1999) and empirical evidence of significant differences in poverty rates between people with similar characteristics living in different geographical areas (Jalan and Ravallion, Reference Jalan and Ravallion1998). Hence, if differences in environmental conditions (such as rainfall and soil fertility) could be measured at a fine enough level, the information in these variables might be relevant for poverty maps. But there has been little empirical work on including environmental variables in small area estimation (although there are exceptions, for example, Gibson et al., Reference Gibson, Datt, Allen, Hwang, Bourke and Parajuli2005 and Okwi et al., Reference Okwi, Hoogeveen, Emwanu, Linderhof and Begumana2005). The major problem in performing this type of analysis has been the lack of data (and/or the inability to merge environmental data with survey data). Despite the data difficulties, the fact still remains that if not accounted for, poor environments and low levels of geographical capital may mask poverty where it really is (or predict poverty where it is not).
To bridge these gaps in the existing research, in this paper, we not only use the census and household survey data but also combine them with a set of environmental variables to construct poverty maps for rural areas of Shaanxi province in China. Shaanxi is an area of high poverty in China with a rural poverty rate three times the national average. Furthermore, Shaanxi has had one of the slowest rates of poverty reduction in rural China since 1981 (Ravallion and Chen, Reference Ravallion and Chen2007). In the current application, Shaanxi also is a strategic choice since it has considerable environmental heterogeneity (Huang et al., Reference Huang, Wang, Ren, Li and Zhang2007).
The basis of our methodological contribution is in constructing and comparing three poverty maps: the first map comes from a consumption prediction model where no environmental variables are available for selection, while the second and third maps come from models that repeat the process of model selection but with environmental variables as candidate predictors available at the outset. The difference between the two models that allow for environmental variables is that one treats them only as level effects, shifting consumption up or down within a small area once the household characteristics have been accounted for, while the other allows for interactions between environmental variables and household characteristics. The evidence from rural Shaanxi favors the model with interactive effects, which suggests that the main impact of local environments on consumption and poverty may be to alter the rates of return to household characteristics.
These maps allow us to precisely predict poverty rates for all counties and most townships. While there are 31 provinces in China, there are over 2,000 counties and more than 40,000 townships, making this a fairly low level of disaggregation. Comparing the poverty map without environmental variables with the more general map with environmental variables lets us assess how much leakage and undercoverage may result from ignoring the environment in poverty-mapping exercises. We also estimate and discuss small area inequality statistics since the efficacy of targeting at finer spatial levels is reduced if there are high levels of local inequality. Finally, we contrast the results of our preferred environmental poverty map with the official designation of ‘poor counties’ and examine some of the environmental correlates of county-level poverty in rural Shaanxi.
To meet our specific objectives, the rest of the paper proceeds as follows. Sections 2 and 3 describe the data and explain the methodology. Section 4 discusses the estimation results and predictive power of the consumption regressions. Section 5 uses the results and examines the targeting implications when the analysis accounts for (and when it does not account for) the environmental factors. In section 6, we contrast the results of our poverty maps with the official designation of ‘poor counties’ and examine some of the environmental correlates of county-level poverty. The final section concludes.
2. Data
Three sources of data are used: (i) the 2000 Population Census, (ii) the 2001 Rural Household and Income Expenditure Survey (RHIES) from China's National Bureau of Statistics and (iii) geophysical variables. The method requires the consumption model to be estimated on the sample and the coefficients then applied to population data on the same variables. Hence, it is important that census and survey measures of the same variable should have a common distribution. The descriptive statistics (and p values from tests for equal means) for the matched survey and census variables used in the analysis show that requirement is met (shown in table A1 in the online Appendix available at http://journals.cambridge.org/EDE).
Similar to other countries, the Chinese census does not collect information on income and expenditure and so cannot be used directly to measure poverty.Footnote 1 But the census provides information on a number of characteristics that are likely to be correlated with poverty, including demographics, education, economic activities and attributes of the dwelling. Access to raw data from the Chinese census is very restricted compared with most countries, so for each census household we were only able to obtain counts and proportions but no data on individuals. This limits the range of variables available to use for predicting consumption and is a weakness of the current data that must be kept in mind when interpreting the results. Moreover, we only had available to us a 1 per cent sample of the census (containing 76,000 rural households in 2,144 townships), which was designed to be representative at the township level. Consequently, our finally estimated standard errors would ideally be given further upward adjustment to account for them coming from a subset of all households, although this should not affect our main purpose of comparing results with and without environmental variables.
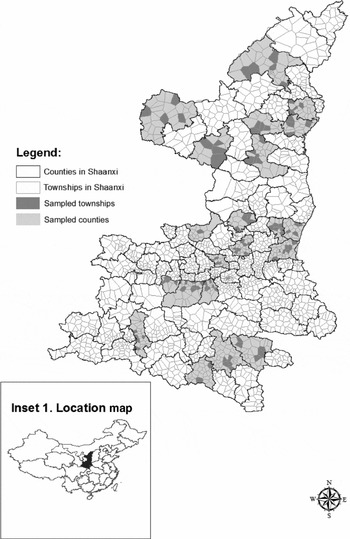
The 2001 RHIES collected information on the income and expenditure of households. The survey also collected data on household characteristics, employment and dwelling characteristics, along with other variables that cannot be matched to the census. The RHIES used multistage sampling, with 25 counties in rural Shaanxi selected in the first stage, with 4–8 townships selected from each county. From each township, usually only one village was selected, with 10 households surveyed from each selected village. Despite the fact that the RHIES collected high-quality data on the living standards of households, the sample is small relative to the population it represents. Figure 1 shows that 24 (124) sampled counties (townships) were selected from among the 107 (2,144) counties (townships) in the province.Footnote 2 The sample size in this survey is therefore too small to allow the estimation of poverty rates at either the county or township level.
Sampled counties and townships in the RHIES for Shaanxi Note: Township boundaries are based on Thiessen polygons within actual county boundaries.

The environmental component of this research uses a variety of spatially referenced variables that provide information on temperature, rainfall, topography and land cover for Shaanxi, which can be considered part of what Ravallion (Reference Ravallion, Ullah and Giles1998) calls geographic capital. The data on rainfall (measured in millimeters per year) and temperature (measured in degrees Celsius per year) are from the Chinese Academy of Sciences (CAS) data center. These were initially collected and organized by the Meteorological Observation Bureau from more than 600 national climatic and meteorological data centers. The elevation and terrain slope variables, which measure the nature of the terrain of each county, are generated from China's digital elevation model data set that are part of the basic CAS database. Information on the properties of soil also is part of our set of geographic and climatic variables from the CAS data center. Originally collected by a special nationwide research and documentation project (the Second Round of China's National Soil Survey), organized by the State Council and run by a consortium of universities, research institutes and soils extension centers, the data are used to specify two variables: the loam and the organic content of the soil (measured in per cent). We also use data on the density of highways, from the CAS data center and previously used in Deng et al. (Reference Deng, Huang, Rozelle and Uchida2008).
3. Overview of the methodology
Following Elbers et al. (Reference Elbers, Lanjouw and Lanjouw2003), the econometric analysis in this study consists of two stages. In the first stage, a model of (log) per capita consumption yi is estimated:

where xi is the vector of predictor variables for the ith household and is restricted to those variables that can also be found in the census, β is a vector of parameters and ui is the error term. This error term can be decomposed into two independent components: a cluster-specific effect ηc and a household-specific effect ϵci. This complex error structure allows for both spatial autocorrelation (that is, a ‘location effect’ common to all households in the same area) and heteroskedasticity (nonconstant variance) in the household component of the error term.
In the second stage of the analysis, the estimated regression coefficients from equation (1) are applied to data from the 2000 Population Census by using the characteristics included in vector xi to obtain predicted consumption for each household within the microcensus. While it is possible to directly predict consumption by simply combining the characteristics for census household j, xcj with  from equation (1), a more refined methodology is needed to account for the complex nature of the disturbance term (Elbers et al., Reference Elbers, Lanjouw and Lanjouw2003). Specifically, estimates of the distribution for both η and ϵ are obtained from the residuals of equation (1) and from an auxiliary equation that explains the heteroskedasticity in the household-specific part of the residual. Following Elbers et al. (Reference Elbers, Lanjouw and Lanjouw2003), the auxiliary equation is estimated using a logistic model of the variance of ϵci conditional on zci:

where zci is a set of potential variables that best explain the variations in ϵ2ci and A is a set equal to 1.05 × max{ϵ2ci}. In this stage, we also conduct a series of simulations, and for each simulation, we draw a set of beta and alpha coefficients,  and
 , from the multivariate normal distributions described by the first-stage point estimates and their associated variance–covariance matrices. Additionally, we draw
 2η, a simulated value of the variance of the location error component. Combining the alpha coefficients with the census data, for each census household we estimate 2ϵ, ci, the household-specific variance of the household error component. Then for each household, we draw simulated disturbance terms,
 c and
 ci, from their corresponding distributions. We simulate a value of expenditure for each household, ŷ cj, based on both the predicted log expenditure,
 , and the disturbance terms:

Finally, the full set of simulated ŷ cj values is used to calculate expected values of distributional statistics, including poverty measures for each ‘local area’ and for higher-level aggregations of local areas. We repeat this procedure 100 times, drawing a new set of coefficients and disturbance terms for each simulation. For any given location (such as a county or township), the mean across the 100 simulations for a given statistic, such as the headcount poverty rate, provides the point estimate of those statistics for that location, while the standard deviation serves as an estimate of the standard error.
As discussed earlier, most applications of Elbers et al.'s (Reference Elbers, Lanjouw and Lanjouw2003) method do not include any environmental variables and instead rely mainly on census and survey variables (e.g., Alderman et al., Reference Alderman, Babita, Demombynes, Makhatha and Özler2003; Suryahadi et al., Reference Suryahadi, Widyanti, Perwira, Sumarto, Elbers and Pradhan2003; Hoogeveen, Reference Hoogeveen2005; Bedi et al., Reference Bedi, Coudouel and Simler2007; Healy and Jitsuchon, Reference Healy and Jitsuchon2007). However, geographic variables such as rainfall or topography may help predict spatial patterns of poverty in rural Shaanxi. To take account of environmental predictors of poverty, equations (1) and (3) can be rewritten as


respectively, where Ei is a vector of environmental variables and yi, xi and ui are as given above.
Although equations (1a) and (3a) are more general than models that only have census and survey variables, they still restrict the way environmental effects may occur. Only level effects of the environment are allowed, shifting the rate of poverty up or down within an area once the household characteristics have been accounted for. A more general framework lets environmental variables interact with household characteristics, as may result if the local environment alters the returns (in terms of higher consumption) to household characteristics:


where Ii is a vector of interactions between xi and Ei.
4. Results for the poverty prediction models
We use the basic estimation framework provided by Elbers et al. (Reference Elbers, Lanjouw and Lanjouw2003), described above, with three different approaches to forming the first-stage consumption model used to predict poverty. Each adopts the same model selection criteria but varies the menu of candidate variables available to include in the model. The first approach uses the (limited) household-level variables available in the RHIES that match with the census (see table A1 in online Appendix), along with their squares and interactions. In addition, it also allows township- and county-level means (from the census) of these household-level variables to be included, along with interactions of the census means with the household variables. Using census means in the prediction model has been recommended by Elbers et al. (Reference Elbers, Lanjouw and Lanjouw2003) as a way to proxy for location-specific correlates of consumption, which can help to make the cluster-specific variance ηc smaller and improve precision of the second-stage predictions.
To get from this menu of 87 candidate variables to a consumption prediction equation, we use automated model selection procedures designed to meet three criteria: each variable included in the model is a statistically significant predictor (at p<0.05), the combination of variables maximizes adjusted-R 2 and the number of aggregate-level variables (the census means) should not be too large in order to avoid overfitting and instability.Footnote 3 These same criteria were also used with the second and third approaches to forming the consumption model, of including either levels of the environmental variables or levels and interactions of the environmental variables with the household variables, among the candidate predictors. There were no ‘protected’ variables that were forced into the model regardless of their statistical significance, so there is no guarantee that any environmental variables would be selected even when included in the menu of candidates.Footnote 4
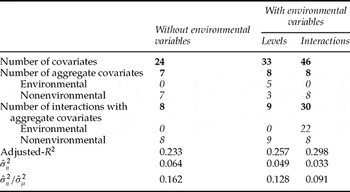
A summary of the consumption models that result from the three approaches is reported in table 1. Since these are predictive rather than causal models, we do not discuss any of the individual coefficients, which are reported in table A2 (available in the online Appendix at http://journals.cambridge.org/EDE).Footnote 5 In addition to describing the number of selected covariates of various types and the overall predictive power (the adjusted-R 2), the summary table also has two statistics on the importance of location effects in the disturbance terms. A good consumption prediction model for poverty mapping will remove more of these location effects, since larger location effects degrade precision of the second-stage predictions.
Summary statistics for the three consumption models used to form poverty maps

The consumption models appear to perform better when the environmental variables are included in the menu of potential predictors. The adjusted-R 2 ranges from 0.23, without the environmental variables, to 0.30 when there are interactions between environmental and household-level variables. The variance of the location effect,  , is only half as large when the interactive environmental variables are included compared with the model that excludes environmental variables (0.033 vs. 0.064). Similarly, the ratio of the variance of the location effect to the total residual variance,
 , is lowered to almost half its initial value by including environmental variables.Footnote 6 All of the indicators suggest that the environmental variables that interacted with household variables are more successful than environmental variables just as level effects. Indeed, no level effects of the environmental variables are chosen when the model can choose among both levels and interactions, which suggests that the impact of local environments on consumption may be by altering the rates of return to household characteristics.
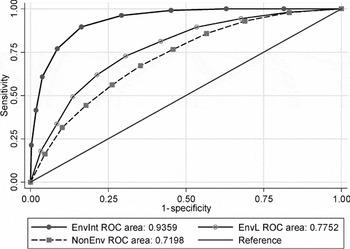
Further evidence on the better performance of models with environmental variables comes from Receiver Operating Characteristic (ROC) curves. A ROC curve plots the probability of a variable correctly classifying a poor person as poor on the vertical axis against one minus the probability of the same variable correctly classifying a nonpoor person as nonpoor on the horizontal axis. The closer an ROC curve is to the 45° line, the weaker the diagnostic power of the variable being considered as a targeting indicator, while the closer the ROC curve is to the left-hand side vertical and top horizontal axes, the greater is the efficacy as a diagnostic variable.
To construct ROC curves for rural Shaanxi, we first used the household survey data to indicate the actual poverty status of each of the 1,360 households in the sample. Specifically, we created a dummy variable equal to one for those households whose per capita expenditure ci was below a poverty line set at z = 700 yuan per year.Footnote 7 To construct the targeting indicators, note that for poor households ci < z, so ln(ci/z) < 0, and the probability of the ith household's (log) per capita expenditure deflated by the regional poverty line being less than zero is

where Φ is the standard cumulative normal and and are from the consumption regressions (in table A2 available in online Appendix). These probabilities were estimated from the models both with and without environmental variables included in the xi vector. These predicted probabilities were then collapsed into decile groups, and the decile indicators were compared with the actual poverty status of the household.
Figure 2 compares ROC curves from prediction models with and without environmental variables. The area under the ROC curve increases from 0.72 to 0.78 when environmental variables are included as level effects in the model (labeled as EnvL) and jumps even further to 0.94 when interactions between environmental and household variables are included in the model (EnvInt). Each of these increases in the area under the ROC curve is statistically significant (p < 0.001). In other words, there is significantly more diagnostic power when the consumption model includes environmental variables, especially interacted ones.
Comparison of the targeting performance of consumption models with and without environmental variables

5. Poverty maps and targeting implications
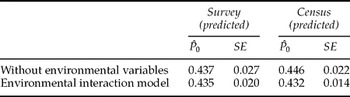
The results in table 1 and figure 2 suggest that consumption models with more predictive power and more desirable disturbances (smaller location effects) can be formed when the menu of variables includes environmental factors. In this section, results are presented from the second step of the small area estimation approach, where parameter estimates derived in the first-stage model are applied to the census data to impute welfare indicators for small areas. We also calculate bootstrapped standard errors for these welfare estimates, taking into account the complex error structure (that is, accounting for both spatial effects and heteroskedasticity). The second model, with environmental variables only as level effects, has results between those from the model without environmental variables and those from the model with interacted variables; thus to allow the most direct comparisons, we do not consider it any further. Before presenting and using these small area poverty estimates, we assess the accuracy of the predictions by comparing the estimates of poverty from the 2001 RHIES at the provincial level, a level at which the household survey was designed to be representative. The overall rural poverty rate predicted from the survey data is 44 per cent (table 2). In general, poverty rates from the two models in the survey are reasonably close to those from the census estimates. Our census-based predictors seem to perform well at this level; in neither of the two models being considered can we reject the null hypothesis that the census-based prediction is equal to the household survey mean. Furthermore, the standard errors of our census-based predictions are quite small, in fact considerably more precise than those in the household survey at the provincial level.
Comparisons of the survey- and census-predicted poverty rates at the provincial level

Note: SE, standard error.
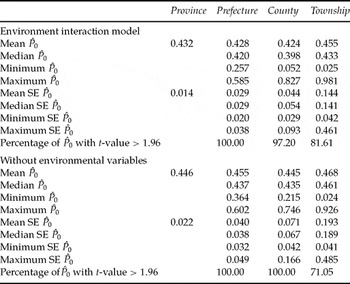
Table 3 presents the predicted headcount poverty rates from the two models by using the census data at the province, prefecture, county and township levels. The predicted poverty rates from the two models are similar, with 43.2 per cent of the rural population below the poverty line when the environmental variables are included and 44.6 per cent below without the environmental variables. But this hides substantial variation, with the county-level predicted poverty rates varying from 5 to 83 per cent and the township-level poverty rates from 3 to 98 per cent. The range in poverty rates is always less when the environmental variables are excluded, and the predictions less precise, with mean standard errors approximately 50 per cent higher than those from the model with environmental variables.
Precision of the poverty estimates at different levels of geographical disaggregation

Note: SE, standard error.
To demonstrate the precision of our estimates for rural Shaanxi, we count the number of prefectures, counties and townships with estimated poverty rates that are statistically significant at the 5 per cent significance level. With environmental variables included, 97.2 (81.6) per cent of the county-level (township-level) poverty estimates are statistically significant at the 5 per cent level, while without the environmental variables it is 100 (71.1) per cent. Thus, there is less confidence in the predictions at the township level, especially when environmental variables are excluded.
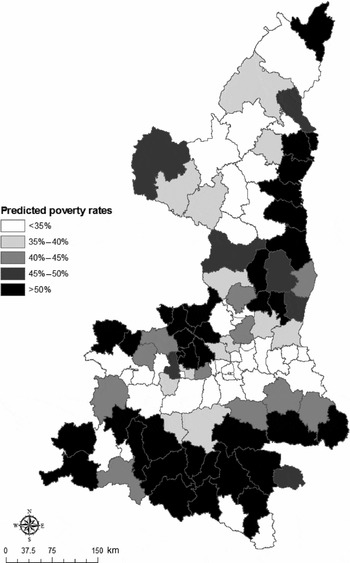
Figure 3 shows the predicted headcount poverty rates for each county in rural Shaanxi, using the model with interacted environmental variables.Footnote 8 The poverty map shows significant spatial variation of poverty within the province. The highest poverty rates are found in the eastern part of North Shaanxi (Shaanbei) and in the southern counties of Shaanxi (Shaannan). The lowest poverty rates are found in a contiguous horizontal band through central Shaanxi (the capital city, Xi'an, is located in this band of relative prosperity). In contrast to the northeast of Shaanxi, where precipitation is rare, and to the southern region, which consists of the high-elevation zone of Qingling and Daba mountains (an area with lower temperature and poor soils), the central region has a temperate semiwet climate and the terrain is relatively flat (Huang et al., Reference Huang, Wang, Ren, Li and Zhang2007). This heterogeneity would be missed if high-resolution poverty maps were not used. Thus, simply concentrating on provincial-level averages of poverty statistics (or other welfare indicators) would almost certainly prove to be a misleading guide for any targeted interventions.
Predicted poverty rates with environmental variables

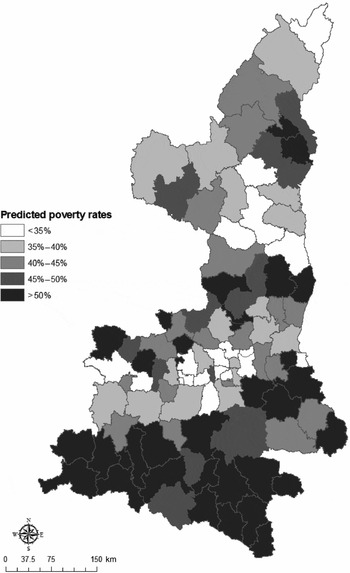
Figure 4 shows the predicted headcount poverty rates for each county in rural Shaanxi when using the consumption model formed without environmental variables. The poverty map looks rather different. The higher poverty rates in several of the northeastern counties are missed. At the same time, poverty rates are overstated in some of the counties in the central region. Whereas the map constructed from predictions that use environmental variables showed bands of neighboring counties in the same poverty class, presumably due to the similarity of climate, soils and topography for neighbors, without the environmental variables the poverty rates appear more idiosyncratic at the county level.
Predicted poverty rates without environmental variables

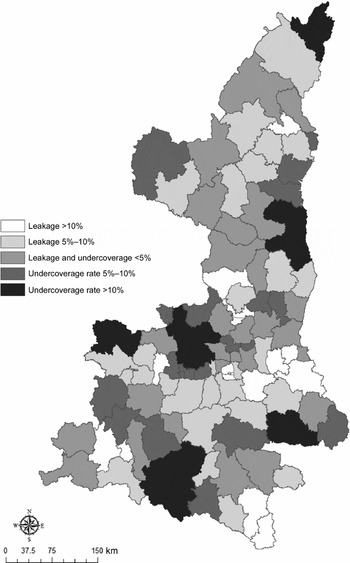
A comparison of the two poverty maps lets us calculate how much leakage and undercoverage results if environmental variables are ignored by the prediction model (figure 5). Undercoverage is the predicted poor from the model with environmental variables who are misclassified as nonpoor when the model without environmental variables is used. Leakage is the predicted nonpoor from the model with environmental variables who are misclassified as poor when the model without environmental variables is used. Figure 5 shows considerable mistargeting when the environmental variables are excluded. Specifically, a total of 32 counties, containing 28.4 per cent of the rural population, have either leakage or undercoverage rates exceeding 10 per cent when environmental variables are left out of the prediction model.
Leakage and undercoverage rates

The variation in predicted poverty rates between counties shown in figure 3 gives an incentive for geographic targeting of poverty reduction, but the feasibility of such targeting depends on the relative importance of within-area inequality. If most inequality is within area, targeting small areas may still see a significant amount of leakage to nonpoor households, while untargeted areas likely include many poor households that miss out. We therefore decompose predicted inequality into between-area and within-area components for prefectures, counties and townships. We use a generalized entropy inequality measure (Shorrocks, Reference Shorrocks1984):

where fi is the population share of household i, yi is per capita consumption of household i and μ is average per capita consumption. The decomposition is

where j refers to subgroups, gj refers to the population share of group j and GEj refers to inequality in group j. The between-group component of inequality is captured by the first term of the equation and is the level of inequality in the population if everyone within the group had the same (the group average) consumption level μj. The second term reflects what would be the overall inequality level if there were no differences in mean consumption across groups, but each group had its actual within-group inequality GEj. Ratios of the respective components to the overall inequality level provide a measure of the percentage contribution of between-group and within-group inequality to total inequality.
Most of the consumption inequality in rural Shaanxi occurs within prefectures. The overall GE(0) index for the province is 0.48, with components of 0.05 (11 per cent) between prefectures and 0.42 (89 per cent) within prefectures. The unimportance of inequality between prefectures suggests that geographical targeting should be for smaller areas since targeting prefectures would see a lot of leakage and undercoverage.Footnote 9 Targeting at the county level may be more feasible since one third of inequality is between counties and two thirds within counties, which is a lower proportion of within-area inequality than in many other poverty-mapping studies.Footnote 10 While there could be further gain by targeting at the even finer level of townships, where 55 per cent of inequality is within area, the poverty predictions for townships are considerably less precise than they are for counties, potentially undermining the ability to target at the township level (table 3).
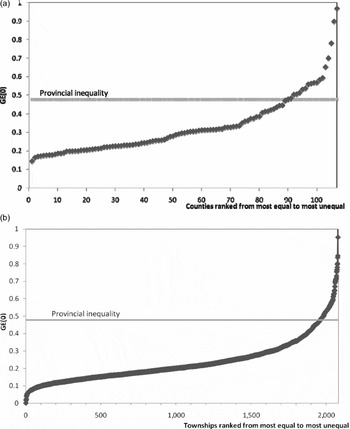
With more than half of the inequality in rural Shaanxi due to within-group inequality, even when the groups are relatively small (such as townships), there may seem to be grounds for caution in recommending geographic targeting. However, a high proportion of counties and townships has very low levels of inequality, as shown in figures 6a and b. In each figure, counties and townships are ranked from lowest to highest inequality and plotted against the level of inequality at the provincial level. We observe not only that many counties and townships have very low levels of inequality, but also that the vast majority of the counties (83.2%) and townships (94.1%) have point estimates of inequality that are lower than the provincial level of inequality, which implies that area-based targeting in most parts of rural Shaanxi may still be feasible.
(a) Distribution across counties of county-level inequality; (b) distribution across townships of township-level inequality

6. Do the officially designated poor counties really target poor areas?
China's poverty reduction efforts have, from the outset, been development oriented and targeted to poor areas. They have emphasized area-based investments in improving basic infrastructure and facilities for agricultural production (World Bank, 2001). Moreover, the national government poverty reduction funding is available only to those counties designated as poor, and the poor residing in counties not designated as poor are excluded from this support.Footnote 11 In Shaanxi, there are 46 designated poor counties (43 per cent of all counties).Footnote 12 It is interesting to see if these counties are the most likely to be predicted as the poorest, using the small area estimation results described above. It is also interesting to see what environmental factors are associated with the county-level poverty and whether these factors correlate with the official poverty designations.
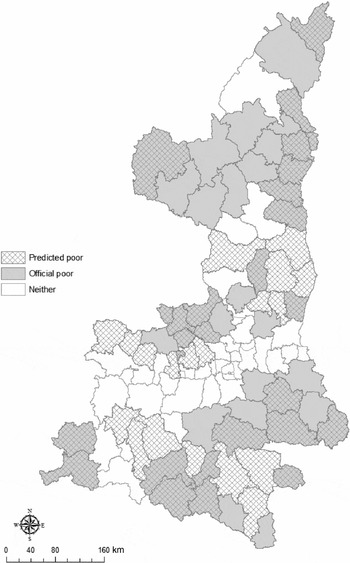
Figure 7 shows a comparison of the officially designated poor counties in Shaanxi with the poorest counties from the small area estimation method. There are 46 officially designated poor counties; thus, the figure contrasts them with the 46 counties having the highest rate of predicted poverty from the small area estimation method (with environmental variables). There are several divergences between the two rankings, with 20 out of 46 designated poor counties not among the poorest counties according to the predicted headcount rate. These apparently less poor counties that nevertheless are officially designated as poor are located especially in the western part of North Shaanxi and at the eastern end of the horizontal band of prosperity in central Shaanxi. Conversely, out of 61 nonpoor counties under the official designation, we find 20 counties that are among the 46 with the highest predicted headcount rates, particularly in southern Shaanxi. These findings suggest that under the current official poverty reduction scheme, there could be several poor areas in rural Shaanxi being excluded from the allocation of transfers, while a number of less poor areas might be deemed as potential beneficiaries.
Comparisons of the designated poor areas with the poor areas from the small area estimation method

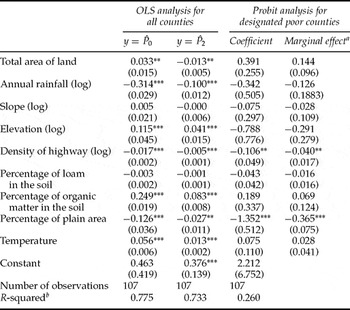
Which geographic factors are most associated with the county-level poverty, and are these correlations recognized by the official poverty designations? Table 4 shows the results of regressing county-level poverty rates (both the head count poverty rate, P 0, and the severity of poverty index, P 2) on the vector of environmental variables.Footnote 13 While it might appear that environmental variables were used to predict poverty rates and these predicted rates are now being regressed on environmental variables, two factors suggest that this is a legitimate exercise. First, Elbers et al. (Reference Elbers, Lanjouw and Lanjouw2005) show that if a relationship exists between independent variables (even those used in the prediction model) and a welfare indicator, then regressions that involve imputed indicators of the welfare indicator as the dependent variable will yield results no different from what would follow from similar regressions using the true indicator. Second, the environmental variables finally selected into the prediction model only entered in the form of interactions with household variables, so there should be no direct mechanical association between the predicted rates of poverty at the county level and county averages of the levels of these environmental variables.
Environmental correlates of poverty and inequality (based on estimates with environmental variables interactions)

Notes: Robust standard errors in parentheses. OLS, ordinary least squares.
***Significant at 1%; **significant at 5%.
aThe marginal effect shows the effect of a one-unit change in the explanatory variable on the probability of being designated as a poor county.
bPseudo R-squared for Probit model.
Among the environmental variables, only the slope and the loam content of the soil are not associated with county-level poverty rates. The results indicate that higher poverty is associated with counties that have lower rainfall, higher elevation and a lower percentage of land in plains, higher temperatures, more organic matter in the soil and a lower density of highways. There is a mixed result on the size of the county, with larger counties having a higher headcount poverty rate but a lower rate of poverty severity. These results suggest that counties with unfavorable agroclimatic conditions could be hindered in the process of economic development.
Finally, we examine which environmental variables are associated with a county being given official poor county status. Only the density of highways and the share of plain area have estimated coefficients that are statistically significant (with the same sign as for the regressions on predicted poverty rates). Thus, the official designation neglects the fact that, in terms of lower predicted poverty, it is better to live in a wetter county with lower elevation and a more moderate temperature. This finding is somewhat troubling because it indicates that the official poor area rankings in China may neglect the role of some relevant environmental factors.
7. Conclusions
In this paper, we have estimated various measures of welfare for small geographic areas in rural Shaanxi, China, by combining census and household survey data. We also utilized environmental variables when forming the consumption prediction models used to construct poverty maps. Our aim for this exercise was to assess if these environmental variables provided additional predictive power for imputing small area welfare indicators. Most previous applications of the small area estimation method have not included environmental information since standardized household surveys rarely collect these types of data, although they are often available from other sources (for example, satellite imagery and other remote sensing). To the best of our knowledge, this paper is the first of its kind to utilize environmental variables to provide estimates of poverty and inequality for lower-level units of administration in China.
The results suggest that environmental variables do matter in small area poverty and inequality analysis. By using environmental variables, it was possible to construct consumption models with more predictive power and more desirable disturbances (smaller location effects), which lead to more precise poverty predictions. In terms of targeting implications, allowing environmental variables into the prediction models altered the patterns in the poverty map, suggesting that targeting errors may result from a failure to consider environmental factors. Thus, the current data and method used in many poverty-mapping exercises might be better able to identify and target poor areas if environmental variables could be introduced into the analysis.
In terms of the feasibility of geographic targeting of poverty interventions in rural China, we found that many counties and townships have very low levels of inequality. This suggests that area-based targeting on small units may be feasible. But any effort to spatially target townships rather than counties must not only carefully weigh the marginal benefits against the marginal cost of this fine-tuned targeting but also needs to take into account the statistical precision of welfare estimates that are being used.
With regard to the comparisons of the results of our poverty map with the official designation of ‘poor counties’ in rural Shaanxi, we found that there seems to be evidence that policy makers in China target some areas which may not be the poorest. Therefore, if poverty mapping can be done accurately and carefully on a broader scale across China's rural areas, it may help channel China's growing fiscal resources directly to the places where they are needed. In this way, poverty mapping analysis can be used to not only reveal patterns that are not otherwise visible, but also could be an effective way in addressing politically sensitive questions in an objective manner.