I. INTRODUCTION
Micro X-ray beams are obtained by using several types of X-ray focusing optics in the laboratory. For example, a recent advanced polycapillary focusing optic gives an X-ray microbeam that is 10 μm in diameter by combining it with a micro focused X-ray tube. In micro-XRF (X-ray fluorescence), the micro X-ray beam irradiates the localized point on the sample, and then XRF analysis is performed at the localized region. In advanced materials and micro-structured devices, micro-XRF analysis is very useful for the analysis of contamination particles on the surfaces of devices. Another important application of micro-XRF is elemental mapping (Tsuji and Nakano, Reference Tsuji and Nakano2011). The sample stage is scanned with a fixed X-ray microbeam. XRF analysis is performed at different positions, leading to 2D XRF images. This technique gives XRF images for which the resolution depends partly on the size of the X-ray beam. However, a drawback of this technique is long acquisition time if the imaging area is large.
Thus, projection-type XRF imaging has been studied. This method does not require a scanning process because the XRF images are obtained using an X-ray CCD camera. Sakurai and co-workers studied a quick XRF imaging method using synchrotron radiation (SR) and an X-ray CCD camera equipped with a 2D collimator (Sakurai and Eba, Reference Sakurai and Eba2003; Sakurai and Mizusawa, Reference Sakurai and Mizusawa2010). Adjusting the SR energy can produce a specific XRF image. A color X-ray CCD camera is also feasible for this process (Strüder et al., Reference Strüder, Epp, Rolles, Hartmann, Holl, Lutz, Soltau, Eckart, Reich, Heinzinger, Thamm, Rudenko, Krasniqi, Kühnel, Bauer, Schröter, Moshammer, Techert, Miessner, Porro, Hälker, Meidinger, Kimmel, Andritschke, Schopper, Weidenspointner, Ziegler, Pietschner, Herrmann, Pietsch, Walenta, Leitenberger, Bostedt, Möller, Rupp, Adolph, Graafsma, Hirsemann, Gärtner, Richter, Foucar, Shoeman, Schlichting and Ullrich2010; Scharf et al., Reference Scharf, Ihle, Ordavo, Arkadiev, Bjeoumikhov, Bjeoumikhova, Buzanich, Gubzhokov, Günther, Hartmann, Kühbacher, Lang, Langhoff, Liebel, Radtke, Reinholz, Riesemeier, Soltau, Strüder, Thünemann and Wedell2011). Photon counting analysis with a color X-ray CCD camera provided elemental XRF images in a short time.
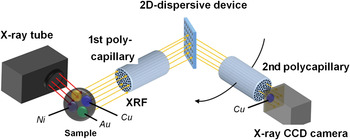
We have studied XRF imaging by using a straight polycapillary optic and a conventional X-ray CCD camera (Tsuji et al., Reference Tsuji, Nakano, Yamaguchi and Yonehara2008; Yonehara et al., Reference Yonehara, Yamaguchi and Tsuji2010). Since a conventional X-ray CCD camera does not have an energy-analysis function, we combined it with a wavelength dispersive spectrometer (WDS). Figure 1 shows a WD-XRF spectrometer equipped with a 2D dispersive device. In this paper, a newly developed 2D dispersive device is reported.
(Color online) WD-XRF spectrometer equipped with 2D dispersive device, polycapillary optics and X-ray CCD camera.

II. EXPERIMENTAL
A. 2D dispersive device
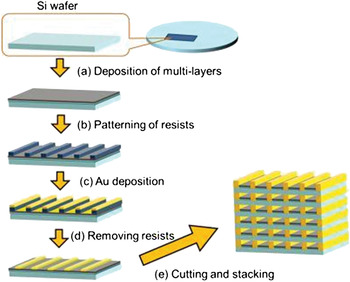
The 2D dispersive device consists of multiple cells having X-ray reflective multilayer coatings on the inner walls. Figure 2 shows the fabrication processes of this device. Firstly, W/C multilayers (d = 7.56 nm, N = 15) were deposited on a 200-μm-thick Si wafer using magnetron sputtering [Figure 2(a)]. Secondly, line and space Au structures were formed on the multilayers using photolithography [Figure 2(b)] and selective metal plating [Figures 2(c) and 2(d)]. The pattern width and thickness of Au structure were 11 and 14 μm, respectively, and the pattern pitch was 20 μm. Thirdly, the Si wafer was cut into 10 mm × 1 mm chips, and then, these chips were stacked vertically. Finally, multilayer coated multiple cells were formed.
(Color online) Fabrication procedure for 2D dispersive device.

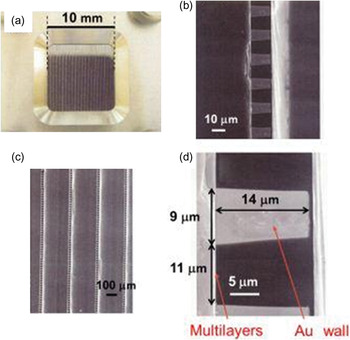
Figure 3 shows the photograph [Figure 3(a)] and SEM images [Figures 3(b)–3(d)] of the fabricated 2D dispersive device with different magnifications. Dimensions of this device is 10 mm × 10 mm × 1 mm, and each pixel size and pixel pitch are 11 × 14 μm2 and 20 × 14 μm2, respectively. Thus, the total pixel number of this 2D dispersive device is 500 × 46, and effective efficiency is estimated to be 3.5%.
(Color online) (a) Photograph of 2D dispersive device. (b)–(d) SEM images with different magnifications.

B. WD-XRF spectrometer
The concept of XRF imaging using a 2D dispersive device is shown in Figure 1. X-ray fluorescence is guided through the straight polycapillary by total reflection. The collimated X-ray beams are, respectively, dispersed by multilayers of the corresponding cells. Therefore, the X-ray CCD camera can obtain images of X-ray fluorescence without losing the information on element distribution on the surface of the sample.
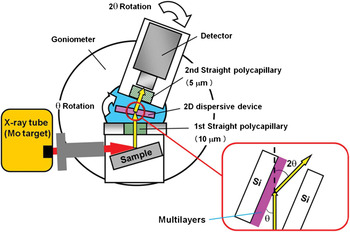
Figure 4 is a schematic drawing of the experimental set-up used in this experiment. The X-ray tube (Mo target) was operated at 40 kV and 30 mA. The sample was irradiated with primary X-rays through an Al collimator with an inner diameter of 8 mm. Straight polycapillary optics developed by XOS Ltd were used. The optics consists of several million capillaries. The first straight polycapillary has a channel diameter of 10 μm, an enclosure length of 10.5 mm and an outer diameter of 8.3 mm with an open area of 60%. The second straight polycapillary has a channel diameter of 5 μm, an enclosure length of 10.5 mm and an outer diameter of 10.7 mm with an open area of 75%. The second straight polycapillary was fixed to the detector. The 2D dispersive device was attached to the centre of an inner rotation stage, as shown in Figure 4. To investigate the fundamental-dispersive characteristics of the device, an EDS detector (Silicon drift detector, Vortex-EX-60, SII Nano Technology USA Inc., sensitive area: 50 mm2, energy resolution: 136 eV at 5.9 keV) was attached to an outer rotation stage. The two rotation stages equipped with stepping motors were controlled by a personal computer using motor drive and a motor controller (NT-2400, Laboratory Equipment Co., Japan).
(Color online) Schematic drawing of the experimental set-up.

III. RESULTS AND DISCUSSION
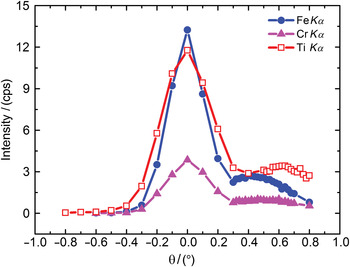
A stainless steel plate and a Ti plate were measured. Figure 5 shows the XRF intensities measured for these plates as a function of rotation angle (diffracted angle). Since the W/C multilayer was deposited on one side of the Si substrate, X-ray diffraction should occur only from this side, as shown in the inset of Figure 4. As expected, additional peaks were only observed at the side of the multilayer in an angle range f 0.3°–0.8° (Figure 5).
(Color online) Relationship between X-ray intensity and an angle (θ).

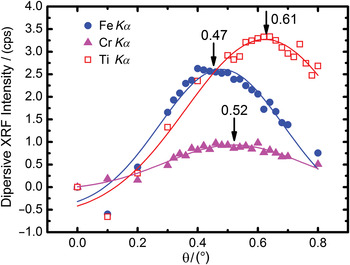
In Figure 5, the strong peak at zero angle represents transmitted XRF X-rays. However, these strong peaks overlap the diffracted peaks. Thus, we assume that the transmitted peaks had a symmetrical shape. Therefore, the transmitted peaks were subtracted from the intensity profiles shown in Figure 5 producing the XRF intensity curves shown in Figure 6. Each curve showed a maximum at a different angle, i.e. FeKα at 0.47°, CrKα at 0.52°, and TiKα at 0.61°. According to the Bragg diffraction equation the peak angle depended on the energy of X-ray fluorescence. These results indicate that the WDS spectrometer shown in Figure 4 performed well, although they were the first results obtained using a newly developed 2D dispersive device.
(Color online) The profiles after the transmitted peak were subtracted from the intensity profiles in Figure 5.

IV. CONCLUSION
We investigated the fundamental characteristics of a 2D dispersive device by using a stainless steel plate and a Ti plate. As a result, we confirmed that the 2D dispersive device performed the role of a WDX spectrometer. The angle for the peak of FeKα was close to that of CrKα; hence difficult to distinguish. This is because the energy resolution of the present system was poor. However, we expect to solve this problem if the periodic length of the multilayer could be shortened. In the future, we plan to replace the EDS detector with an X-ray CCD camera and obtain X-ray elemental images.
ACKNOWLEDGEMENT
Part of this work was supported by the JST (Japan Science and Technology Agency) Adaptable and Seamless Technology Transfer Program (A-STEP).