I
The recent US financial crisis and deep recession has led to renewed interest in the Great Depression of the 1930s.Footnote 2 In particular, the disappointing US recovery from the economic collapse in late 2008 and early 2009 has sparked a debate over the merits of fiscal and monetary policy in addressing the situation. Some economists, such Paul Krugman and Christina Romer, have worried that if measures to provide monetary and fiscal stimulus are withdrawn too soon, the US economy could fall back into recession, just as the recovery from the Depression was interrupted by the recession of 1937–8. Yet there are many unanswered questions about the causes of that recession that make it worthy of reconsideration.
The recession of 1937–8 was America's second most severe economic downturn in the twentieth century, after the Great Depression itself. Real GDP contracted 11 percent and industrial production plunged 30 percent between the second quarter of 1937 and the first quarter of 1938. The civilian unemployment rate, still high in the aftermath of the Great Depression, rose from 9.2 percent to 12.5 percent.Footnote 3 Because this sharp downturn occurred when recovery from the Depression was far from complete, it became known as the ‘recession within a depression’. It set back the recovery from the Depression by two years.
The recession is often blamed on the tightening of fiscal and monetary policies. In terms of fiscal policy, the Roosevelt administration became concerned about large budget deficits and began reducing the growth in government spending and increasing taxes.Footnote 4 In terms of monetary policy, the Federal Reserve and Treasury became concerned about the inflationary potential of excess reserves in the banking system and large gold inflows and therefore decided to double reserve requirements and sterilize gold inflows.
Yet the evidence that these policy changes were responsible for the severe downturn is underwhelming. Although Brown (Reference Brown1956) finds that the fiscal contraction amounted to a swing in demand of 2.5 percent of GDP in 1938, Romer (Reference Romer1992, p. 766) finds a relatively small fiscal multiplier during this period and argues that ‘it would be very difficult’ to attribute most of the decline in output to fiscal policy.Footnote 5 And while Friedman and Schwartz (Reference Friedman and Schwartz1963) put great emphasis on the contractionary impact of higher reserve requirements, subsequent studies have found little support for this conclusion. For example, Calomiris, Mason and Wheelock (Reference Calomiris, Mason and Wheelock2011) note that banks held large excess reserves at the time and that they did not increase their demand for reserves after the new requirements took effect. The reserve requirements were not binding on the banks and therefore they had little, if any, effect on the money multiplier and the supply of money and credit.Footnote 6
If these factors cannot be blamed for the severity of the recession, might the big ‘policy mistake’ of the period have been the sterilization of gold inflows?Footnote 7 Unfortunately, the quantitative significance of the gold sterilization policy has never been fully assessed. Friedman and Schwartz (Reference Friedman and Schwartz1963, p. 544) maintained that ‘The combined impact of the rise in reserve requirements and – no less important – the Treasury gold-sterilization program first sharply reduced the rate of increase in the monetary stock and then converted it into a decline’ (emphasis added).Footnote 8 Yet they did not provide any direct empirical evidence to support the conclusion that the gold sterilization policy was ‘no less important’ than the change in reserve requirements.Footnote 9 Though understudied by economists, the decision by the Treasury Department to sterilize gold inflows from December 1936 until February 1938 turns out to have been a very large monetary shock. By preventing gold inflows from becoming part of the monetary base, this policy brought an abrupt halt to what had been a strong monetary expansion. After growing at about a 17 percent annual rate from 1934 to 1936, the monetary base ceased expanding in 1937. This shift in policy was enormously important because, as Romer (Reference Romer1992) points out, the inflow of gold from Europe – and the consequent expansion of the monetary base and money supply – was the driving force behind the economic recovery from the Depression. The sterilization policy severed the link between gold inflows and monetary expansion.
This article seeks to quantify the impact of the gold sterilization on the money supply and to compare it to the monetary impact of the change in reserve requirements. The contributions of each to the decline in the money supply can, in principle, be traced because the Treasury's policy of gold sterilization operates through the monetary base while the Federal Reserve's policy of higher reserve requirements operates through the money multiplier.
This article reports several findings. First, the change in the monetary base as a result of sterilization was large. As much as a 10 percent increase in the monetary base in 1937 was prevented as a consequence of the program. Second, the monetary base was a more important source of change than the money multiplier in tightening monetary policy during the period going into the recession. This suggests that, although the Federal Reserve is often blamed for its poor policy choices during the Great Depression, the Treasury Department should not be immune from criticism since it was largely responsible for the policy tightening during this period. Third, the end of the sterilization program and the resumption of large gold inflows coincide with the onset of the economic recovery. By contrast, the hike in reserve requirements was only partially rolled back and does not appear to have contributed to the relaxation of monetary conditions. Fourth, the sterilization policy appears to have been transmitted to the real economy through lower asset prices and slightly higher interest rates. Together, these findings suggest that the gold sterilization policy was a key factor behind the 1937–8 recession.
II
The Roosevelt administration's decision to take the United States off the gold standard in April 1933 was the proximate cause of the end of the Great Depression and the start of the economic recovery (Temin and Wigmore Reference Temin and WIGMORE1990; Eggertsson Reference Eggertsson2008). By freeing monetary policy from the responsibility of maintaining a fixed dollar price of gold, the decision permitted a more expansionary policy that ended the deflation, reduced nominal and real interest rates, allowed the foreign exchange value of the dollar to depreciate, and thereby stimulated the economy.
In January 1934, after a period of monetary instability, the United States fixed the price of gold at $35 per ounce. While this did not constitute a formal return to the gold standard, the United States shadowed the gold standard in that changes in gold reserves were reflected in changes in the monetary base. Monetary policy was completely passive to these changes in gold reserves and the Federal Reserve did not engage in any significant open market operations (Friedman and Schwartz Reference Friedman and Schwartz1963; Meltzer Reference Meltzer2003).
The United States also began experiencing large gold inflows starting in 1934, something that is often attributed to the revaluation of gold and political difficulties in Europe. This proved to be the major source of monetary expansion over the next few years. As Romer (Reference Romer1992) argues, expansionary monetary policy was a critical part of the recovery from the Great Depression. Real GDP grew 11 percent a year, on average, between 1933 and 1936.
With the economy operating with substantial excess capacity, this monetary expansion did not lead to a problem with inflation. Wholesale prices were virtually unchanged during 1935 and into the first half of 1936. However, while consumer prices remained steady, wholesale prices began to rise briskly in the second half of 1936. By December of that year, they were 4 percent higher than they had been a year before. Meanwhile, gold continued to pour in from abroad and banks continued to accumulate large excess reserves, which Treasury and Federal Reserve officials increasingly viewed as an inflation risk.
With prices beginning to accelerate and gold inflows contributing to a rising stock market, President Roosevelt also became concerned about overheating, even though unemployment remained quite high. The president wanted to reduce speculative capital inflows – ‘hot money’, he called it – without reducing domestic investment (Meltzer Reference Meltzer2003, p. 505). The debate over the proper response led to a dispute between Treasury Secretary Henry Morgenthau and Federal Reserve Chairman Marriner Eccles. Eccles favored increasing reserve requirements, which Morgenthau opposed for fear that it would reduce bank lending. Morgenthau advocated sterilizing gold inflows, while Eccles equivocated.Footnote 10
Eventually, both policies were adopted. Without informing the Treasury, the Federal Reserve increased reserve requirements for member banks from 13 percent to 19.5 percent in August 1936. In December 1936 the Treasury announced that it would begin sterilizing all changes to US gold reserves, whether they arise from gold inflows or domestic production. In January 1937, the Federal Reserve announced that reserve requirements would be further increased in March and May of that year, to 22.75 percent and then to 26 percent. Thus, between August 1936 and May 1937, reserve requirements for member banks were doubled.
The US economy reached a business cycle peak in mid 1937.Footnote 11 As late as June 1937, the Federal Open Market Committee still viewed gold inflows as the most important problem that it faced. It was also concerned that the Treasury might end its sterilization program (Meltzer Reference Meltzer2003, p. 523). In September, industrial production began to plummet. By October, after a stock market crash and further bad economic news, government officials began to realize that they had a major contraction on their hands.
Policymakers were slow to respond to the sharp downturn in the economy. In February 1938, well into the recession, the Treasury announced that it would no longer sterilize changes in gold reserves unless the change exceeded $100 million in any month. This effectively ended the policy. In April, President Roosevelt officially terminated the sterilization program and the Treasury began to desterilize the balance of gold in the inactive fund. (The next section describes how the sterilization worked.) The president also announced that the Federal Reserve would roll back the last increase in reserve requirements, reducing them from 26 percent to 22.75 percent.
In June 1938, the trough of the downturn was reached, according to both the NBER and Romer (Reference Romer1994).Footnote 12 Thereafter, the economy began a swift recovery. Gold inflows surged in the fall as European fears of war spread due to the crisis over Hitler's territorial demands on Czechoslovakia.
III
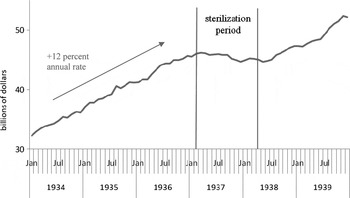
As noted earlier, fiscal policy is generally believed to have been a contributing factor to the recession of 1937-8, but one that is far from being able to explain the severity of the downturn. However, that the US economy was hit by a pronounced monetary shock is beyond dispute.Footnote 13 As Figure 1 shows, the M2 measure of the money supply grew at a fairly consistent 12 percent annual rate between 1934 and 1936. In early 1937, it abruptly ceased growing and actually declined by the end of the year.
US money supply (M2), 1934–9

As noted earlier, economists have failed to uncover convincing evidence that the doubling of reserve requirements was responsible for this shift. Because banks held large excess reserves, the increased reserve requirements were not binding and do not appear to have constrained bank lending (Calomiris et al. Reference Calomiris, Mason and Wheelock2011). Furthermore, banks did not seek to build up their excess reserves to their previous level. This leaves the gold sterilization policy as the potentially important monetary factor in the downturn, but one whose quantitative significance has never been fully explored.
How did the sterilization policy work? The Treasury Department purchased all gold inflows at $35 per ounce with drafts from its balance at the Federal Reserve. Normally, it would print gold certificates for the equivalent amount and deposit them in a Federal Reserve account to replenish its balance. The certificate would then become part of the monetary base and could be used to increase bank reserves. However, with sterilization, instead of replacing its withdrawn balance with a gold certificate in equal amount, the Treasury kept the certificates in an ‘inactive’ account where they could not be used for the expansion of credit. It paid for the gold out of its general fund, reducing its balances at the Federal Reserve, which would then have to be replenished by issuing new debt or raising tax revenue (Johnson Reference Johnson1939).
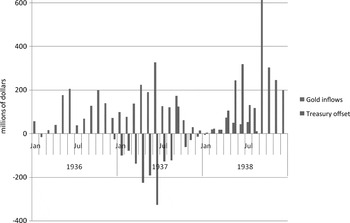
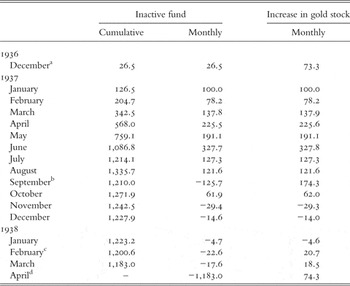
Figure 2 shows monthly data on the changes in the gold stock (largely driven by gold inflows from abroad) and the offsetting Treasury action. The program began at the end of December 1936. From January through August 1937, the Treasury offset dollar-for-dollar any increase in its gold holdings. In Figure 2, this policy is reflected in a bar of equal and opposite sign to the change in gold holdings. In September 1937, at the request of the Federal Reserve, the Treasury desterilized $300 million to meet seasonal demand for currency, not to address the economic downturn. It resumed sterilization in October.
Change in gold holdings and Treasury sterilization
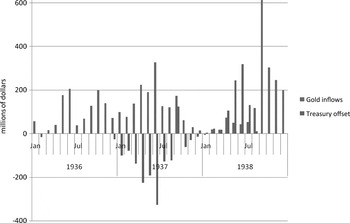
By this time, the US economy was clearly in a recession, and financial markets became suspicious that the Roosevelt administration might consider a devaluation of the dollar (an increase in the dollar price of gold) to deal with the situation. This is exactly how the Roosevelt administration dealt with the Great Depression when it took office, so there was clearly a precedent for such an action. As a result, gold inflows into the United States came to an abrupt halt. From November 1937 through January 1938, the United States actually lost a small amount of gold, and sterilization worked in reverse: the loss of gold did not translate into a reduction in the monetary base because it was offset by the Treasury's release of gold from its inactive account.
The sterilization program was effectively ended in February 1938, when the Treasury announced that it would no longer sterilize changes in gold reserves that were less than $100 million. In February and March 1938, gold inflows were extremely small and were not sterilized.
The Treasury program was formally terminated in April. The Treasury then shifted about $1.3 billion from its cash holdings to deposits in Federal Reserve banks. However, this was just an accounting change with no monetary effect; it was not until the Treasury spent the funds that they were actually monetized.Footnote 14 The Treasury's exit strategy was to desterilize its inactive gold holdings gradually, although nearly half of the inactive gold was monetized within a month and a half, that is, $670 million from mid April to the end of June (Federal Reserve Bulletin, July 1938, p. 557).
The release of the inactive gold allowed growth in the monetary base to resume. But fears that the Roosevelt administration might address the recession by devaluing the dollar meant that gold was still not flowing back to the United States. In the absence of gold inflows, and once the inactive gold had been fully desterilized, the monetary base would stop growing again. In June, President Roosevelt and Treasury Secretary Morgenthau firmly denied that they had any plans to devalue the dollar. Yet gold inflows did not resume in significant amounts until the crisis over Czechoslovakia in September led to fears of war and capital flight from Europe.
The magnitude of the sterilization operation was enormous. Between December 1936 and August 1937, the Treasury sterilized all the increase in the domestic gold stock. At its peak, in early September 1937, the Treasury had accumulated $1.4 billion in inactive gold reserves. This amounts to 10 percent of the monetary base as of December 1936.
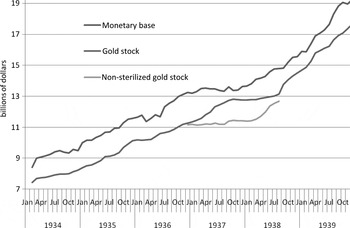
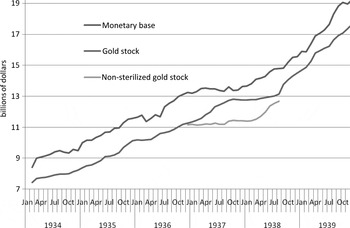
The relationship between gold reserves and the monetary base is shown in Figure 3. Gold reserves constituted about 85 percent of the monetary base through this period, and therefore changes in the gold stock had a pronounced impact on the monetary base. As the figure shows, the gold stock and the monetary base rose together from 1934 to 1936. The gold stock continued to increase in 1937, but the increase was sterilized and so the monetary base remained flat. The flat ‘non-sterilized gold stock’ line shows the amount of monetary gold in the financial system. Then, in late 1937, gold stopped flowing into the country and the country's gold stock remained largely unchanged.
Gold stock, non-sterilized gold stock and monetary base
To characterize the relationship between the two variables more formally, consider the following simple regression of the change in the log of the monetary base on the change in the log of the gold stock:
 $$\Delta \log \lpar \hbox{monetary base}_{\rm t} \rpar = \alpha + \beta \Delta \log \lpar \hbox{gold stock}_{\rm t} \rpar + \varepsilon_{\rm t}$$
There should be a strong relationship between the change in the gold stock and the change in the monetary base between 1934 and 1936, but not after that point if sterilization is not taken into account. The potential for a structural break in the relationship can be tested by including a dummy variable that represents the sterilization period (December 1936 through January 1938).
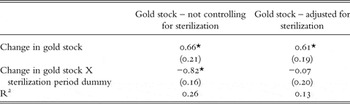
The results in Table 1 simply confirm the pattern in Figure 3. Changes in the gold stock explain changes in the monetary base very well, except during the period of sterilization. The coefficient on the interaction between the change in the gold stock and a dummy variable representing the sterilization period is nearly equal and opposite to the sign of the coefficient on the change in the gold stock, reflecting the sterilization offset. By contrast, the relationship between the monetary base and a measure of the monetized gold stock (adjust for sterilization) shows no structural break during this period.
Impact of changes in gold reserves on the monetary base dependent variable: change in monetary base
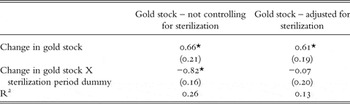
Note: time period: March 1934 – December 1939 (N = 70). Robust standard errors in parentheses. The second regression includes a dummy variable for September 1938, as it is unclear how the small remainder of the sterilized gold was desterilized. *indicates statistical significance at 5 percent level.
Furthermore, this equation can be estimated for the period through 1936 and then used to generate an out-of-sample forecast of the monetary base using actual gold flows. This indicates how the monetary base would have behaved without sterilization, given the actual changes in the gold stock. This confirms the earlier conclusion that, by the fourth quarter of 1937, the monetary base was 10 percent smaller than it would have been had gold not been sterilized.
Such a forecast raises the question of whether the observed inflows of gold in 1937 can be taken as given, or whether they were affected by the sterilization program. One argument is that the observed gold flows between December 1936 and August 1937 were unaffected by the sterilization program. The increase in the gold stock during the sterilization period was not out of line with that previously observed. Gold inflows grew at a 15 percent average annual rate between 1934 and 1936 and at a 15 percent annual rate in 1937 up to October of that year. The ongoing fears of war in Europe might have ensured the continued flow of gold to the United States in the absence of the sterilization program. It was only when fears of devaluation emerged, in reaction to the economic downturn caused in part by the sterilization, that the gold stopped flowing in. Indeed, to the extent that sterilization contributed to the sharp recession in the second half of 1937, and led to fears of a devaluation, it clearly reduced gold inflows into the United States.
A counter argument is that the sterilization program led to additional gold inflows. Hanes (Reference Hanes2006) finds that interest rates rose slightly around the time that the sterilization program was put into operation. This might have attracted gold to the United States that otherwise would not have come. This would make the conclusion that sterilization reduced the monetary base by 10 percent an overestimate.
IV
The gold sterilization program and the doubling of reserve requirements occurred at roughly the same time, making it difficult to determine which was most responsible for change in the money supply.Footnote 15 Yet some assessment of the relative importance of the Federal Reserve's decision to increase reserve requirements and the Treasury's decision to sterilize gold inflows is necessary in order to reach a conclusion about the role of different economic policies during the 1930s.
One way the two policies can be disentangled is to note that Treasury's gold sterilization affected the monetary base, whereas the Fed's reserve requirement increases affected the money multiplier (via the deposit–reserve ratio). We have already seen that the sterilization program had a significant impact on the monetary base. Did changes in reserve requirements have a significant impact on the deposit–reserve ratio, and hence on the money multiplier and money supply?
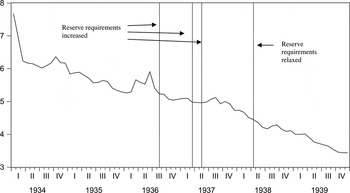
Figure 4 shows the path of the deposit–reserve ratio from 1934 to 1939. The first three vertical lines denote the increase in reserve requirements and the last the relaxation of reserve requirements. If the change in reserve requirements had an immediate impact on monetary conditions, we would expect to see a drop in the deposit–reserve ratio after an increase in the requirements and a rise in the ratio after a decrease in the requirements. The deposit–reserve ratio declines secularly over this period, but surprisingly, the ratio flattens out during the period when the reserve requirements were increased. Not until the very end of 1937, in December, well after the final increase in reserve requirements and the start of the recession, does the ratio begin to decline, but then only in line with its previous trend rate of decline.
The deposit–reserve ratio, 1934–9
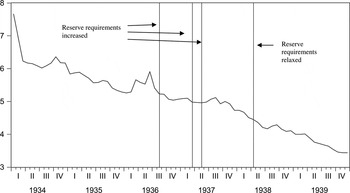
This pattern is not consistent with the reserve requirements leading to tighter monetary conditions. In addition, the relaxation of the reserve requirements does not lead to an increase in the deposit–reserve ratio, as we might be expected. This makes it hard to attribute the easing of monetary conditions, that is, the resumption of growth in the money supply in late 1938, to the relaxation of reserve requirements. These patterns support the findings of Calomiris et al. (Reference Calomiris, Mason and Wheelock2011) that the higher reserve requirements were not binding.
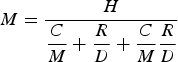
To distinguish the contributions of sterilization and reserve requirements in terms of their impact on the money supply, we can undertake a decomposition in the spirit of Cagan (Reference Cagan1965). The money stock M (measured by M2) is equal to
 $$M = \displaystyle{H \over {\displaystyle{C \over M} + \displaystyle{R \over D} + \displaystyle{C \over M}\displaystyle{R \over D}}}$$
where H is high powered money (the monetary base), C is currency in the hands of the public, R is reserves, and D is deposits. The change in the money supply can be decomposed into the changes in these components:
 $$\Delta \log \lpar M \rpar = \Delta \log \lpar H\rpar + \displaystyle{M \over H}\left({1- \displaystyle{R \over D}} \right)\Delta \left({ - \displaystyle{C \over M}} \right) + \displaystyle{M \over H}\left({1- \displaystyle{C \over M}} \right)\Delta \left({ - \displaystyle{R \over D}} \right)$$
where the first component is the contribution of the monetary base, the second is the change in the currency-money ratio, and the third is the change in the reserve-deposit ratio.
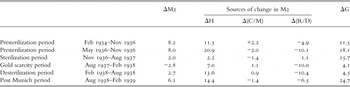
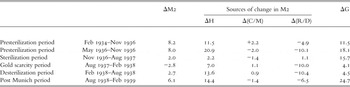
Table 2 presents the results for six key periods. Two pre-sterilization periods are considered, from February 1934 to November 1936 and the shorter six-month period May–November 1936. In the two years prior to the sterilization of gold, the gold stock and high-powered money (the monetary base) grew at an annual rate of 11.5 percent. Changes in the currency–money ratio were relatively small, but the higher reserve–deposit ratio meant that M2 grew at only about 8 percent. In the six months prior to the implementation of the sterilization program, gold reserves and high-powered money increased at an annual rate of about 20 percent, but M2 growth was still about 8 percent due to an increase in the reserve–deposit ratio.
Sources of (annualized) change in M2
Data sources: M2: Friedman and Schwartz (Reference Friedman and Schwartz1970, table 1, column 9). High-powered money: Friedman and Schwartz (Reference Friedman and Schwartz1963, table B-3, column 1). Currency–money ratio: Friedman and Schwartz (Reference Friedman and Schwartz1970, table 1, column 1). Reserve–deposit ratio: Friedman and Schwartz (Reference Friedman and Schwartz1963, table B-3, column 2). Gold reserves: Board of Governors of the Federal Reserve System (1943, table 156).
Figures may not sum to ΔM2 due to approximation error.
Over the nine months during which gold inflows were sterilized, from December 1936 to August 1937, the gold stock increased at a 16 percent annual rate, but high-powered money only increased at about a 2 percent pace. During this period, the small changes in the reserve–deposit and the currency–money ratios offset each other. Thus, the sharp slowdown in the growth of high-powered money was almost entirely responsible for the marked deceleration in the growth of the money supply.
During the gold scarcity period, August 1937 to February 1938, gold inflows largely ceased, so that sterilization made little difference. Gold inflows increased only 4 percent, while the monetary base increased by a greater amount because of the one-time desterilization of $300 million in September 1937. However, an increase in the reserve–deposit ratio offset the increase in high-powered money and M2 actually fell.
From February 1938 to August 1938, the Treasury desterilized its gold accumulation, allowing high-powered money to increase at nearly a 13 percent annual rate even though gold inflows remained at a low level. However, this was not fully offset by a continued rise in the reserve–deposit ratio and the money supply expanded.
Finally, starting in August 1938 and with the Czechoslovak crisis in Europe, gold inflows resumed and, with the sterilization program having been abandoned, monetary growth as well. Gold reserves increased at an annual rate of more than 24 percent in the six months after August, allowing high-powered money to grow more than 14 percent, with the offset coming from the reserve–deposit ratio.
There is no doubt that the increase in the reserve–deposit ratio generally acted as a break on monetary expansion during this period. However, the changes in the reserve–deposit ratio are not closely associated with the change in reserve requirements. In the period around the last two increases in requirements in early 1937, the reserve–deposit ratio is largely unchanged. This is not what we would expect if the changes in reserve requirements were binding on banks and an important determinant of the reserve–deposit ratio. On the other hand, during the period from November 1936 to August 1937, to judge by the increase in gold reserves, we would have expected the monetary base to increase about 16 percent. Yet sterilization held it back to about 2 percent. Thus, in the absence of sterilization, we would have expected the growth of the money supply to continue at its previous pace instead of declining sharply.
V
The fact that gold sterilization produced a marked slowdown in the growth of the money supply says nothing about the way this shock was transmitted to the real economy. This article deliberately stops short of formally examining the impact of these monetary changes on the real economy. Economists who have studied the 1930s have broadly concluded that the monetary shocks of the period were an important source of fluctuations in real economic activity (Romer and Romer Reference Romer and Romer1989; McCallum Reference Mccallum1990; Romer Reference Romer1992, Bordo, Choudhri and Schwartz Reference Bordo, Choudhri and Schwartz1995; Velde Reference Velde2009; Beckworth and Hendrickson Reference Beckworth and Hendrickson2011). Thus, it does not seem unreasonable to conclude that the sterilization policy succeeded in suppressing incipient inflationary pressures, but at the cost of a major recession.
However, it may still be useful to explore briefly the mechanisms by which the monetary changes may have affected the real economy.Footnote 16 Changes in monetary conditions are transmitted to the economy through changes in asset prices, interest rates, bank lending (credit channel) and exchange rates (Mishkin Reference Mishkin1995). This section presents informal data on each simply to explore which of these transmission channels might be operational. In this episode, there is evidence that the asset price and interest rate channels, and perhaps even the bank lending channel, were all operative in reducing economic activity. There is little evidence that the exchange rate was an important channel at this particular time.
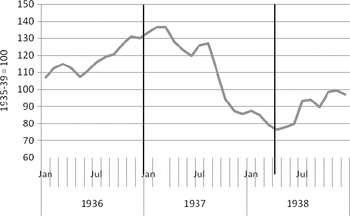
Asset prices as measured by the value of stocks moved significantly with the Treasury action. Figure 5 shows that stock prices peaked in February 1937, just after the start of the Treasury program but several months before the official start of the recession. Stock prices dropped 44 percent between February 1937 and April 1938, a slide in stocks that was nearly as large in percentage terms as the stock market crash between early September and early November 1929.
Stock price index (common stocks), 1936–8
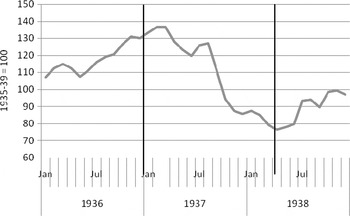
This sharp decline in equity values would adversely affect investment by reducing Tobin's q (the market value of firms relative to the replacement cost of capital) and adversely affecting consumption by reducing financial wealth. The change in stock prices occurs immediately after the change in gold policy, suggesting that asset prices were not being driven by contemporaneous developments in the economy. But this still leaves us with uncertainty about the causal mechanism: it could be that the monetary shock triggered the stock market decline which led to the recession, or it could be that the monetary shock led to the expectation of a recession which led to the decline in stock prices.
Stocks began to recover in April 1938 when the sterilization program was officially terminated but two months before the end of the recession. But here too, it is not clear if the stock market recovery was driven by the end of sterilization itself or by the expectation that the economy would recover.
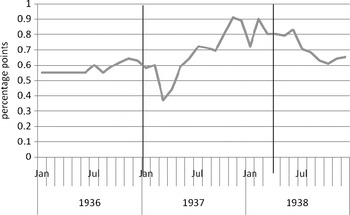
There is also evidence that interest rates responded to the sterilization program. Figure 6 presents the interest rate spread between commercial paper and Treasury bills. The paper-bills spread widened about 30 basis points from the start of the sterilization program until its termination. While the interest rate on Treasury bills was largely unchanged during this period, interest rates on prime commercial paper rose from 0.75 percent to 1.0 percent in April 1937, about three months after the Treasury began sterilizing gold inflows. Prior to this uptick, the rate had been about 0.75 percent for nearly two years. The rate remained at the higher level until March 1938, one month after the Treasury ended its sterilization policy, when it fell to 0.88 percent. It continued to fall to 0.69 percent by September as the Treasury desterilized its gold holdings.
Interest rate spread: prime commercial paper – Treasury bills
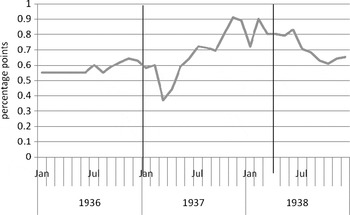
Hanes (Reference Hanes2006) indentifies a specific channel by which gold sterilization affected interest rates – through the supply of non-borrowed reserves. His analysis of the 1930s shows that bond yields were negatively related to non-borrowed reserves, even when the overnight rate was zero. Gold sterilization, by reducing the supply of short-term, risk-free non-borrowed bank reserves, led to a tightening of credit that helped slow the economy. Like Figure 6, Hanes shows that interest rates on various assets (corporate bonds and Treasury bonds, notes and bills) all rose with the beginning of gold sterilization. At the same time, he finds that bond yields are unrelated to changes in reserve requirements. This is consistent with the conclusion that reserve requirements were not a key factor during this period.
A third transmission channel is that through credit or bank loans. Data on new loans is not available during this period, but the Federal Reserve Bulletin reported quarterly data on the value of outstanding bank loans (with some missing observations). The value of bank loans is not a good indicator of new lending because changes may be related to repayments or write downs and defaults. That said, the value of outstanding loans fell 6 percent between the second quarter of 1937 and the second quarter of 1938 (Bulletin, June 1939, p. 501). (No data were reported for the third quarter of 1937.)
Finally, in terms of exchange rates, one might expect that tighter monetary conditions would lead to an appreciation of the dollar, which would reduce net exports. Yet there is no clear appreciation of the dollar during the period of gold sterilization. The dollar remained stable against the Canadian dollar, appreciated somewhat against the French franc, and depreciated against the British pound for most of 1937. With several countries managing their exchange rates and intervening in foreign exchange markets, the exchange rate channel may have been less important as a way of transmitting monetary shocks during this particular period.
In sum, the period of gold sterilization is closely associated with significantly lower equity prices and higher interest rates. The asset price and interest rate movements were likely to have been the way that slower monetary growth affected consumption and investment decisions and thereby reduced real GDP.
VI
The recession of 1937–8 is often cited as illustrating the dangers of withdrawing fiscal and monetary stimulus too early in a weak recovery (Romer Reference Romer2009). This article focuses on an understudied change in monetary policy, the decision to sterilize gold inflows during 1937. This decision was made by the Treasury Department rather than the Federal Reserve. The findings presented here suggest that it largely stopped the growth of the monetary base in the period leading into the recession. The monetary base had been growing at a 15 percent annual rate in the months prior to sterilization, so the policy contributed to a significant slowdown in the growth rate of the money supply. Conversely, when the sterilization program was reversed, growth in the money supply resumed and the economy began to recover.
Appendix
Treasury sterilization operations (millions of dollars)