Introduction
Australia's National Critical Care and Trauma Response Centre (NCCTRC) has been tasked with providing a medical response capability for Northern Australia. It does so through providing federal support to the Royal Darwin Hospital as a “forward receiving” hospital in times of mass casualty or disaster, and providing trained response teams and regionally appropriate response equipment for northern Australian or international disasters. It also serves as an operationally focused center of research and education for remote trauma and disaster medicine. The NCCTRC is based in Darwin, capital city of the Northern Territory, Australia. Darwin and its surrounding regions are collectively termed the “Top End” of Australia, and like much of Southeast Asia to its north, experiences two tropical seasons annually, the dry and the wet. The dry season typically produces warm to hot ambient temperatures with low to moderate levels of relative humidity. The wet season is characterized by hot ambient temperatures and high levels of environmental moisture, and poses a significant challenge to thermoregulation, increasing the risk of exertional heat illness when undertaking physical activity. The consequences can be severe, as demonstrated by the death of an Australian Defence Force soldier from exertional heat illness while participating in a Top End training exercise during the wet season. The coroner's report into the death identified 65 cases of heat-related illnesses on similar courses over a 15-week period during the 2003-2004 wet season.Reference Cavanagh1
Despite the risks, there is insufficient data detailing the interaction between tropical conditions and emergency responders (particularly health workers) in the field. In contrast, the physiological responses to hot laboratory conditions in occupational and athletic settings have been well documented. Physical activity in hot conditions results in endogenous heat production that increases cutaneous blood flow and sweating in an attempt to dissipate such heat.Reference Lee, Katsuura, Harada and Kikuchi2, Reference Patterson, Warlters and Taylor3 A decrease in mean arterial pressureReference Nybo and Nielsen4 and compensatory increase in heart rate seeks to meet demand from the active musculature and the cutaneous circuit, resulting in high heart rates during physical activity in hot conditions.Reference Lee, Katsuura, Harada and Kikuchi2, Reference Galloway and Maughan5 Sustained activity in the heat manifests in high core and skin temperatures,Reference Gonzalez-Alonso, Teller, Andersen, Jensen, Hyldig and Nielsen6, Reference Parkin, Carey, Zhao and Febbraio7 high sweat ratesReference Brearley and Watkins8 and physiological strain.Reference Moran, Shitzer and Pandolf9
The majority of emergency responder thermoregulatory research has focused on the uncompensable laboratory conditions produced by personal protective equipment and warm to hot environments to demonstrate that heat storage is a product of work rate due to the limited ability to dissipate heat.Reference Cheung and McLellan10, Reference McLellan and Selkirk11 Such a scenario is different from the challenges faced by Australian Medical Assistance Teams (AUSMATs) that can be rapidly deployed to local, national, or international disaster areas at short notice in order to supplement the local response. Southeast Asia and the Pacific Ring of Fire are prone to natural disasters, and have witnessed several man-made and terrorist events in recent years. This means a high probability of deployment by AUSMATs to tropical regions where the harsh environmental conditions, combined with limited access to personal cooling, may result in high levels of physiological strain, high sweat rates, concomitant dehydration and exertional heat illness. This report assesses the physiological responses of medical responders to a simulated field emergency in tropical conditions. It represents the first stage of a planned review of risks of exertional heat illness, and an evidence-based approach to heat mitigation for medical field responders.
Methods
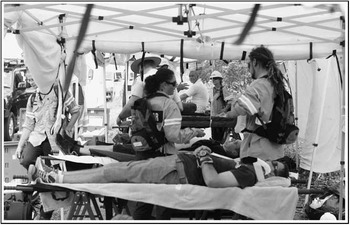
An exercise involving a simulated shopping center collapse and fire was conducted at the Northern Territory Emergency Services training facility at Yarrawonga, NT, Australia on May 12, 2010. Police, fire, and ambulance services and the medical response team comprising 10 doctors, nurses and paramedics were involved in the rescue, triage, treatment and then transport of 71 victims. These victims were moulaged volunteers from the police and emergency services, and had injuries ranging from minor to severe, with several fatalities. The medical team under study responded under normal protocols to the scene to assist the ambulance service, which had provided initial triage of the victims. Northern Territory disaster planning for large mass-casualty events involves the early arrival of a medical response team to set up a casualty clearing post (CCP) and allow stabilization of the injured awaiting transport to the hospital. The team was required to set up a portable shade facility, and deploy medical equipment and stretchers to create a functional CCP (Figure 1). Patients were subsequently re-triaged on arrival at the CCP, and received simulated treatment before being prepared for transport, loaded into ambulances and driven off the exercise compound. During their response, the medical team members had their gastrointestinal temperature, chest skin temperature and heart rate continually measured, and fluid balance variables assessed, prior to and following the exercise.
The Casualty Clearing Post

Participants and Ethical Approval
Ten doctors, nurses and paramedics (four men, six women) volunteered and provided written informed consent for this study, which was approved by the Human Research Ethics Committee of the Northern Territory Department of Health & Families and Menzies School of Health Research, Northern Territory, Australia. Subjects were not compensated for their participation. The subjects had a mean (standard deviation) age of 38.4 (8.5) years, height 1.71 (0.09) m, mass 68.8 (13.4) kg, body mass index (BMI) of 23.2 (2.9), had been residents of the Northern Territory for 6.9 (4.8) years and undertook 7.2 (4.8) hours of outdoor exercise per week.
Physiological Measures
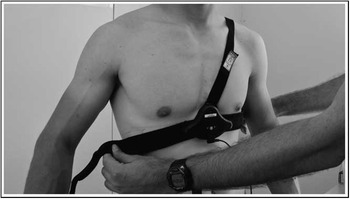
Gastrointestinal temperature was measured by an ingestible sensor (Jonah, VitalSense, Respronics, Pittsburgh, Pennsylvania USA) consumed with breakfast, four hours prior to commencement of the study, allowing adequate time for the pill to empty from the stomach and enter the gastrointestinal tract. The ingestible sensor transmitted the gastrointestinal temperature to a wearable receiver (SEM, Equivital, Hidalgo Ltd, Cambridge, UK) for storage (Figure 2). Skin temperature of the chest (distal sternum) was measured by an infrared thermometer on board the SEM, and heart rate was measured and recorded by the individually coded receivers.
The Equivital Physiological Monitoring Device

Fluid Balance
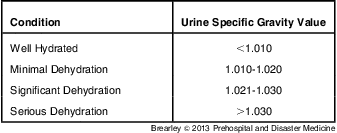
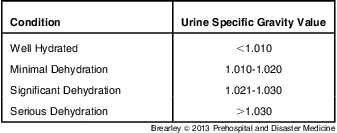
Immediately prior to the exercise, subjects emptied their bladders and provided a urine specimen for assessment of hydration status. Urine specific gravity (USG) was assessed with a refractometer (Atago URC-NE, Tokyo, Japan) according to the manufacturer's instructions following a one-point calibration with distilled water. Urine specific gravity values were subsequently compared to the index of hydration status in Table 1.
Urine Specific Gravity and Equivalent Level of Hydration (data from Casa et alReference Casa, Armstrong, Hillman, Montain, Reiff, Rich, Roberts and Stone26)
Subjects were subsequently weighed in a semi-nude state on a calibrated scale (UC321, A&D Mercury, Adelaide, SA, Australia) to determine pre-exercise body mass, and donned the medical response team uniform of a lightweight nylon shirt and trousers (Columbia Sportswear Company, Boyle, Massachusetts USA), hard hat and enclosed shoes or boots. Subjects were also provided with a personal backpack containing a 3 L hydration reservoir (Oztrail Leisure Products, Brisbane, QLD, Australia) allowing participants to consume fluids ad libitum. The reservoir's mass was determined immediately pre- and post-exercise, the difference equal to the volume of fluid consumed during the exercise. Subjects were weighed pre- and post- toilet breaks to account for urine/fecal output. At the cessation of the exercise, subjects removed their medical uniforms and toweled down to remove unevaporated sweat, and post-exercise body mass was determined. Subjects provided a post-exercise urine specimen for hydration assessment.
Dehydration was expressed as a percentage of body mass by the following equation:
 $$\bf(Body\,Mass\,Loss/Pre\hbox-Exercise\,Body\,Mass){{\:}^\ast} \:100$$
and Sweat Loss (L) was calculated by the following equation:
 $$\bf(Body\,Mass\,Loss\: + \:Fluid\,Consumption - Urine/Fecal\,Output).\eqno\rm$$
It was assumed that 1 kg body mass loss was equal to 1 L of fluid.
Physiological Strain Index
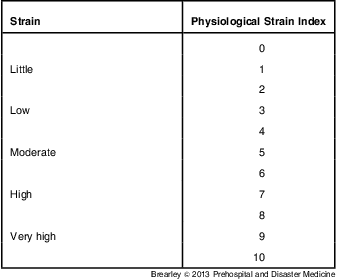
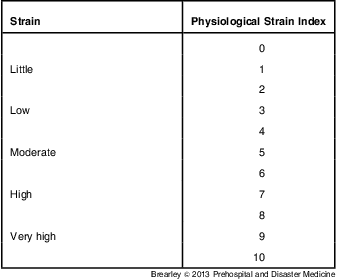
Gastrointestinal temperature and heart rate were input into the physiological strain index equation of Moran et alReference Moran, Shitzer and Pandolf9 for categorization (Table 2).
Physiological Strain Description and Corresponding Numerical Value (data from Moran et alReference Moran, Shitzer and Pandolf9)
Environmental Conditions
Ambient temperature, relative humidity and apparent temperature data were acquired from the Bureau of Meteorology Darwin Airport Weather Station (station number 014015), every 30 minutes during the period from 10:30 am to 1:00 pm when the study was carried out. Weather station 014015 is located 11.4 km from the test site. The Apparent Temperature is defined as the temperature, at the reference humidity level, producing the same amount of discomfort as that experienced under the current ambient temperature and humidity. The apparent temperature is an adjustment to ambient temperature based on the perceived effects of humidity and wind speed to reflect thermal comfort. An apparent temperature less than actual temperature indicates improved thermal comfort and lower potential for physiological stress. Solar radiation is not accounted for by apparent temperature reported in this study.
Statistical Analysis
Statistical analysis was performed using Prism 5 software (GraphPad, La Jolla, California, USA). One-way ANOVAs were utilized to test for changes in core body temperature, chest temperature and PSI over time. A Tukey-Kramer multiple comparisons test was subsequently applied with significance set at P < .05. A paired t-test was used to compare pre- and post-exercise USG. The Pearson correlation coefficient tested the relationship between gastrointestinal temperature and heart rate.
Results
Environmental Conditions
The mean ambient temperature during the 150 minutes of data collection was 29.3°C, with average relative humidity of 50.3%, and wind speed of 21.5 km per hour, resulting in an apparent temperature of 27.9°C. The conditions were anecdotally described by the research team as warm but not hot with a cool, dry breeze. Participants worked mainly under the shade tents available at the CCP, rather than in direct sunlight, with some additional shade being provided by surrounding trees.
Gastrointestinal and Chest Temperature
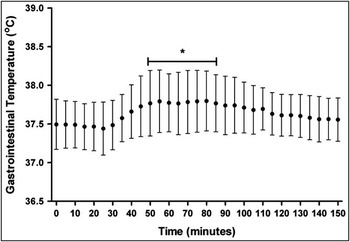
The average gastrointestinal response throughout the exercise is depicted in Figure 3. Commencing the exercise at a gastrointestinal temperature of 37.5°C, a subtle decrease was observed to the 25th minute (37.4°C). Thereafter, gastrointestinal temperature rose significantly (P < .05) by 0.4°C to peak at 37.8°C following 80 minutes of the exercise. The highest individual peak gastrointestinal temperature was 38.5°C, while three subjects had gastrointestinal temperatures exceeding 38°C. Chest temperature rose significantly from 31.2°C to plateau between 34.0 and 34.6°C from the 25th minute to the cessation of the exercise (P < .001).
Mean Gastrointestinal Temperature Throughout the Exercise
* significantly different to 25th minute (P < .05). Error bars indicate standard deviation (SD).

Heart Rate and Physiological Strain Index
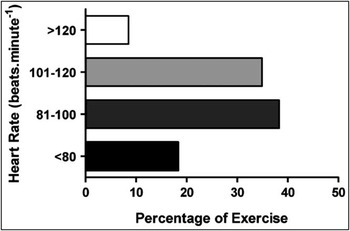
The mean baseline heart rate was 75 beats per minute (bpm), with mean values oscillating within the 90-110 bpm range from the 20th to the 130th minute of the exercise. Overall, 56.9% and 91.8% of the exercise coincided with heart rates of less than 100 and 120 bpm respectively (Figure 4), while the peak individual heart rate was 140 bpm. Compared to resting values, heart rate was significantly elevated from the 25th to 140th minute of the exercise (P < .05). Heart rate at the cessation of the exercise was also significantly higher than at rest (P < .05). There was a significant correlation (P < .001) between gastrointestinal temperature and heart rate with a coefficient of 0.62 and an r squared value of 0.39.
Heart Rate Distribution Throughout the Exercise

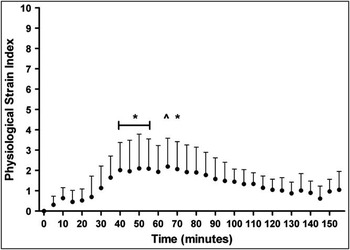
The average physiological strain remained below a value of 1 (little) through the initial 60 minutes of assessment, thereafter rising to oscillate between 1.8 to 2.0 from the 80th minute to cessation of the exercise (Figure 5). Statistical analysis was not conducted to compare exercise values with those at rest as resting values are used to anchor the index at zero. Data were therefore compared to observations at the 25th minute of the exercise, where gastrointestinal temperature attained its nadir. The peak individual physiological strain was 4.5, equating to a descriptor of moderate.
Physiological Strain Index Throughout the Exercise
^ significantly different to 25th minute (P < .01).
* significantly different to 25th minute (P <.05). Error bars indicate standard deviation (SD).

Fluid Balance
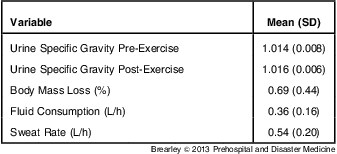
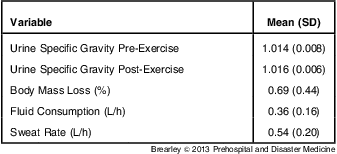
Table 3 provides the summarized fluid balance results. The mean pre-exercise USG was 1.014, with two subjects exceeding a value of 1.021, indicative of significant dehydration. The mean sweat loss was 1.30 L (range 0.85 L-1.85 L), resulting in an average sweat rate of 0.54 L per hour. When expressed relative to body mass, the mean sweat rate was 7.9 mL per hour per kg.
Summary of Fluid Balance Variables
Abbreviation: SD, standard deviation
The mean total fluid intake was 0.84 L, equating to consumption of 0.36 L per hour. Mean dehydration expressed as a percentage of body mass was 0.7% following the exercise, with the corresponding USG averaging 1.016, not significantly different from pre-exercise values (P = .447). Three subjects had USG >1.021 post-exercise.
Discussion
The thermoregulatory challenge presented by physical activity in personal protective equipment under hot laboratory conditions is well documented;Reference Cheung and McLellan10, Reference Aoyagi, McLellan and Shephard12-Reference Van Gelder, Pranger, Wiesmann, Stachenfeld and Bogucki14 however, less is known of the responses while wearing personal protective equipment or standard attire in the field, with the latter a more common scenario for medical responders. Work previously carried out by the NCCTRC with Northern Territory Fire and Rescue Services wearing full fire retardant “turn-out” gear and breathing apparatus, and with medical and non-medical responders wearing Chemical Biological and Radiological (CBR) resistant uniforms has shown extremely high rates of heat storage in short periods of time.Reference Brearley, Heaney and Norton15, Reference Norton, Brearley, Trewin and Hrabar16 This, coupled with the inability to passively cool quickly in tropical conditions, has encouraged the researchers to recommend light-weight quick dry uniforms to medical response teams from the NCCTRC. This investigation demonstrates that the extent of physiological strain experienced by medical responders in light-weight uniforms with ad libitum access to fluids is little to low when undertaking low intensity physical activity in warm conditions.
With a mere 0.3°C average increase in gastrointestinal temperature from rest and a plateau in chest skin temperature between 34.0 and 34.6°C from the 30th minute of the exercise, the medical response team demonstrated the achievement of thermal equilibrium for the majority of the exercise. The disaster scenario was conducted at the start of the local dry season, yet conditions were nonetheless milder than anticipated. Anecdotal feedback from the participants confirmed the favorable conditions, with the apparent temperature of 27.9°C and a mean ambient temperature of 29.3°C, below the average daily maximal temperature for May of 32.0°C. One would intuitively expect harsher environmental conditions to narrow the thermal gradient for heat exchange and promote heat storage by the medical responders in this study, particularly when physical activity is more demanding. Highlighting this point, Australian Defence Force soldiers suffered 65 cases of heat- related illness during 15 weeks of wet season training in 2003-2004, with no cases reported during training conducted during the 2004 dry season.Reference Cavanagh1 The description of the work performed during the Australian Defence Force training appears to be have been more strenuous than the duties of the medical responders, as 56.9% of the simulation corresponded to heart rates <100 bpm. The moderate correlation between heart rate and gastrointestinal temperature (r = 0.61) indicates the potential for higher intensity activity to manifest in substantial heat storage. This prediction is supported by one subject attaining a peak core temperature of 38.5°C with a higher workload, as 9.4% of the exercise corresponded with a heart rate <100 bpm.
The net product of the mild environmental conditions and low work rates was little to low average physiological strain throughout the exercise. A factor likely to have contributed to the low levels of overall physiological strain is the chronic heat acclimatization status of the medical response cohort. Given that heat acclimatization augments heat loss mechanisms, newcomers to tropical conditions are likely to suffer greater levels of physiological strain,Reference Patterson, Warlters and Taylor3 a scenario similar to that faced by some emergency responders deployed to hot regions at short notice. Heat stress was noted as an issue for nurses and physicians responding to the relief efforts following hurricanes Katrina and Rita.Reference Rogers and Lawhorn17 Although the aforementioned survey did not explore the factors that caused the heat stress, deployment into a hot environment without adequate prior exposure could have contributed. The efficacy of light-weight and quick dry material used in the design of the medical response team uniforms has not been specifically studied in this paper, but is presumed to have contributed to the lack of thermal strain recorded in responders. Comparison with data from encapsulated uniforms, even with moderate works rates as seen in CBR suits,Reference Norton, Brearley, Trewin and Hrabar16 may preclude the need for a formal comparison of heavy versus lightweight medical response uniforms.
Utilizing chest skin temperature to be reflective of peripheral temperature, the ~5°C gradient between the skin and environment would permit endogenous heat loss via radiation and convection, particularly with average wind speeds for the Darwin region of greater than 20 km per hour. Such conditions permit a lessened reliance upon evaporative cooling via sweat secretion, a likely contributor to the relatively low sweat rates of 0.54 L per hour observed during this investigation. Sweat rates observed for athletes training or competing in the top end of Australia are generally higher,Reference Brearley and Watkins8 ranging from 0.7 to 1.9 L per hour. Dehydration was 0.7% of body mass lower than anticipated with the aforementioned low work rates, personal access to fluids and mild environmental possible contributors. This is also lower than the one percent loss associated with even mild dehydration and much less than the ~2% deficit which might be associated with endurance performance deficit.Reference Maxwell, Gardner and Nimmo18, Reference Walsh, Noakes, Hawley and Dennis19
Voluntary fluid intake patterns showed inter-subject variability, as previously described for athletes.Reference Maughan, Merson, Broad and Shirreffs20 Overall, fluid intake was insufficient to match sweat losses, however, the 2.5 hour duration did not lead to substantial dehydration. It should be noted that actual shifts can be 12 hours in durationReference Aitken, Leggat, Robertson, Harley, Speare and Leclercq21 with cumulative fluid deficits anticipated to be more severe under such conditions. Whereas ad libitum fluid consumption can manifest in dehydration, particularly where the constructs of the event limit access to fluids,Reference Bergeron, Maresh, Armstrong, Signorile, Castellani, Kenefick, LaGasse and Riebe22 that wasn't the case in this investigation, with subjects wearing individual hydration bladders. Given the differences in pre-exercise hydration status, drinking habits and sweat losses, an individualized approach to assessment is required rather than prescribing a more generalized drinking strategy.Reference Maughan, Watson, Evans, Broad and Shirreffs23
The mean pre-exercise USG of the medical responders (1.014) was suggestive of minimal hypohydration. Similar values have been reported for motorsport athletesReference Brearley and Finn24 and some team sport athletesReference Brearley and Watkins8 but the values in this study were better than those of amateur athletes prior to competition in Australia's Top End.Reference Finn and Wood25 The most convenient defence against the development of dehydration is to commence physical activity in a well-hydrated state. The hydration standards of Casa et alReference Casa, Armstrong, Hillman, Montain, Reiff, Rich, Roberts and Stone26 were used, where well hydrated equates to a USG <1.010. A recent study has defined well-hydrated as USG 1.015-1.017; however, these values represent 24-hour mean values from subjects exercising approximately one hour per week in non-tropical conditions.Reference Armstrong, Pumerantz, Fiala, Roti, Kavouras, Casa and Maresh27
It was anticipated that subjects classified as dehydrated prior to the exercise would consume a greater volume of fluid than their well-hydrated colleagues as described by Maresh et alReference Maresh, Gabaree-Boulant, Armstrong, Judelson, Hoffman, Castellani, Kenefick, Bergeron and Casa28 for low intensity exercise in the heat. However, in this small sample, such a relationship was not observed. This may be attributed to personal behavior patterns, as all subjects had free access to fluids. This is an area requiring education of the medical response team to make full use of the additional impost of the hydration backpacks. While anecdotal feedback regarding the hydration backpacks was generally positive (6/10), several negative comments relating to the backpack mass and subsequently making work more cumbersome were noted (4/10). It is anticipated that improved comfort levels could be achieved by tailoring bladder mass to measured fluid requirements, as 3 L was uniformly provided to all subjects with an average of 0.84 L consumed over the 2.5-hour period.
Overall, the fluid balance variables assessed by this investigation demonstrate that the medical response team did an adequate job of managing their hydration requirements throughout the 2.5 hour exercise. The response team could improve their pre-exercise hydration status to average a USG score <1.010, in order to commence work in a well-hydrated state. The importance of pre-exercise hydration status is likely to be emphasized in harsher environmental conditions, where the physiological responses of medical responses remain to be described. Of particular interest for future research are the physical demands of needs assessment medical teams. Such teams determining the initial medical response to disasters may be required to hike long distances into a disaster zone, carrying enough supplies to be self sufficient for a prolonged period. Higher workloads over a protracted period in tropical wet season conditions could put the medical responders at risk of heat-related illness.
Conclusions
This simulated exercise elicited moderate work rates that, when combined with unseasonably mild environmental conditions, manifested in minimal heat storage, low sweat rates and minimal dehydration. Ad libitum fluid consumption is adequate for chronically heat-acclimatized medical responders to meet their hydration requirements in mild environmental conditions. Whether such an observation can be replicated under a harsher thermal load remains to be investigated.