Introduction
The tourmaline supergroup minerals with general formula XY 3Z 6[T 6O18][BO3]3V 3W, where X = Na, Ca, K and □ (vacancy); Y = Li, Mg, Al, Cr3+, V3+, Fe3+, Fe2+, Mn2+, Ni and (Ti4+); Z = Mg, Fe2+, Al, Fe3+, V3+ and Cr3+; T = Si, Al and (B) (Fe3+); B = B and □; V = OH and O; and W = OH, F and O (Henry et al., Reference Henry, Novák, Hawthorne, Ertl, Dutrow, Uher and Pezzotta2011) are stable over a range of low-temperature hydrothermal to magmatic and high-pressure metamorphic conditions. They are extremely variable in composition and isomorphic substitutions, which allow their consideration as indicators of mineral-forming conditions and as an important prospecting guide (Kuzmin et al., Reference Kuzmin, Dobrovolskaya and Solntseva1979; Slack, Reference Slack, Grew and Anovitz1996; Henry et al., Reference Henry, Sun, Slack and Dutrow2008; Collins, Reference Collins2010; Hinsberg et al., Reference Hinsberg van, Henry and Marschall2011; Baksheev et al., Reference Baksheev, Prokofiev, Zaraisky, Chitalin, Yapaskurt, Nikolaev, Tikhomirov, Nagornaya, Rogacheva, Gorelikova and Kononov2012).
Tourmalines are abundant in tin deposits, which are associated with granitic pegmatite (Adun Chelon, Transbaikal region, Russia; Serra Branca, Brazil; and Bob Ingersoll, USA) and greisens (Badzhal and Sherlovaya Gora in the Transbaikal region, Russia; Kester, Yakutia, Russia; and Cornwall, UK), and belong to intrusion-related cassiterite–silicate–sulfide (Solnechnoe and Festival, Khabarovsk Krai; Valkumei, Chukchi Peninsula; and Deputat, Yakutia in Russia; and San Rafael, Peru) and porphyry (Mramorny district, Russia; Cerro Rico, Bolivia; Taronga, Australia; and Mount Pleasant, Canada) assemblages.
Gorelikova (Reference Gorelikova1988) published bulk compositions of tourmalines and identified some stages of mineral formation at the Solnechnoe deposit and other deposits of the Komsomolsk district in her monograph titled “Paragenetic assemblages of trace elements in tourmalines of tin deposits”. In that study tourmaline species were determined on the basis of infrared spectroscopy and oxidation states of Fe were established with Mössbauer spectroscopy
Later, tourmaline from the Komsomolsk district was reported by Panova (Reference Panova2000), Bortnikov et al. (Reference Bortnikov, Gorelikova, Korostelev and Gonevchuk2008) and Sushchevskaya et al. (Reference Sushchevskaya, Ignatiev and Velivetskaya2009). Panova (Reference Panova2000) showed that solutions from fluid inclusions in tourmaline have log(K/Na) and high log(Cl/F): –0.8 to –0.2 and 1.5 to 2.2, respectively. Bortnikov et al. (Reference Bortnikov, Gorelikova, Korostelev and Gonevchuk2008) reported a positive Eu anomaly and predominant light rare earth elements in the rare earth element distribution patterns of the Solnechnoe tourmalines. Sushchevskaya et al. (Reference Sushchevskaya, Ignatiev and Velivetskaya2009) reported δ18O and δD values of tourmaline of 8.2 to 11.9 and –102.0 to –73.7‰, respectively. The calculated δ18OH2O and δDH2O values indicate a magmatic source for the fluids responsible for the tourmaline formation.
The aim of this study is to determine chemical substitutions which allow tourmalines from the three stages (pre-ore unmineralised massive tourmalinite, molybdenum and tin) at the Solnechnoe deposit to be distinguished. In addition, distinctions of tourmaline compositions of cassiterite–silicate deposits relative to those from greisen and porphyry deposits are considered.
The detailed characterisation of tourmaline generations and modern interpretation of compositional and spectroscopic data significantly adds to the knowledge on the role of tourmaline in the evolution of intrusion-related cassiterite–silicate–sulfide deposits.
Brief geology
The Komsomolsk tin district has been reported in many publications, including monographs (Radkevich et al., Reference Radkevich, Korostelev, Kokorin, Ryabov, Stepanov, Kokorina, Golovkov, Bakulin, Kushev, Seleznev, Klemin and Radkevich1967, Radkevich, Reference Radkevich1971; Gonevchuk, Reference Gonevchuk2002). Most researchers attribute the district to the Cretaceous Myao–Chan magmatic zone. According to Ognyanov (Reference Ognyanov and Khomich1989), the east–west trending Silinka fault separates the palaeoshelf and palaeoslope zones of the Badzhal block within the Komsomolsk district. Monzonitic rocks of the Silinka Complex, a major tin-bearing complex of the Myao–Chan series, crop out along this fault (Left Silinka Valley).
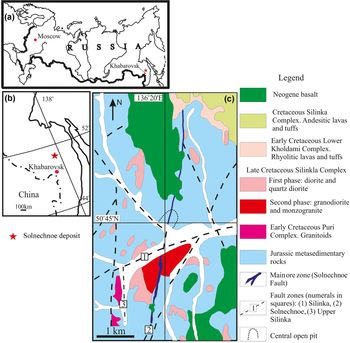
The cassiterite–silicate–sulfide Solnechnoe deposit near the Gorny settlement ca. 270 km NE of Khabarovsk is located in the central part of the Komsomolsk ore district at the intersection of the east–west trending Silinka and near-meridional Solnechnoe faults (Fig. 1a,b). Most of ore bodies at the deposit are hosted by the Late Jurassic intercalated quartz–feldspar sandstone, silty sandstone, and siltstone (Ognyanov, Reference Ognyanov and Khomich1989). The orebodies are localised in the supraintrusion zone of the Silinka granitoid pluton to the north of the Silinka Fault. The pluton consists of three intrusive phases. The first-phase diorite and quartz diorite and the second-phase granodiorite and monzogranite dominate (Fig. 1c). In addition to quartz and feldspars, these igneous rocks are composed of variable proportions of biotite, pyroxene and amphibole; apatite and zircon are accessory constituents. The K–Ar cooling age of the first and second phases determined from biotite is 98–95 and 94–92 Ma, respectively (Gonevchuk, Reference Gonevchuk2002; Gonevchuk et al., Reference Gonevchuk, Gonevchuk and Gorelikova2010). Granite aplites are the third intrusive phase and their K–Ar cooling age determined from the whole rock samples and biotite is 85–80 Ma (Gonevchuk, Reference Gonevchuk2002; Gonevchuk et al., Reference Gonevchuk, Gonevchuk and Gorelikova2010). Basalt flows with clay and lignite intercalations overlap the northern flank of the deposit. On the basis of sporo-pollen complexes from the clay intercalations, basalt flows have been attributed to the Miocene epoch (Rodionov et al., Reference Rodionov, Semenyak, Zabrodin, Khanchuk, Gonevchuk and Seltmann2004). Rodionov et al. (Reference Rodionov, Semenyak, Zabrodin, Khanchuk, Gonevchuk and Seltmann2004) also published the K/Ar cooling age of basalt as 14.8 Ma. Towards the north, the ore-bearing structure occurs in Upper Cretaceous volcanic and sedimentary rocks of the Amut mould hosting the Ozerny tin–polymetallic deposit.
(a,b) Geographical location of the deposit and (c) geological sketch map of the Solnechnoe tin deposit.
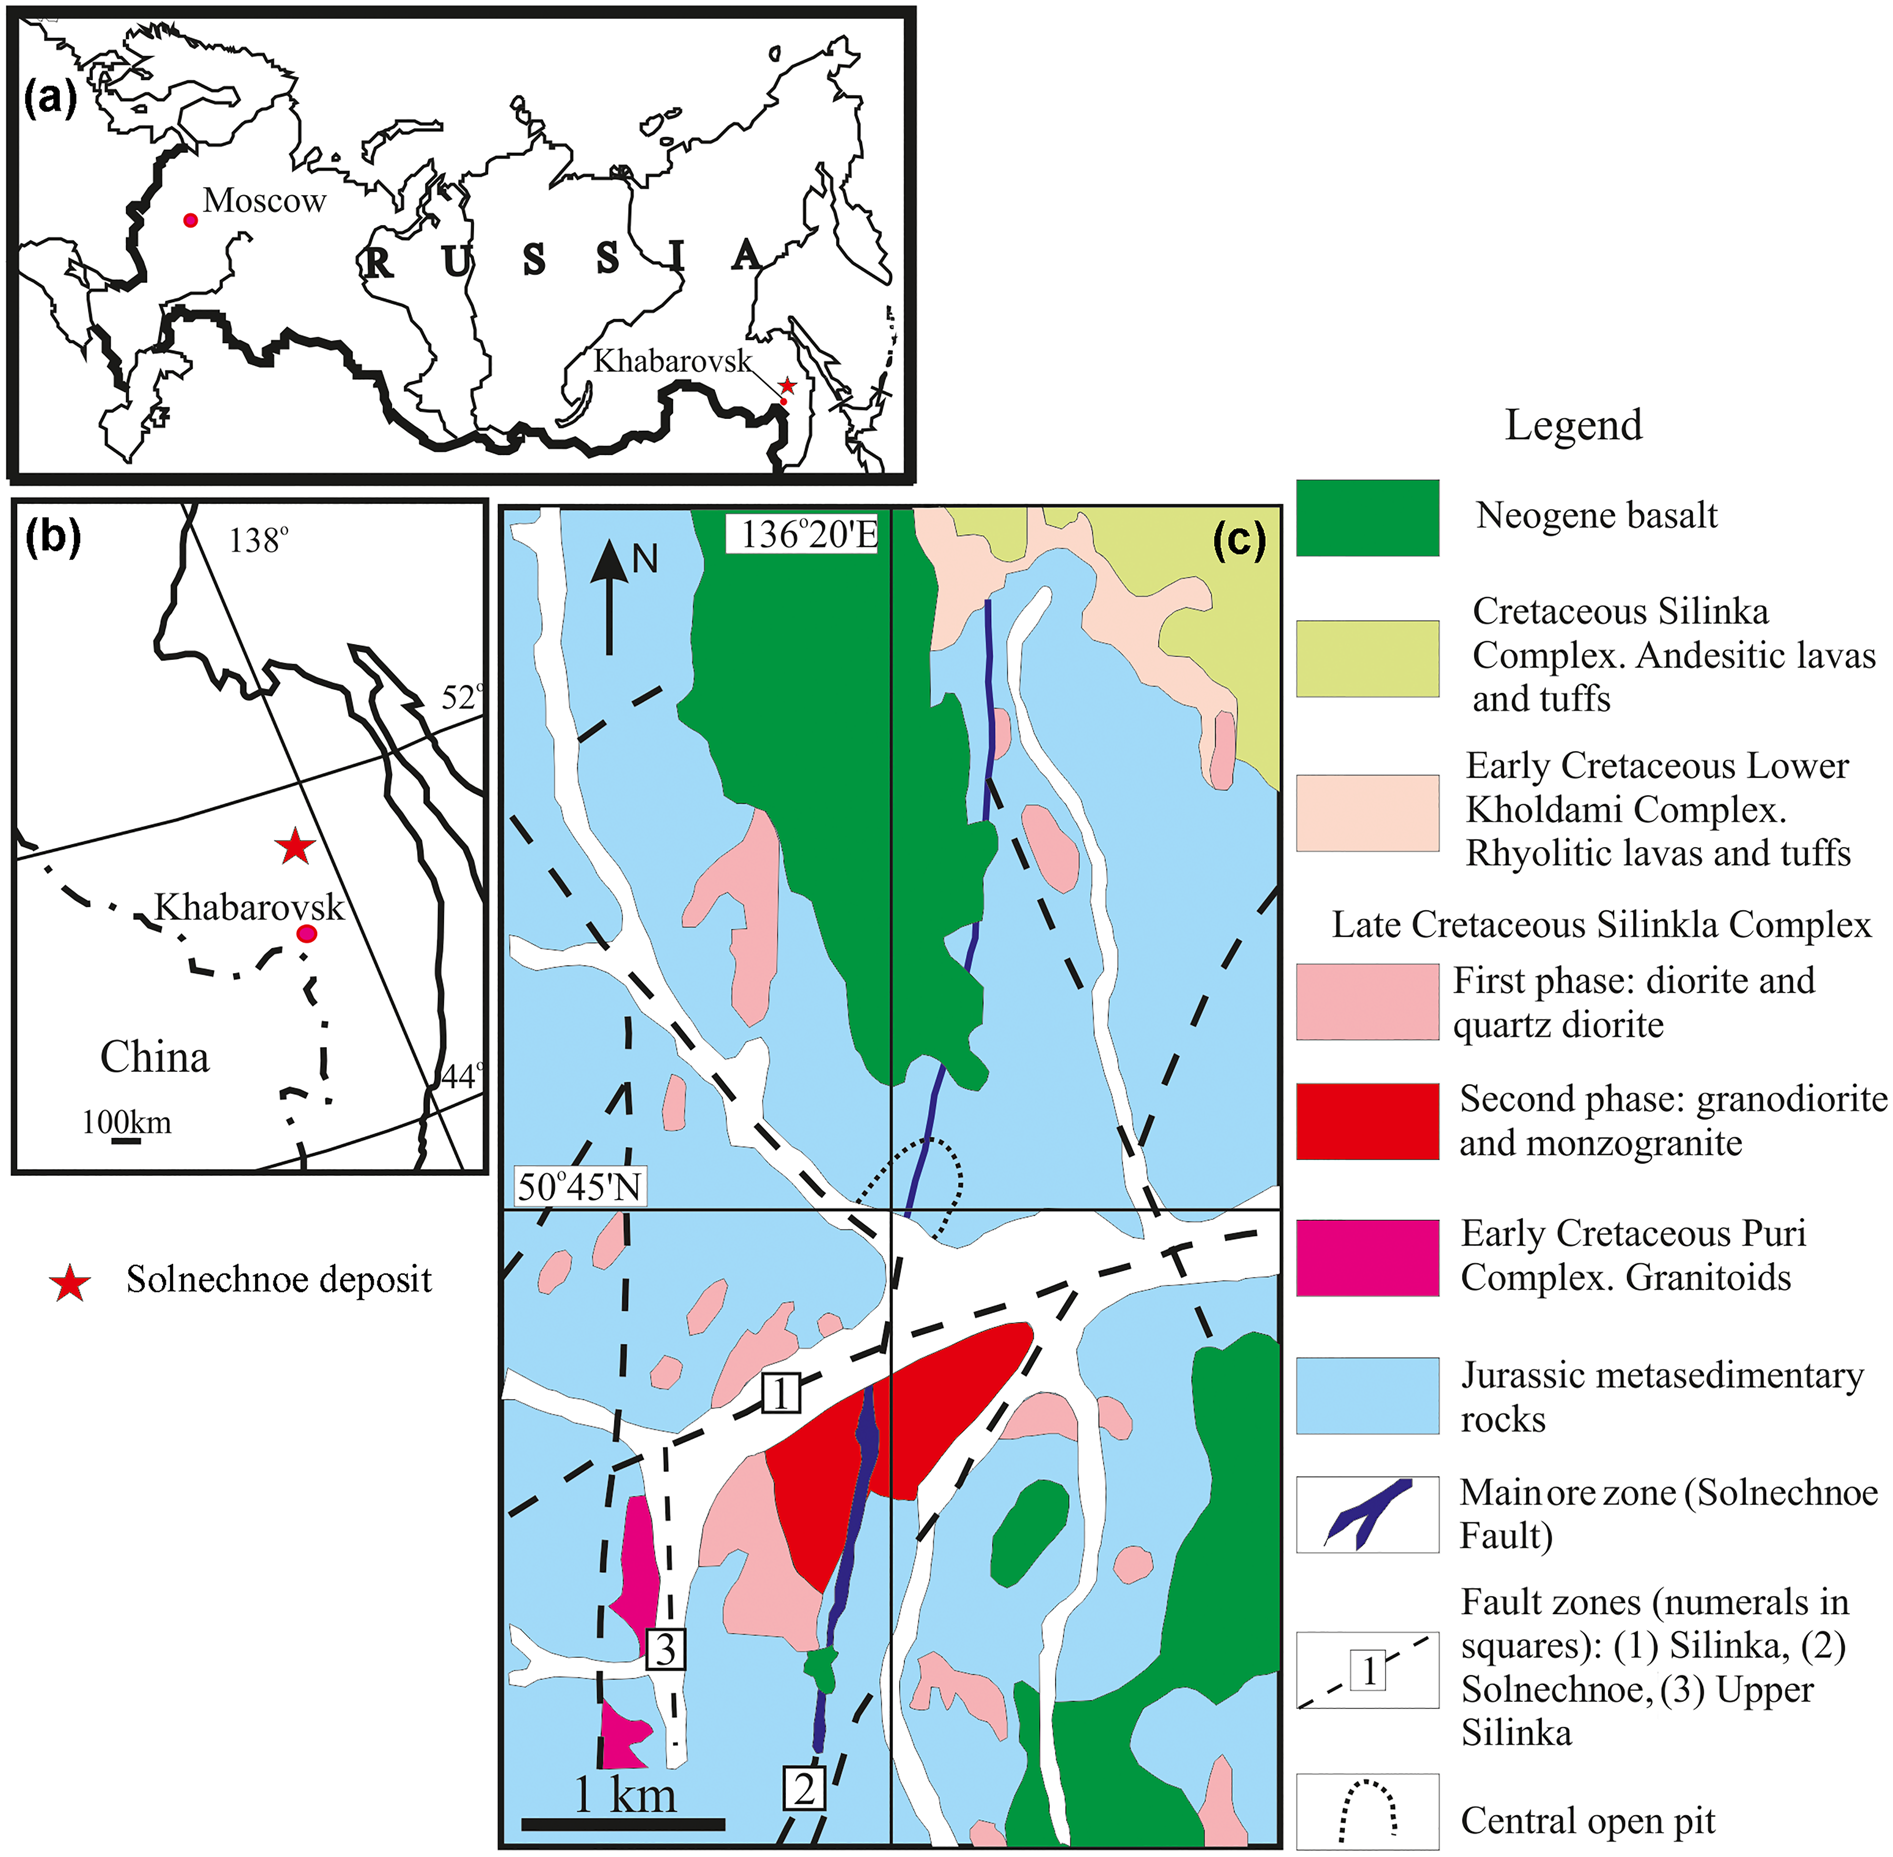
The main part of the tin ore is located in the Main (Glavnaya) Zone (Fig. 1c), which consists of unmineralised quartz–tourmaline alteration (tourmalinite) cut by thick breccia-like quartz–cassiterite bodies and later quartz–sulfide veins. Quartz–tourmaline altered rock replacing metasedimentary rocks in fault zones along near-meridional fractures is surrounded by quartz–sericite alteration, and contains silicified and sericitised fragments of host rocks. Alteration in the hanging wall, where the zone is controlled by a fault, is thin, whereas in the footwall complicated by numerous dykes of porphyritic diorite, the thickness of altered rock increases dramatically up to 115 m. Zones of completely silicified rocks occur at the boundary between tourmalinite and quartz–sericite alteration and are occasional in the axial part of the quartz–tourmaline alteration. Economic intervals within the quartz–tourmaline zone are cut by quartz veins and veinlets, which are products of both quartz–tourmaline–sericite alteration of tourmalinite and fracture-filling (Korostelev et al., Reference Korostelev, Gonevchuk, Semenyak, Suchkov, Kokorin, Gonevchuk, Gorelikova, Kokorina and Khanchuk2001).
Mineralisation at the Solnechnoe deposit was formed during early molybdenum and later tin stages. The Rb/Sr age of tin mineralisation (84 ± 1 Ma; Chugaev et al., Reference Chugaev, Bortnikov, Gonevchuk, Gorelikova, Korostelev and Baranova2012) is consistent with the age of the third-phase intrusive rocks of the Silinka Complex. Molybdenum mineralisation is subordinate and fills numerous NW-trending fractures, predominantly in the footwall of the Main Zone. The molybdenum-stage veins and veinlets are composed of quartz as the major constituent, together with orthoclase, andesine, albite, fluorite, allanite, rutile, tourmaline, molybdenite, scheelite, arsenopyrite, and Bi and Te minerals. The tin stage is displayed as thick quartz–tourmaline veins with coarse-crystalline cassiterite, scheelite, wolframite, abundant arsenopyrite, pyrrhotite, chalcopyrite, sphalerite, galena, and later siderite and calcite (Korostelev et al., Reference Korostelev, Gonevchuk, Semenyak, Suchkov, Kokorin, Gonevchuk, Gorelikova, Kokorina and Khanchuk2001).
Analytical techniques
All samples for mineralogical and spectroscopic studies were collected from various levels of the open pit. A list of the tourmalines studied from the unmineralised, molybdenum and tin stages is given in Table 1.
Samples and formation stages of tourmaline at Solnechnoe deposit.

Electron microprobe
The electron microprobe study of tourmaline-supergroup minerals was carried out using a Jeol JSM-6480LV electron microscope equipped with an Inca Energy-350 energy dispersion system (EDS) and Inca Wave-500 wavelength dispersion system (WDS) at the Laboratory of Analytical Techniques of High Spatial Resolution, Department of Petrology, Moscow State University and a CAMEBAX SX-50 electron microprobe at the Department of Mineralogy, Moscow State University. The JEOL electron microscope was operated at an accelerating voltage of 15 kV and a beam current of 20 nA. The EDS detector was used for all elements except F, employing natural silicate reference minerals (Jarozewich, Reference Jarozewich2002) for calibration. Uncertainty of single measurements of the major elements, fluorine, and minor elements does not exceed 1.5, 5, and 10% relative, respectively. Fluorine concentrations were measured with WDS (TAP crystal), using MgF2 as a reference standard; detection limit is 0.10 wt.%. Correction for matrix effects was done using the XPP algorithm (INCA program version 17a, Oxford Instruments, UK). The CAMEBAX SX-50 electron microprobe was operated at 15 kV and 30 nA with a beam diameter of ~3 μm. Matrix corrections were performed using PAP (Pouchou and Pichoir, Reference Pouchou, Pichoir and Armstrong1985) correction procedures. The systematic measurement error of major components does not exceed 2% relative. The following standards were used: hornblende (Si, Al, Ca, Mg and Fe); orthoclase (K); albite (Na); MgF2 (F); pyrophanite (Mn and Ti); vanadinite (V); Cr2O3 (Cr); and SnO2 (Sn).
Tourmaline formulae were calculated on the basis of 15 cations at the tetrahedral and octahedral sites (T, Z and Y) exclusive of Na, Ca and K, which is appropriate for low-Li tourmaline as expected in rocks of the type studied here (Henry et al., Reference Henry, Novák, Hawthorne, Ertl, Dutrow, Uher and Pezzotta2011). Charge-balance constraints were used to estimate the amounts of OH– and O2– in the V and W anion sites. We recognise that there are significant uncertainties with these estimates (Dutrow and Henry, Reference Dutrow and Henry2000). The calculated O2– is assigned preferentially to the W site together with F (Henry et al., Reference Henry, Novák, Hawthorne, Ertl, Dutrow, Uher and Pezzotta2011). The proportion of X-site vacancies (□) was calculated as [1 – (Na + Ca + K)]. The concentration of B2O3 was calculated from stoichiometric constraints assuming 3 apfu B. Fe is reported as both Fe2+ and Fe3+ when Mössbauer spectra were recorded. In the other parts, Fe is reported as Fe2+ because there was not enough material to acquire Mössbauer spectra. In some cases, we calculated the minimum Fe3+/Fetot ratio based on charge-balance constraints and V and W(O) = 0.
Infrared spectroscopy
Fourier-transform infrared spectra of tourmaline were recorded with an FSM 1201 Fourier spectrometer, at the Department of Mineralogy, Lomonosov Moscow State University. The nominal range of use is 400–4000 cm–1; spectral resolution is 1.0 cm–1; absolute calibration error of wavenumber scale in not more than ± 0.1 cm–1. Samples were powdered in petrolatum oil down to the grain size of 3 μm. This oil was used to prevent adsorption of water molecules from the air on fresh faces of the mineral grains during grinding of samples and to exclude deformation of the absorption spectrum in the region of the OH-group stretching vibrations.
Mössbauer spectroscopy
Mössbauer studies were carried out at the National University of Science and Technology MISiS, Moscow (V.V. Korovushkin, analyst). A 57Fe spectrum was recorded using an MS-1104 Em Mössbauer spectrometer operating in constant acceleration mode with a 57Co (in Rh) source kept at room temperature, and calibrated using a standard sample of sodium nitroprusside. Isomer shift refers to α-Fe absorber at 293 K. The measurement results were processed by the least-square procedure using the Univem MS program (Rostov-on-Don State University, Rostov-on-Don, Russia) for fitting a thin absorber (Lorentzian line shape).
Results
The results of optical and electron microscopy studies on tourmaline from each of the three stages (unmineralised, molybdenum and tin, Table 1) are described below; several tourmaline generations have been identified within each stage.
Unmineralised stage (tourmalinite)
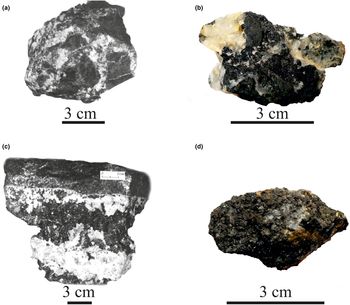
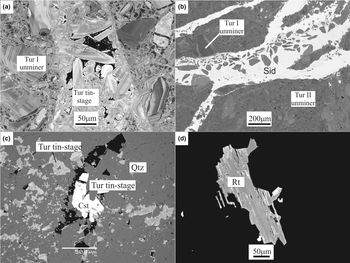
This sample (KP-2804) is attributed to the early brecciated tourmalinite (Fig. 2a,b). Tourmaline occurs as fractured complexly zoned crystals (tourmaline I) (Fig. 3a) reaching a few hundred micrometres in size and with groundmass consisting of fine (up to 10 μm) tourmaline grains (tourmaline II) (Fig. 3b). Tourmaline II is considered to be later. Both large crystals and groundmass are cut by veinlets ranging from a few tens to a few hundred micrometres in thickness and composed of quartz and complexly zoned, not fractured, crystals of the tin-stage tourmaline (Fig. 3a). Late branched veinlets of siderite ranging from a few ten to a few hundred micrometres in thickness cut tourmalines of fractured crystals, veinlets and matrix (Fig. 3b). The Fetot/(Fetot+Mg) ratio and proportion of the X-site vacancy range from 0.27 to 0.80 and from 0.08 to 0.48 atoms per formula unit (apfu), respectively (Table 2). Fluorine was not detected. The Fetot/(Fetot+Mg) ratio and proportion of the X-site vacancy in the groundmass tourmaline (tourmaline II) varies from 0.36 to 0.63 and from 0.06 to 0.17 apfu, respectively. Some grains of groundmass tourmaline contain F, up to 0.48 apfu.
Photographs of tourmaline samples from the Solnechnoe deposit: (a,b) fragments of unmineralised tourmalinite cemented by quartz; (c) molybdenum-stage tourmaline–quartz veinlet; (d) aggregate of tin-stage tourmaline crystals. (a,c) Black and white images; (b,d) in colour.

Back-scattered electron images showing unmineralised- and tin-stage tourmalines and associated minerals: (a) unmineralised-stage tourmaline is cut by a veinlet of the tin-stage tourmaline I; (b) unmineralised-stage tourmaline is cut by veinlets of late siderite, which contains fragments of unmineralised-stage tourmaline; (c) tin-stage tourmaline filling interstices between quartz grains and forming inclusions in cassiterite crystals; (d) W–Nb–Sn–bearing rutile associated with tin-stage tourmaline. Abbreviations: (Cst) cassiterite, (Qz) quartz, (Rt) rutile, (Sd) siderite, (Tur I unminer and Tur II unminer) first and second generation of unmineralised-stage tourmaline, (Tur tin-stage) tin-stage tourmaline.

Representative compositions for unmineralised- and molybdenum-stage tourmalines of Solnechnoe deposit.*

* Notes: (KP-2804) Unmineralised-stage tourmaline; (Mo-6, KP-3427, KP-3425) molybdenum-stage tourmaline. In composition KP-2804, Fe2+ is total Fe because of lack of material for Mössbauer study and no positive charge deficiency as result of calculations. In compositions Мо-6 and KP-3427, Fe2+ and Fe3+ are calculated and distributed from Mössbauer data; in composition KP-3425 the Fe3+/Fetot is assumed to be the same as that in composition KP-3427 because samples were collected from the same zone. Here and in Table 2, b.d.l denotes that the element content is below detection limit; n.a. denotes that the element was not analysed.
Separation of large crystals and groundmass was impossible. Therefore, we did not carry out the Mössbauer study.
On the triangle plot X-vacancy–Ca–Na(+K), the compositions of large crystal and groundmass tourmalines fall into the alkali field (Fig. 4a). The Ca content in the both tourmalines is close or 0.2 apfu in most compositions. Therefore we suggest that a binary diagram Fetot/(Fetot + Mg) versus X-vacancy/(X-vacancy + Na) (Fig. 4c) is the best to classify both tourmalines. In this diagram, most compositions fall into the dravite and oxy-dravite field and one composition of the groundmass tourmaline is in the schorl and oxy-schorl field. According to calculation, the W site in all compositions is dominated by OH–. Taking into account X-vacancy–Ca–Na(+K) ternary and X-vacancy/(X-vacancy + Na) binary plots, as well as calculations, the tourmalines studied are classified according to Henry et al. (Reference Henry, Novák, Hawthorne, Ertl, Dutrow, Uher and Pezzotta2011) as dravite or schorl, which could be enriched in Ca, X-site vacancy, and F. However, determination of Fe3+ may change this classification.
Triangle and binary plots illustrating compositions of tourmalines from the Solnechnoe deposit: (a,b) triangle plot X-vacancy–Ca–Na(+K); (c) binary plot X-vacancy/(X-vacancy + Na) vs. Fetot/(Fetot + Mg)

On a triangle plot in terms of Fe50Al50–Altot–Mg50Al50 (Fig. 5a), the compositions of the tourmalines are above or slightly below (tourmaline II) the schorl–dravite join that implies the low Fe3+ content.
Triangle plots Fe–Al–Mg and binary plots Fetot vs. Mg illustrating tourmaline compositions of the Solnechnoe and other hydrothermal intrusion-related tin deposits. Some exchange vectors are shown in (b) for reference: (a,b) unmineralised and molybdenum-stage tourmalines from Solnechnoe; (c,d) tin-stage tourmaline from Solnechnoe; (e,f) tourmalines from other hydrothermal intrusion-related tin deposits.

On an Fe versus Mg plot (Fig. 5b), the compositions of tourmaline I are close to parallel to the three exchange vectors FeAl–1, AlO(Fe(OH))–1, and □Al(NaFe)–1. To determine which of these vectors dominates, an Al versus X-vacancy plot has been constructed (Fig. 6a). Most compositions of tourmalines are nearly parallel to the □Al(NaR 2+)–1 exchange vector. Correlation coefficients between Fe and Al, (Al + O) and (Fe + OH), and (□ + Al) and (Na + Fe) are –0.89, –0.57 and –0.96, respectively. Those between Mg and Al, (Al + O) and (Mg + OH), and (□ + Al) and (Na + Mg) are 0.26, –0.56 and 0, respectively. Correlation coefficients make it possible to consider R 2+ only as Fe2+. Taking into account the position of tourmaline compositions on the Al versus X vacancy and correlation coefficients, we conclude that the □Al(NaFe)–1 exchange vector corresponding to X-vacancy + Al ↔ Na + Fe substitution is predominant.
X-site vacancy vs. Al plot showing compositions of: (a) unmineralised- and molybdenum-stage tourmalines; and (b) tin-stage tourmaline. Some exchange vectors are given for references. The solid and dash lines represent a linear least-squares regressions through the tourmaline I and II data, X-site vacancy = 0.26Al – 1.37 and X-site vacancy = 0.07Al – 0.29. See Fig. 5 for legend.

The compositions of the groundmass tourmaline II are parallel to the MgFe–1 exchange vector (Fig. 5b), which corresponds to the Fe ↔ Mg substitution.
The correlation coefficient between Ca and Na in the tourmaline I compositions is positive (0.84) implying an absence of the Ca–Na exchange. However, the correlation coefficient between Ca and the X-site vacancy is –0.93, implying one or a combination of the following mechanisms of the Ca incorporation into the tourmaline structure in accordance with Henry and Dutrow (Reference Henry and Dutrow1990): XCa + 2R 2+ ↔ X□ + 2Al, XCa + R 2+ + O ↔ X□ + 2Al + OH and XCa + 3R 2+ + OH ↔ X□ + 3Al + O.
The correlation coefficient between Ca and Na and Ca and the X-site vacancy in tourmaline II is –0.81 and –0.69, respectively. This suggests Ca–Na and the Ca–X-site vacancy exchanges with predominant Ca–Na exchange. According to Henry and Dutrow (Reference Henry and Dutrow1990), this exchange implies Ca + R 2+ ↔ Na + Al, Ca + O ↔ Na + OH and Ca + 2R 2+ + OH ↔ Na + 2Al + O.
Thus, the unmineralised-stage tourmalines are classified as dravite and only one composition is schorl. Tourmaline I is distinguished by the X-site vacancy + Al ↔ Na + Fe substitution and Ca–X-site vacancy exchange. Tourmaline II is characterised by the Fe ↔ Mg substitutions and Ca–Na exchange.
Molybdenum stage
The molybdenum-stage tourmaline occurs as relatively large fractured crystals up to a few hundred micrometres long (Fig. 2c). It is associated with F- and Cl-bearing biotite of the following composition (wt.%): 36.61 SiO2, 2.02 TiO2, 0.07 V2O3 14.29 Al2O3, 22.27 FeOtot, 0.28 MnO, 11.08 MnO, 8.97 K2O, 0.03 CaO, 1.51 F, 0.51 Cl, 3.04 H2Ocalc, –0.64 O = 2F, –0.23 O = 2Cl, total 99.82. Fractures in tourmaline crystals are healed by prehnite. Pyrite and arsenopyrite are later stage minerals. Microscopically tourmaline crystals are zoned with a blue–green core, brown intermediate zones and blue–green rim. Tourmaline is pleochroic from light grey to blue–green or brown. Tourmalines in samples Mo-6, KP-3425 and KP-3427 have similar Fetot/(Fetot+Mg) values of 0.47–0.53, 0.54–0.58 and 0.44–0.64, respectively. The proportion of the X-site vacancy is 0.21–0.28, 0.08–0.22, and 0–0.32 apfu, respectively. (Table 2). All tourmalines contain F, up to 0.86 apfu. As shown in Fig. 8 about half of the tourmaline compositions are F dominant on the W site.
We have traced compositional variations from core to rim in one zoned crystal (Fig. 7). Complementary behaviour is observed for Ca and Mg, the X-site vacancy and Al, and Na and Al. Such a behaviour implies two coupled substitutions: Ca + 2Mg ↔ X-vacancy + 2Al and Na + Al ↔ X-vacancy + Al. Ferric iron and Al show the opposite behaviour indicating Fe3+ ↔ Al substitution.
Variations in major component concentrations along a profile in a molybdenum-stage tourmaline crystal (sample KP-3427). Abbreviations: (Bt) biotite, (Cal) calcite, (Chl) chlorite and (Qz) quartz.

On a triangle plot X-vacancy–Ca–Na(+K), most tourmaline compositions fall into the alkali field (Fig. 4a). Three compositions are in the calcic field. On a triangle plot F––O2––OH– for the W site (Fig. 8), tourmaline compositions fall into the OH and F species fields; only one composition is plotted in the O species field. From calculations, the Y site in the tourmalines studied is dominated by Fe2+ or Mg. Considering triangle plots and calculation results, most molybdenum-stage tourmalines are schorl–dravite and fluor-schorl–fluor-dravite enriched in Ca (0.13–0.48 apfu). Three compositions belong to the calcic group and from calculations of the results are classified as fluor-uvite. On a triangle plot Fe50Al50–Altot–Mg50Al50 (Fig. 5a), the compositions of the tourmalines are above and slightly below the schorl–dravite join. The arrangement below this join may imply an enrichment in Fe3+, but the Fe3+/Fetot ratio determined from Mössbauer spectroscopy (see below) is 3–9% (Table 5). Therefore such an arrangement is caused by a slight depletion in Al.
Plots illustrating tourmaline compositions: (a) triangle plot F–O–OH at site W for the molybdenum-stage tourmaline; (b) binary Na vs. Altot for the tin-stage tourmaline. Some exchange vectors are shown for reference.

On the Fe versus Mg plot (Fig. 5b), most compositions of the molybdenum-stage tourmalines are nearly parallel to the CaMg(NaAl)–1, □Al(NaMg)–1, and AlO(Mg(OH))–1 exchange vectors. If either of the two last vectors are predominant then the correlation coefficient between Na and Mg, or Mg and OH– should be positive. However, it is negative, –0.77 and –0.63, respectively. At the same time, correlation coefficients between Ca and Mg, and Na and Al are 0.95 and 0.69, respectively. The correlation coefficient between Ca + Mg and Na + Al is –0.92. Therefore we may conclude that the CaMg(NaAl)–1 vector corresponding to the Ca + Mg ↔ Na + Al substitution predominates. This is consistent with substitution identified in an individual crystal. The compositions are fitted by the line Fe = 0.1821Mg + 1.062. The slope of the regression line is low and positive, but is different from zero. Therefore, it is possibly influenced by the FeAl–1, □Al(NaFe)–1, and AlO(Fe(OH))–1 exchange vectors. The correlation coefficient between Fe and OH is –0.11, therefore the effect of the last vector should be omitted. The correlation coefficient between the X-site vacancy + Al and Na + Fe is 0.13, therefore the influence of the second vector should be ruled out. Only Fe and Al show weak negative correlation (correlation coefficient –0.58). Hence, the FeAl–1 exchange vector corresponding to Fe3+ ↔ Al substitution is concluded to influence the slope of the regression line.
The correlation coefficient between the X-site vacancy and Al 0.88 implies some exchange vectors involving these constituents. Two of them □Al(NaMg)–1 and □Al(NaFe)–1 were rejected above. In Fig. 6a, compositions of the molybdenum-stage tourmalines are nearly parallel to the vector □Al2O(NaR 2+2OH)–1. The correlation coefficient between the X-site vacancy + 2Al + O and Na + 2R 2+ + O is 0.04 and 0.75 in the case of R 2+ as Fe and Mg, respectively. Therefore, only the □Al2O(NaMg2OH)–1 exchange vector may be considered. Taking into account high Ca concentration in the molybdenum-stage tourmalines, the exchange vectors involving this element, X-site vacancy, and Al should be assumed. These vectors are CaR 2+2□–1Al–2, CaR 2+O□–1Al–1OH–1 and CaR 2+3OH□–1Al–3O–1 as suggested by Henry and Dutrow (Reference Henry and Dutrow1990). In the case of CaMg2□–1Al–2, CaMgO□–1Al–1OH–1 and CaMg3OH□–1Al–3O–1, correlation coefficients between constituents in the right and left part of the vectors are –0.89, –0.88 and –0.89, respectively. In the case of CaFe2□–1Al–2, CaFeO□–1Al–1OH–1, and CaFe3OH□–1Al–3O–1, those are –0.81, –0.78, and –0.62, respectively. These data indicate that vectors involving Mg are preferable. Therefore, we may conclude that correlation between the X-site vacancy and Al is predominantly provided by one of three exchange vectors CaR 2+2□–1Al–2, CaR 2+O□–1Al–1OH–1 and CaR 2+3OH□–1Al–3O–1. It is also possible to have a combination of vectors in operation.
Thus, the molybdenum-stage tourmaline is classified as schorl–dravite and fluor-schorl–fluor-dravite enriched in Ca, and fluor-uvite. The primary isomorphic substitution in the cation part is Ca + Mg ↔ Na + Al. The molybdenum-stage tourmalines are different from unmineralised tourmalines in both classification and major isomorphic substitutions.
Tin stage
The tin-stage tourmaline occurs as relatively large (more than 200 μm) complexly zoned isolated crystals, aggregates of these crystals, radial or sheaf-like aggregates, and veinlets cutting early tourmalinite (Figs 2d, 3a). Tourmaline predates cassiterite (Fig. 3c) and is associated with W- (~5 wt.% WO3), Sn- (~4 wt.% SnO2), and Nb-bearing (~1 wt.% Nb2O5) rutile (Fig. 3d). Representative electron microprobe data from the tin-stage tourmaline are given in Table 3.
Representative compositions for tin-stage tourmaline of Solnechnoe deposit.*

* Notes: Samples SK-760-12, KP-2804 veinlet, SC12-530, SC-34-691, SC-32-691 and SC-24-700 were analysed using a Jeol JSM-6480 electron microscope. Samples КС-V-III, SC-6-530, SC-20 and SC-659 were analysed using a Cameca SX-50 electron microprobe. In samples SC-12-530, SC-34-691, CW-32-691m and SC-24-70, Fe2+ and Fe3+ are calculated and distributed at structure sites according to the Mössbauer data. Magnesium is partly ascribed to site Z according the Fe distribution and Bloodaxe et al. (Reference Bloodaxe, Hughes, Dyar, Grew and Guidotti1999). In other samples, Fe2+ and Fe3+ are calculated from charge balance constraints.
A profile along a complexly zoned crystal 800 μm long (Fig. 9) shows the complementary behaviour of Altot and WO2–, Fe2+ and WOH–, Ca and Mg or Fe2+, and the X-site vacancy and Al. The Fe2+ and Mg contents demonstrate the opposite trend. This fact testifies to the following chemical substitutions Al + WO2– ↔ Fe2+ + WOH–, Ca + 2R 2+ ↔ X-site vacancy + 2Al (R 2+ = Mg, Fe2+), and Fe2+ ↔ Mg.
Variations in major component concentrations along a tin-stage tourmaline crystal (sample SC-12-530).

Another large crystal across which the major-element distribution has been studied is sector and growth zoned. It is cut by a tourmaline stringer ~100 μm thick and one of its faces has been dissolved and overgrown by tourmaline of the second generation (Fig. 10). The contents of R 2+ and WOH–, R3+ and WO2–, Ca and Mg, and Na and R3+ (R 2+ = Mg, Fe2+, R3+ = Al, Fe3+) show complementary behaviour that testifies to the following substitutions R 2+ + WOH– ↔ R 3+ + WO2– and Ca + Mg ↔ Na + R 3+. At the same time, Fe2+ and Mg display opposite behaviour indicating Fe2+ ↔ Mg chemical substitution.
Variations in major component concentrations across complexly zoned tin-stage tourmaline I crystal (sample SC-659). The back-scattered electron image shows that the left side of tourmaline I crystal is replaced by tourmaline II. The central part of tourmaline I crystal is cut by a veinlet composed of a complexly zoned crystal of tourmaline II. (I) Tourmaline I, (II) tourmaline II.

The element contents in tourmaline from cutting stringers show complementary behaviour of Ca and R 2+, Na and R 3+, R 3+ and WO2–, and R 2+ and WOH–. Ferric iron and Al, and Fe2+ and Mg display opposite behaviour. These observations indicate the following substitutions Ca + R 2+ ↔ Na + R 3+, R 3+ + WO2– ↔ R 2+ + WOH– and Fe3+ → Al
The detailed electron microprobe study has revealed that some tourmaline crystals are enriched in Sn, up to 0.07 apfu or 1.02 wt.% SnO2 (detection limit of SnO2 by electron microprobe is 0.1 wt.%). Several plots were constructed to provide insights into the mechanism of Sn incorporation in this generation of tourmaline (Fig. 11). Sodium, Fe and Sn on the one hand and Ca, Mg and Al on the other hand demonstrate complementary behaviour that testifies to the probable substitution Na + Fe2+ + Sn4+ ↔ Ca + Mg + Al. Relatively uniform distribution of Sn in the crystal studied suggests that tin incorporates into the tourmaline structure rather than represents cassiterite inclusions.
Variations in major component and tin concentrations along a complexly zoned tin-stage tourmaline I crystal (sample SK-760-12).

On the triangle plot in terms of X-vacancy–Ca–Na(+K), most tourmaline I compositions and all tourmaline II compositions fall into the alkali field (Fig. 5b). Two tourmaline I compositions are in the X-site vacancy field. One composition is plotted in the calcic tourmaline field. According to electron microprobe measurements, the tourmalines contain F (up to 0.69 apfu). This allows classification of some compositions as the fluorine species. However, the F content in most compositions is much lower and the W site is dominated by OH–. The triangle plot F––O2––OH– for the W site was not constructed because an absence of Mössbauer data for some samples prevents corrected calculation of the Fe3+ content and hence that of the O2– proportion at site W. At the same time, in tourmalines with the determined Fe3+/Fetot ratio, the fluorine content is below detection limit or has been not measured. Judging from calculations, the Y site in the tourmalines studied is dominated by Fe2+ or Mg, and OH– dominates at the W site.
Considering the triangle plot (Fig. 4b) and calculation results, most compositions are classified as schorl–dravite; a few compositions correspond to fluor-schorl, oxy-dravite, magnesio-foitite, foitite and feruvite.
On an Fe50Al50–Altot–Mg50Al50 triangle plot (Fig. 5c), the compositions of the tourmalines are above and below the schorl–dravite join that testifies to the compositions enriched and depleted in Fe3+ and/or Al.
An Al versus Na diagram shows that the tourmaline compositions have a bell-like distribution (Fig. 8b). Such a distribution is testimony that some tourmaline I compositions are characterised predominantly by substitutions involving Ca, whereas others are dominated by X-vacancy substitutions. Only substitutions involving Ca are characteristic of tourmaline II. This is consistent with substitutions found from the examined individual crystals of tourmaline I and the cutting veinlet of tourmaline II.
On an Fe versus Mg plot (Fig. 5d), the compositions of the tin-stage tourmalines are roughly parallel to the MgFe–1 exchange vector indicating Fe2+ ↔ Mg substitution; the correlation coefficient between Mg and Fetot is –0.71. However, the compositions are scattered around the schorl–dravite line testifying to the influence of other vectors shown in Fig. 5b. The negative correlation between Ca + Mg and Na + Al (correlation coefficients –0.48 and –0.47 for tourmalines I and II, respectively) indicates a weak influence of the CaMgNa–1Al–1 exchange vector. Correlation coefficients between Al + WO2– and Fe2+ + WOH– and between the Al + X-site vacancy and Na + Fe2+ calculated only for the tourmaline I compositions with the determined Fe3+/Fetot ratio are –0.73 and –0.65, respectively. This implies the slightly predominant influence of the AlOFe–1OH–1 vector and therefore predominant substitution is Al + WO2– ↔ Fe2+ + WOH–. Correlation coefficient between Al and Fe3+ –0.73 indicates that influence of the FeAl–1 vector is the same that of the AlOFe–1OH–1 vector.
The correlation coefficient between the X-site vacancy and Al for all tourmaline I compositions is 0.88. In Fig. 6b, the tourmaline I compositions are between two vectors □Al2ONa–1R 2+2(OH)–1 and AlOR 2+–1(OH)–1. The correlation coefficient between the X-site vacancy + 2Al + O2– and Na + 2R 2+ + OH– calculated only for the compositions with the determined Fe3+/Fetot is –0.68 and –0.02 in the case of R 2+ as Fe2+ and Mg, respectively. These values between Al + O2– and R 2+ + OH– are –0.71 and –0.02 in the case of R 2+ as Fe2+ and Mg, respectively. Therefore, only □Al2ONa–1Fe–2(OH)–1 and AlOFe–1(OH)–1 may be considered. The data are spread in a linear array with slope 0.26, which is between slopes 0.5 and 0 for vectors □Al2ONa–1Fe–2(OH)–1 and AlOFe–1(OH)–1, respectively. Taking into account this observation, we conclude that the scattering of the tourmaline I compositions around the schorl–dravite line is caused by three vectors □Al2ONa–1Fe–2(OH)–1, AlOFe–1OH–1, and AlFe–1, although the operation of □AlNa–1Fe–1 cannot be ruled out.
Thus, the tourmaline I compositions are characterised by the following exchange vectors MgFe–1, □Al2ONa–1Fe–2(OH)–1, AlOFe–1(OH)–1, AlFe–1, CaR 2+Na–1R 3+–1 and NaR 3+2OCa–1R 2+–2(OH)–1, which correspond to substitutions Fe2+ ↔ Mg, X-site vacancy + 2Al + WO2– ↔ Na + 2Fe2+ + WOH– and Al + WO2– ↔ Fe2+ + WOH–, Al ↔ Fe3+. The primary substitution is Fe2+ ↔ Mg. Calcium incorporates into the tourmaline structure by the schemes Ca + R 2+ ↔ Na + R 3+ and Na + 2R 3+ + WO2– ↔ Ca + 2R 2+ + WOH–.
The tourmaline II compositions in Fig. 6b are spread in a linear array with the slope 0.07 which is very close to that of the AlOR 2+–1OH–1 vector (0) implying its influence. Taking into account this and aforementioned observations, we may state that the tourmaline II compositions are characterised by the primary exchange vectors FeMg–1 and NaR 3+2OCa–1R 2+–2(OH)–1 with subordinant AlOR 2+–1(OH)–1 and CaR 2+Na–1R 3+–1 vectors. The primary vectors correspond to the Fe ↔ Mg and Na + 2R 3+ + WO2– ↔ Ca + 2R 2+ + WOH– substitutions.
Thus, most tin-stage tourmalines are schorl–dravite; a few compositions correspond to the fluor-schorl, oxy-dravite, magnesio-foitite, foitite and feruvite. The tourmalines are characterised by the Fe2+ ↔ Mg primary substitution type. Calcium incorporates into the tourmaline structure by the schemes Ca + R 2+ ↔ Na + R 3+ and Na + 2R 3+ + WO2– ↔ Ca + 2R 2+ + WOH.
Infrared spectroscopy
The IR spectra over the range of 3200 to 3900 cm–1 corresponding to the OH-group stretching vibrations are shown in Fig. 12. The absorption bands given in Table 4 were assigned according to Veličkov (Reference Veličkov2002) and the chemical compositions.
Infrared spectra of tourmalines from the Solnechnoe deposit.

Parameters (cm–1) for infrared spectra of tourmalines from the Solnechnoe deposit.

The spectra of the samples studied are divided into three groups.
The first group includes one sample of the molybdenum stage (KP-3427), in the spectrum of which the highest-frequency absorption band of the inner OH group coordinated by the octahedral cations at sites YYY and Na+ at X is absent (Fig. 12a). At the same time, there is a second OH-group absorption band at 3632 cm–1 for the W site and coordinated by a vacancy at X. These data are consistent with the average composition of this tourmaline, where the proportion of the OH group (0.35 apfu) at site W is less than the sum of F– and O2– anions (0.65 apfu) and part of site X is vacant. F– and O2– ions replace OH– predominantly at site W, which is coordinated by Na+. At the W site coordinated by the X-site vacancy, the OH group occurs, as is supported by the corresponding absorption band in the spectrum.
The second group consists of tin-stage samples SC-6-530, SC-24-700, and SC-32-691, in the spectra of which the highest frequency weak absorption band at 3721 cm–1 corresponds to the OH-stretching vibrations (Fig. 12b,c,d). According to conventional classification, this OH group is considered to be inner, occupies W, and is coordinated by three cations occupying octahedral sites YYY and a cation at site X. Judging from the compositions of these samples, two of three Y sites are completely occupied by Mg2+ and Fe2+ cations; the third Y site is occupied by statistically distributed Al3+, Fe3+, Ti4+ and excess Fe2+ and Mg2+; in this case X is occupied by Na+.
The tin-stage samples SC-12-530 and SC-34-691 belong to the third group. Their IR spectra contain bands at 3716 and 3717, respectively (Fig. 12e,f). The formulae calculated from average compositions show that only one of three Y sites in the tourmaline structure is completely occupied by the Fe2+ cations and two sites are occupied by statistically distributed Mg2+, Al3+, Fe3+ and excess Fe2+; in sample SC-34-691 Ti4+ occupied the same sites.
In the second and third groups, the value of the second band corresponding to the absorption of the inner OH group ranges from 3628 to 3624 cm–1. There is no evident relation between these frequencies and distribution of cations at sites YYY, whereas the X-site vacancy is a primary factor.
All six spectra show a broad band with a maximum over the range of 3565 to 3557 cm–1, which is attributed to the absorption of three outer OH groups occupying sites VVV in the tourmaline structure. The range of maximum frequency is caused by diverse cations occupying sites YZZ and both SiO and AlO tetrahedra at site T. At the same time, in accordance with modern conception of YZZ–YZZ–YZZ triplets (Watenphul et al., Reference Watenphul, Burgdorf, Schlüter, Horn, Malcherek and Mihailova2016), these wavenumbers correspond to the VOH vibrations assigned to 3YFeZAlZAl.
Mössbauer spectroscopy
Two and four Mössbauer spectra of the molybdenum-stage and tin-stage tourmalines, respectively were obtained. In addition, spectra of tourmalines from the Valkumei, Chukchi Peninsula and Deputatsky, Yakutia tin deposits were measured (Fig. 13, Table 5). Doublets are attributed in accordance with Dyar et al. (Reference Dyar, Taylor, Lutz, Francis, Guidotti and Wise1998).
Mössbauer spectra of tourmalines from Solnechnoe, Valkumei and Deputatsky intrusion-related tin deposits.

Parameters for Mössbauer spectra of tourmalines from granitoid-related hydrothermal tin deposits.*

* Notes: (Mo-6, KP-3427) Molybdenum-stage tourmaline and (SC-12-530, SC-34-691, SC-32-691, SC-24-700) tin-stage tourmalines from the Solnechnoe deposit, Khabarovsk Ktai; (Valkum) Valkumei deposit, Chukchi Peninsula; (Deputat) Deputatsky deposit, Yakutia. Doublets were attributed according to Dyar et al. (Reference Dyar, Taylor, Lutz, Francis, Guidotti and Wise1998); IS = isomer shift (mm/s), QS = quadrupole splitting (mm/s), S = area (%).
In all tourmalines from Solnechnoe and tourmaline from Valkumei, Fe2+ occupy three sites Y and charge transition Fe2+ ↔ Fe3+ is observed. In tourmaline from the Deputatsky deposit, only two Y sites are occupied by Fe2+ and charge transition is absent. Ferric iron occupies one octahedral site in the molybdenum-stage, all but one of the tin-stage, and Valkumei tourmalines. In one tin-stage sample (SC-32-691) and Deputatsky tourmaline Fe3+ occupies two octahedral sites.
According to Dyar et al. (Reference Dyar, Taylor, Lutz, Francis, Guidotti and Wise1998), Andreozzi et al. (Reference Andreozzi, Bosi and Longo2008) and Bosi (Reference Bosi2008), attribution of Fe3+ in the tourmaline structure based only on the Mössbauer data is ambiguous. According to Bloodaxe et al. (Reference Bloodaxe, Hughes, Dyar, Grew and Guidotti1999) in tourmalines of the schorl–dravite solid-solution series to which the Solnechnoe tourmalines belong, Z along with Al is occupied by Mg, rather than Fe2+ or Fe3+. Watenphul et al. (Reference Watenphul, Burgdorf, Schlüter, Horn, Malcherek and Mihailova2016), Bosi et al. (Reference Bosi, Andreozzi, Hålenius and Skogby2015) and Bosi (Reference Bosi2018) reported that site Z can be occupied by Mg, Fe2+ and Fe3+. It should be noted that we have no specific structural information on Y and Z occupancy, therefore Fe3+, Fe2+ and Mg in the Solnechnoe tourmalines were assigned as recommended by Henry et al. (Reference Henry, Novák, Hawthorne, Ertl, Dutrow, Uher and Pezzotta2013).
The Fe3+/Fetot value increases from the molybdenum- to tin-stage tourmalines, from 3–9 to 12–16% (Table 5). A similar value was obtained for the Valkumei and Deputatsky tourmalines of 14%.
Discussion
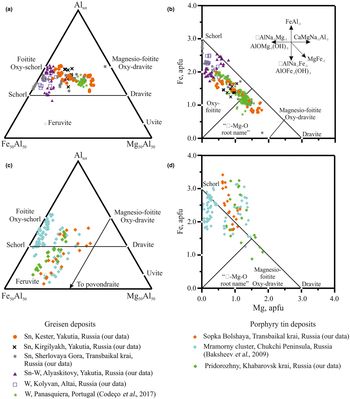
Tourmaline-supergroup minerals are typical of greisen, intrusion-related and porphyry tin deposits (Kuzmin et al., Reference Kuzmin, Dobrovolskaya and Solntseva1979; Gorelikova, Reference Gorelikova1988; Wright and Kwak, Reference Wright and Kwak1989; Mlynarczyk and Williams-Jones, Reference Mlynarczyk and Williams-Jones2006; Baksheev et al., Reference Baksheev, Tikhomirov, Yapaskurt, Vigasina, Prokofiev and Ustinov2009; Jia et al., Reference Jia, Fang and Hu2010; El Mahjoubi et al., Reference El Mahjoubi, Chauvet, Badra, Sizaret, Barbanson, El Maz, Chen and Amann2016; Codeço et al., Reference Codeço, Weis, Trumbull, Pinto, Lecumberri-Sanchez and Wilke2017). Tourmaline is characterised by a wide variety of chemical substitutions; therefore, different substitutions could be expected in tourmalines of different genesis. Most compositions of greisen tourmaline are above the schorl–dravite join on the diagram in terms of Fetot–Altot–Mg (Fig. 14a) and nearly parallel to the MgFe–1 exchange vector corresponding to the Fe2+ → Mg substitution on the Fetot versus Mg diagram (Fig. 14b). The position of composition above the schorl–dravite join indirectly indicates the tourmalines are depleted in Fe3+.
Triangle and binary plots illustrating tourmaline compositions from greisen and porphyry tin deposits: (a,c) triangle plot in terms of Fe–Al–Mg; (b,d) binary plot Fe vs. Mg. Some exchange vectors are shown in (b) for reference.

The compositions of tourmaline from porphyry tin deposits are above and below the schorl–dravite join and are parallel to the oxy-dravite–povondraite join (Fig. 14c). The arrangement of compositions above and below the schorl–dravite join indirectly indicates that some compositions are enriched in Fe3+, whereas others are depleted in ferric iron. On the Fe vs. Mg plot (Fig. 14d) the tin-porphyry tourmaline compositions are parallel to the □AlNa–1Fe–1, MgFe–1, AlOFe–1(OH)–1, and FeAl–1 exchange vectors. According to Baskheev et al. (Reference Baksheev, Prokofiev, Zaraisky, Chitalin, Yapaskurt, Nikolaev, Tikhomirov, Nagornaya, Rogacheva, Gorelikova and Kononov2012), the AlOFe–1(OH)–1 and FeAl–1 exchange vectors are primary. They correspond to Al + O2– ↔ Fe2+ + OH– and Fe3+ ↔ Al chemical substitutions, respectively.
The position of compositions of tourmaline from intrusion-related tin deposits on the triangle plot in terms of Fe–Al–Mg and binary Fe vs. Mg (Fig. 5e,f) are consistent with that of the tin-stage tourmaline from the Solnechnoe deposit. This allows the suggestion that the primary substitution types in tourmaline from these deposits are identical to those reported for the Solnechnoe tin-stage tourmaline.
Thus, tourmalines from greisen, porphyry and intrusion-related tin deposits are different in primary types of chemical substitutions that can be used to determine the type of tin deposit.
Pirajno and Smithies (Reference Pirajno and Smithies1992) reported that in the case of granite-related Sn–W deposits in South Africa, Namibia and New Zealand, the FeO/(FeO + MgO) ratio for wt.% oxides of tourmaline ranges from 0.8 to 1 and from 0.8 to 0.6 for endogranitic–proximal and proximal–intermediate deposits respectively. This value in tourmaline from distal deposits is below 0.6. In the case of the tin-stage tourmaline from the Solnechnoe deposit, the FeO/(FeO + MgO) ratio ranges from 0.3 to 0.9. However, most values are between 0.8 and 0.9 (Figs 15, 16) that corresponds to the endogranitic–proximal position. This is consistent with Korostelev et al. (Reference Korostelev, Gonevchuk, Gorelikova, Ekimova, Kononov, Krylova, Orekhov, Semenyak and Suchkov2016), who reported that tin bodies extend from ~100 to 600 m above the intrusion. The position of the molybdenum-stage tourmaline compositions in the intermediate zone are due to the early tourmaline being enriched in Mg as compared to the tin-stage tourmaline (Mlynarczyk and Williams-Jones, Reference Mlynarczyk and Williams-Jones2006), rather than being a longer distance from the intrusion.
Histogram of FeOtot/(FeOtot + MgO) values for tin-stage tourmaline of the Solnechnoe deposit. FeO and Mg as wt.%.

A FeOtot/(FeOtot + MgO) vs. MgO plot for tourmalines from Solnechnoe tin deposit, modified after Pirajno and Smithies (Reference Pirajno and Smithies1992) and Yavuz et al. (Reference Yavuz, Fuchs, Karakaya and Karakaya2008). FeOtot and Mg as wt.%.

This study documents substantial variations in the Fe content of the tin-stage tourmaline from core to rim in individual grains and from the first to second generation. Individual grains show oscillatory zoning (Fig. 10) with variations in Fetot content from 1.5 to 3.0 apfu. Oscillatory zoning in tourmaline crystals such as that observed in individual grains of the Solnechnoe tin-stage tourmaline has been reported in tourmaline from various environments (Baksheev and Kudryavtseva, Reference Baksheev and Kudryavtseva2004; Lussier et al., Reference Lussier, Abdu, Hawthorne, Michaelis, Aguiar and Kroeker2011; Baksheev et al., Reference Baksheev, Prokofiev, Zaraisky, Chitalin, Yapaskurt, Nikolaev, Tikhomirov, Nagornaya, Rogacheva, Gorelikova and Kononov2012; Huang et al., Reference Huang, Song, Hou and Xue2016). Norton and Dutrow (Reference Norton and Dutrow2001), Choo (Reference Choo2003), Dutrow and Henry (Reference Dutrow and Henry2018) and Dutrow et al. (Reference Dutrow, Henry and Sun2019) having discussed oscillatory zoning in tourmaline crystals concluded that it is caused by a dynamic fluid regime. This conclusion may be applied to the individual Solnechnoe tourmaline grains with the highly variable Fe concentration. The suggestion of a dynamic fluid regime during tin-stage tourmaline crystallisation is supported by the fluid-inclusion data for quartz associated with tourmaline. Bortnikov et al. (Reference Bortnikov, Khanchuk, Krylova, Anikina, Gorelikova, Gonevchuk, Ignat'ev, Kokorin, Korostelev and Lomm2005) reported variations in homogenisation temperature of fluid inclusions and fluid salinity from individual quartz crystals, (outwards: 370–380°C and 6.7–9.3 wt.% NaCl equiv. → 319–290°C and 3.7–4.3 wt.% NaCl equiv. → 330°C and 7.2 wt.% NaCl equiv. → 267–273°C and 0.7–1.6 wt.% NaCl equiv. → 356–371°C and 5.7–6.0 wt.% NaCl equiv.
The substantial difference in the Fe content between molybdenum-stage tourmaline (1.30–1.76 apfu) and most compositions of the tin-stage tourmaline (2.00–3.00 apfu, 57 of 88 compositions) probably indicates a change in fluid regime at the transition from molybdenum to the tin stage. A similar change was recorded at the transition from the unmineralised stage to the tin stage at the San Rafael tin deposit, Peru (Mlynarczyk and Williams-Jones, Reference Mlynarczyk and Williams-Jones2006). Change in the tourmaline formation conditions at Solnechnoe is also supported by the Fe3+/Fetot value, which increased from 3–9% at the molybdenum stage to 12–16% at the tin stage. We have estimated Na and Ca concentrations in fluids responsible for the formation of the molybdenum- and tin-stage tourmaline from equations suggested by Dutrow and Henry (Reference Dutrow and Henry2016). These values for the molybdenum-stage fluid are 0.47 and 0.10–0.15 mol/l, respectively, whereas those for the tin-stage fluid are slightly more variable 0.43–0.48 and 0.05–0.17 mol/l, respectively. According to Bortnikov et al. (Reference Bortnikov, Khanchuk, Krylova, Anikina, Gorelikova, Gonevchuk, Ignat'ev, Kokorin, Korostelev and Lomm2005), the homogenisation temperature of fluid inclusions in the molybdenum-stage tourmaline is 450–460°C and fluid salinity is 22–23 wt.% NaCl equiv, whereas those in quartz associated with the tin-stage tourmaline are 290–380°C and 4–9 wt.% NaCl equiv. These observations prove that there was a different fluid regime during molybdenum and tin stages at the Solnechnoe deposit.
Tourmaline from the Solnechnoe deposit has a highly variable Sn content. In the unmineralised- and molybdenum-stage tourmalines it is below the electron microprobe detection limit, whereas in the tin-stage tourmaline it reaches 1 wt.% SnO2. Tin was detected in most tin-stage tourmaline crystals. The Sn content in the Solnechnoe tourmaline is among the highest reported in tourmaline. These values are (wt.% SnO2): 1.01 in the Verkhneurmiysky cluster, Russian Far East (Alekseev and Marin, Reference Alekseev and Marin2019); 0.82 at Sopka Bolshaya, Transbaikal region, Russia (Baksheev et al., Reference Baksheev, Prokofiev, Zaraisky, Chitalin, Yapaskurt, Nikolaev, Tikhomirov, Nagornaya, Rogacheva, Gorelikova and Kononov2012); 0.58 at Kidd Creek, Ontario (Slack et al., Reference Slack, Ramsden, Griffin, Win, French, Ryan, Hannington and Barrie1999); 0.53 at Yunlong, China (Jiang et al., Reference Jiang, Yu and Lu2004); 0.48 at San Rafael, Peru (Mlynarczyk and Williams-Jones, Reference Mlynarczyk and Williams-Jones2006) and 0.44 at Roche, southwest England (Williamson et al., Reference Williamson, Spratt, Adams, Tindle and Stanley2000).
Gorelikova (Reference Gorelikova1988) reported Mössbauer data according to which the Fe3+/Fetot value in tourmaline from the Solnechnoe deposit ranges from 6 to 16%, which is consistent with our data (3–16%). The Fe3+/Fetot values increased from the molybdenum- to tin-stage tourmaline indicating an increase in oxidative potential in the mineral-forming fluid.
The Fe3+/Fetot value in tourmaline appears to be suitable to be one of the indications for the type of tin deposit: greisen, hydrothermal intrusion-related and porphyry. In greisen tourmaline it does not exceed 10% (Korovushkin et al., Reference Korovushkin, Kuzmin and Belov1979; Gorelikova, Reference Gorelikova1988); in tourmaline from intrusion-related tin deposits this value is ~15% (Korovushkin et al., Reference Korovushkin, Kuzmin and Belov1979; Gorelikova, Reference Gorelikova1988; this study), and in tourmaline from porphyry tin deposits it is higher than 20% (Baksheev et al., Reference Baksheev, Tikhomirov, Yapaskurt, Vigasina, Prokofiev and Ustinov2009). Therefore, we conclude that tourmaline from intrusion-related tin deposits is intermediate in the Fe3+/Fetot value between tourmalines from greisen and porphyry tin deposits.
Conclusions
At the Solnechnoe intrusion-related hydrothermal tin deposit in the Russian Far East, the three crystallisation stages of tourmaline-supergroup minerals differ in their chemical substitutions. The tin-stage tourmaline crystallised at in a dynamic fluid regime with oscillated temperature, salinity and iron concentration. The Fe3+/Fetot value increased from the molybdenum- to tin-stage tourmaline testifing to increasing oxidation potential, which favoured the cassiterite deposition. The character of the chemical substitution in tourmaline combined with the Fe3+/Fetot value allows the deposit type (greisen, intrusion-related and porphyry tin) to be distinguished.
Acknowledgements
We thank Barbara Dutrow, Darrel Henry, Jan Cempirek, and Associate Editor Ferdinando Bosi for their valuable comments that improved the manuscript.