I. Introduction
Corporate finance theory has long recognized that firm value is shaped not only by traditional factors like taxes and bankruptcy costs but also by complex agency frictions between stakeholders. These relationships create conflicts of interest that can lead to substantial deviations from optimal corporate policies (see, e.g., Morellec (Reference Morellec2004), Lambrecht and Myers (Reference Lambrecht and Myers2008), and Wang (Reference Wang2011)). Although extensive research has examined these conflicts in isolation, less is known about their interactions and joint effects on corporate decisions. Our article develops a unified theoretical framework for studying how agency conflicts between managers, shareholders, and creditors jointly influence corporate investment and financing decisions within a dynamic real option setting.
Central to our analysis is the interaction between two key agency problems. First, controlling shareholders (represented by a manager) can extract private benefits by diverting firm resources, creating conflicts with minority shareholders. These private benefits can take various forms, including excessive compensation, perquisite consumption, related-party transactions, and tunneling behaviors. Recent empirical evidence from Morellec, Nikolov, and Schürhoff (Reference Morellec, Nikolov and Schürhoff2018), analyzing 12,652 firms across 14 countries, shows that such private benefits amount to 2.6% (4.4%) of free cash flows for the median (average) firm. Second, following Myers (Reference Myers1977) and the dynamic extensions in Mauer and Ott (Reference Mauer, Ott, Brennan and Trigeorgis2000) and Hackbarth and Mauer (Reference Hackbarth and Mauer2012), the issuance of debt introduces conflicts between equity holders and creditors through debt overhang, as equity holders bear the full cost of new investments while sharing the benefits with existing creditors.Footnote 1
Building on Mauer and Ott’s (Reference Mauer, Ott, Brennan and Trigeorgis2000) framework, we develop a continuous-time model where a firm has both assets in place, generating stochastic cash flows, and a growth option to expand operations by paying a fixed investment cost. The manager, who controls the investment option and makes default decisions, can divert a fraction of net cash flows for private benefits. Before exercising the growth option, the manager can issue debt to exploit tax benefits and sell equity to minority shareholders while retaining partial ownership. This setup creates a rich environment to examine how ownership structure and financing choices interact with investment efficiency.
Our analysis reveals three key forces that shape investment decisions. First, a diversion effect incentivizes investment earlier than the firm-value maximizing threshold (overinvestment), as the manager seeks to maximize the combination of his equity value and diverted cash flows (see Jensen (Reference Jensen1986), Stulz (Reference Stulz1990), and Morellec (Reference Morellec2004)). Second, a countervailing cost-sharing effect arises because the manager’s equity stake (“skin-in-the-game”) means he bears a portion of the investment cost, encouraging him to invest later than optimal (underinvestment) (see, e.g., Jensen and Meckling (Reference Jensen and Meckling1976), Morck, Shleifer, and Vishny (Reference Morck, Shleifer and Vishny1989), and Claessens, Djankov, Fan, and Lang (Reference Claessens, Djankov, Fan and Lang2002)). Third, the debt overhang effect from the shareholder–creditor conflict typically delays investment beyond the firm-value maximizing threshold (underinvestment) because equity holders must bear the full investment cost while sharing benefits with creditors (see, e.g., Mauer and Ott (Reference Mauer, Ott, Brennan and Trigeorgis2000), Pawlina (Reference Pawlina2010), and Hackbarth and Mauer (Reference Hackbarth and Mauer2012)).
A key insight of our analysis is that these offsetting incentive effects can achieve a zero-agency cost solution under certain conditions. Our model captures how the previous three driving forces evolve in response to changes in resource diversion, corporate tax rates, cash flow volatility, managerial ownership, and capital structure. We show that at specific levels of these primary economic factors, the three effects can exactly offset each other, resulting in firm-optimal investment policies. For example, for a given managerial ownership stake, there exists a combination of cash flow diversion and leverage at which the manager’s chosen investment policy (manager-optimal) exactly matches the policy that maximizes firm value (firm-optimal). These findings suggest that seemingly inefficient governance structures might actually help achieve efficient investment outcomes by balancing competing distortions.
We examine the optimal ownership and capital structure, along with investment efficiency, and conduct comparative statics with respect to key parameters including managerial diversion, tax rates, and volatility. Our findings reveal that in addition to balancing investment efficiency, the optimal capital structure and ownership structure also weigh the trade-off between tax shield benefits and bankruptcy costs, while simultaneously depending on the initial cash flow level. From the perspective of investment efficiency, as resource diversion increases, the optimal managerial ownership rises to mitigate the enhanced overinvestment incentives. In equilibrium, the manager achieves an optimal balance between the investment cost he bears and the cash flow revenue he captures.
We make several novel contributions to the literature. First, our article shows how agency conflicts can have countervailing effects and may produce firm value-maximizing outcomes. Second, we demonstrate how debt financing and managerial ownership can act as substitutes in mitigating agency conflicts. This substitutability arises because both mechanisms can help counter the overinvestment incentives created by private benefits through different channels. Third, we show that agency costs exhibit U-shaped relationships with various parameters, including private benefits, tax rates, volatility, managerial ownership, and leverage. These non-monotonic relationships highlight the complex interactions between different agency problems and suggest that moderate levels of these parameters might be optimal. Fourth, we characterize how optimal ownership and capital structures emerge from the interactions between agency conflicts, tax benefits, and bankruptcy costs.
Our findings help explain several empirical patterns documented in the literature, including the relationship between ownership concentration and firm value (see, e.g., Morck, Shleifer, and Vishny (Reference Morck, Shleifer and Vishny1988), McConnell and Servaes (Reference McConnell and Servaes1990)) and the financing preferences of family-controlled firms (see, e.g., Romano, Tanewski, and Smyrnios (Reference Romano, Tanewski and Smyrnios2001), Wu, Chua, and Chrisman (Reference Wu, Chua and Chrisman2007)). The model generates new testable predictions about how agency conflicts affect investment timing and the determination of ownership and capital structure, particularly regarding how these choices should vary with firm characteristics and the institutional environment.
The remainder of this artile is organized as follows: Section II describes the model setup. Section III investigates the investment strategies under two benchmark scenarios, each under a single agency conflict. Section IV explores the ownership structure, capital structure, and investment efficiency in the presence of both agency conflicts. Section V discusses the model extension, empirical relevance, and related literature. Section VI concludes the article. All mathematical derivations are included in the appendices.
II. Model
Time is continuous and goes to infinity:
 $ t\in \left[0,+\infty \right) $
. We consider a firm with three types of stakeholders: a manager representing the controlling shareholders, minority shareholders, and creditors. Throughout our analysis, we assume all agents are risk-neutral, deep-pocketed, and are protected by limited liability. All agents discount future cash flows at a rate of
 $ r $
.
The firm’s assets generate cash flows at a rate
 $ {X}_t $
, which follows
 $$ \mathrm{d}{X}_t=\mu {X}_t\mathrm{d}t+\sigma {X}_t\mathrm{d}{Z}_t,\hskip2em {X}_0={x}_0>0, $$
where
 $ \mu $
represents the expected growth rate,
 $ \sigma $
denotes the volatility, and
 $ {Z}_t $
is a standard Brownian motion. We assume
 $ \mu <r $
to ensure the firm’s value remains finite. In addition, the firm possesses a one-time growth option: by investing a fixed cost
 $ I $
, the firm can permanently increase its cash flow from
 $ {X}_t $
to
 $ {qX}_t $
, where
 $ q>1 $
. For the remainder of this article, we also refer to this growth option as an investment.
A. External Financing
At
 $ t=0 $
, the manager issues perpetual debt with a constant coupon payment of
 $ c $
to exploit tax shield benefits. In addition, he sells a fraction
 $ \left(1-\lambda \right) $
of equity to minority shareholders, retaining only a fraction
 $ \lambda $
for himself. Given tax rate
 $ \tau $
, over a short time interval
 $ \left[t,t+\mathrm{d}t\right) $
, the after-tax cash flow to levered equity before investment is therefore
 $ \left(1-\tau \right)\left({X}_t-c\right)\mathrm{d}t $
. We assume that full loss offsets are available in terms of tax treatment.
Despite selling the securities, the manager remains the sole decision maker for the firm (i.e., he decides whether and when to exercise the growth option, as well as if and when to default).Footnote 2 Following Myers’ (Reference Myers1977) argument that issuing risky debt diminishes a firm’s present market value by inducing suboptimal growth investment strategies, we assume that the growth investment is fully equity-financed.Footnote 3 Upon exercising the growth option, the investment cost
 $ I $
is shared between the manager and minority shareholders proportionally to their equity stakes,
 $ \lambda $
and
 $ \left(1-\lambda \right) $
, respectively.
B. Private Benefits of Control
The firm operates under imperfect corporate governance, allowing the manager to extract control-related private benefits. We assume that creditors and the government have priority over the manager’s diversion privilege (see, e.g., Morellec, Nikolov, and Schürhoff (Reference Morellec, Nikolov and Schürhoff2012), Morellec et al. (Reference Morellec, Nikolov and Schürhoff2018)). Specifically, the manager can divert a fraction
 $ \theta \in \left[0,1\right) $
of earnings after interest and taxes for personal consumption.Footnote 4 The remaining portion
 $ \left(1-\theta \right) $
is distributed as dividends to all shareholders on a pro rata basis. The diversion rate
 $ \theta $
quantifies the deficiency in corporate governance. This potential for cash diversion creates a conflict of interest between the manager and minority shareholders, which we refer to as the “owner–manager conflict.”
C. Default
While debt issuance offers tax shield benefits, it also introduces default risk. As standard in the literature, the manager optimally chooses to default when cash flow
 $ {X}_t $
deteriorates sufficiently. Upon default, a fraction
 $ \alpha $
of the unlevered firm value is lost to bankruptcy costs, while creditors receive the remaining fraction
 $ \left(1-\alpha \right) $
of the unlevered firm value, and shareholders get nothing.
D. Equilibrium
Let
 $ \overline{T} $
be the endogenous time that the manager exercises the growth option and
 $ \underline{T} $
be the endogenous time of default. Note that default could occur either before or after the investment. If default happens before the investment, the firm loses the growth option due to its tarnished reputation and the preemption by potential competitors.
Let
 $ {W}_t $
be the manager’s continuation value:
 $$ {\displaystyle \begin{array}{l}\hskip3.7em {W}_t={\unicode{x1D53C}}_t\left[{\int}_t^{\overline{T}\wedge \underline{T}}{e}^{-r\left(s-t\right)}\underset{\mathrm{net}\hskip0.32em \mathrm{cash}\ \mathrm{flow}\ \mathrm{before}\ \mathrm{investment}}{\underbrace{\left(\theta +\lambda \left(1-\theta \right)\right)\left(1-\tau \right)\left({X}_s-c\right)}}\mathrm{d}s-{e}^{-r\left(\overline{T}-t\right)}\underset{\mathrm{investment}\ \mathrm{cost}}{\underbrace{\lambda I}}\right.\\ {}\hskip7em \left.+{\int}_{\overline{T}\wedge \underline{T}}^{\underline{T}}{e}^{-r\left(s-t\right)}\underset{\mathrm{net}\hskip0.22em \mathrm{cash}\ \mathrm{flow}\ \mathrm{after}\ \mathrm{investment}}{\underbrace{\left(\theta +\lambda \left(1-\theta \right)\right)\left(1-\tau \right)\left({qX}_s-c\right)}}\mathrm{d}s\right].\end{array}} $$
Similarly, we define
 $ {J}_t $
as minority shareholders’ continuation value:
 $$ {\displaystyle \begin{array}{l}{J}_t={\unicode{x1D53C}}_t\left[{\int}_t^{\overline{T}\wedge \underline{T}}{e}^{-r\left(s-t\right)}\underset{\mathrm{net}\;\mathrm{cash}\ \mathrm{flow}\ \mathrm{before}\ \mathrm{investment}}{\underbrace{\left(1-\lambda \right)\left(1-\theta \right)\left(1-\tau \right)\left({X}_s-c\right)}}\mathrm{d}s-{e}^{-r\left(\overline{T}-t\right)}\underset{\mathrm{investment}\ \mathrm{cost}}{\underbrace{\left(1-\lambda \right)I}}\right.\\ {}\hskip3em \left.+{\int}_{\overline{T}\wedge \underline{T}}^{\underline{T}}{e}^{-r\left(s-t\right)}\underset{\mathrm{net}\hskip0.32em \mathrm{cash}\ \mathrm{flow}\ \mathrm{after}\ \mathrm{investment}}{\underbrace{\left(1-\lambda \right)\left(1-\theta \right)\left(1-\tau \right)\left({qX}_s-c\right)}}\mathrm{d}s\right].\end{array}} $$
Creditors receive coupon payments until the firm defaults, after which they receive a fraction
 $ \left(1-\alpha \right) $
of the unlevered firm value. Their valuation is therefore:
 $$ {D}_t={\unicode{x1D53C}}_t\left[{\int}_t^{\underline{T}}{e}^{-r\left(s-t\right)}c\mathrm{d}s+{e}^{-r\left(\underline{T}-t\right)}\left(1-\alpha \right)\left(\frac{1-\tau }{r-\mu}\right)\left({1}_{\left\{\overline{T}\le \underline{T}\right\}}{qX}_{\underline{T}}+{1}_{\left\{\underline{T}<\overline{T}\right\}}{X}_{\underline{T}}\right)\right], $$
where
 $ {1}_{\left\{\cdot \right\}} $
represents the indicator function. Finally, firm value is the sum of equations (1)–(3) and is given by
 $$ {\displaystyle \begin{array}{l}{V}_t={\unicode{x1D53C}}_t\left[{\int}_t^{\overline{T}\wedge \underline{T}}{e}^{-r\left(s-t\right)}\left[\left(1-\tau \right){X}_s+\tau c\right]\mathrm{d}s+{\int}_{\overline{T}\wedge \underline{T}}^{\underline{T}}{e}^{-r\left(s-t\right)}\left[\left(1-\tau \right){qX}_s+\tau c\right]\mathrm{d}s\right.\\ {}\hskip4.3em \left.-{e}^{-r\left(\overline{T}-t\right)}I+{e}^{-r\left(\underline{T}-t\right)}\left(1-\alpha \right)\left(\frac{1-\tau }{r-\mu}\right)\left({1}_{\left\{\overline{T}\le \underline{T}\right\}}{qX}_{\underline{T}}+{1}_{\left\{\underline{T}<\overline{T}\right\}}{X}_{\underline{T}}\right)\right].\end{array}} $$
We look for a Markov Perfect Equilibrium where
 $ {X}_t $
is the payoff-relevant state variable. As such, the valuations satisfy
 $ {W}_t=W\left({X}_t\right) $
,
 $ {J}_t=J\left({X}_t\right) $
,
 $ {D}_t=D\left({X}_t\right) $
, and
 $ {V}_t=V\left({X}_t\right) $
. We seek an equilibrium in which investment and default both follow threshold strategies: the firm invests when cash flows rise above a pre-determined threshold (
 $ {x}_i $
) prior to declaring default and defaults when cash flows drop below the endogenous default thresholds. Note that default may occur before or after investment, so there will be two default thresholds. Before making the investment, default happens at
 $ {x}_{\mathrm{\ell}} $
, whereas after investment, default happens when
 $ {X}_t $
falls to
 $ {x}_d $
.
We distinguish between two investment strategies. The firm-optimal strategy aims to maximize firm value subject to the manager’s limited liability, while the manager-optimal strategy maximizes the manager’s continuation value.Footnote 5 The two strategies are respectively captured by two investment thresholds
 $ {x}_i^F $
and
 $ {x}_i^S $
. Throughout the article, we define overinvestment as scenarios when
 $ {x}_i^S<{x}_i^F $
, and underinvestment as those when
 $ {x}_i^S>{x}_i^F $
. In equilibrium, creditors and minority shareholders fully anticipate the manager’s future policies and price the securities fairly at issuance. At
 $ t=0 $
, the manager chooses the capital and ownership structure
 $ \left\{c,\lambda \right\} $
to maximize the sum of his continuation value and the proceeds from selling these securities. For the remainder of the article, we denote by
 $ {V}^F $
and
 $ {V}^S $
the initial firm values under firm-optimal and manager-optimal investment strategies, respectively.
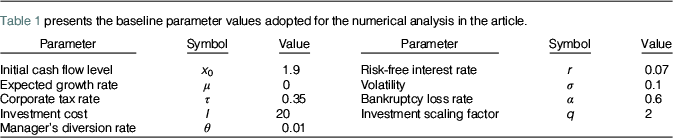
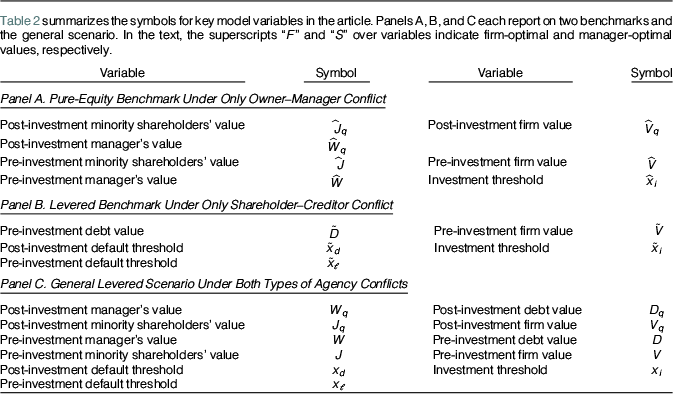
Our model integrates two types of agency conflicts: the owner––manager conflict arising from control-related private benefits and the shareholder–creditor conflict stemming from debt. Table 1 presents the baseline parameter values employed for subsequent numerical analysis.Footnote 6 Table 2 summarizes the key model variables in the article.
Table 1 presents the baseline parameter values adopted for the numerical analysis in the article.

Table 2 summarizes the symbols for key model variables in the article. Panels A, B, and C each report on two benchmarks and the general scenario. In the text, the superscripts “
 $ F $
” and “
 $ S $
” over variables indicate firm-optimal and manager-optimal values, respectively.

III. Two Benchmark Scenarios
Before analyzing the full model, we examine two benchmarks: a pure-equity firm with only owner–manager conflict and a levered firm with only shareholder–creditor conflict. These benchmarks help illustrate how a single agency conflict impacts investment efficiency.
A. Overinvestment and Owner–Manager Conflict
We first study the scenario where the firm is all-equity financed. The model is time-homogeneous; thus, without loss of generality, we abbreviate the expectation operator under pricing measure
 $ \unicode{x1D53C}\left[\cdot |{X}_0=x\right] $
to
 $ \unicode{x1D53C}\left[\cdot \right] $
. We use “̂” to denote the value functions and investment thresholds in this benchmark.
Define the first-passage time that
 $ {X}_t $
hits the endogenous investment threshold
 $ {\hat{x}}_i $
from below by
 $$ \overline{T}\left({\hat{x}}_i\right):= \operatorname{inf}\left\{t\ge 0:{X}_t\ge {\hat{x}}_i\right\}. $$
The manager exercises the investment option once
 $ {X}_t $
reaches
 $ {\hat{x}}_i $
from below. Thus, the manager’s continuation value in equation (1) becomes
 $$ \hat{W}(x)=\unicode{x1D53C}\left[{\int}_0^{\overline{T}\left({\hat{x}}_i\right)}{e}^{- rt}\left(\theta +\lambda \left(1-\theta \right)\right)\left(1-\tau \right){X}_t\mathrm{d}t+{e}^{-r\overline{T}\left({\hat{x}}_i\right)}\left[{\hat{W}}_q\left({\hat{x}}_i\right)-\lambda I\right]\right], $$
where
 $$ {\hat{W}}_q(x)=\unicode{x1D53C}\left[{\int}_0^{+\infty }{e}^{- rt}\left(\theta +\lambda \left(1-\theta \right)\right)\left(1-\tau \right){qX}_t\mathrm{d}t\right]=\left(\theta +\lambda \left(1-\theta \right)\right)\left(\frac{1-\tau }{r-\mu}\right) qx $$
is the manager’s post-investment continuation value. Similarly, firm value in equation (4) becomes
 $$ \hat{V}(x)=\unicode{x1D53C}\left[{\int}_0^{\overline{T}\left({\hat{x}}_i\right)}{e}^{- rt}\left(1-\tau \right){X}_t\mathrm{d}t+{e}^{-r\overline{T}\left({\hat{x}}_i\right)}\left[{\hat{V}}_q\left({\hat{x}}_i\right)-I\right]\right], $$
where
 $$ {\hat{V}}_q(x)=\unicode{x1D53C}\left[{\int}_0^{+\infty }{e}^{- rt}\left(1-\tau \right){qX}_t\mathrm{d}t\right]=\left(\frac{1-\tau }{r-\mu}\right) qx $$
is the post-investment firm value.
Let
 $ {\hat{x}}_i^S $
and
 $ {\hat{x}}_i^F $
respectively denote the manager-optimal and firm-optimal investment thresholds. The solution steps follow the standard literature on investment as a real option (see McDonald and Siegel (Reference McDonald and Siegel1986), Dixit and Pindyck (Reference Dixit and Pindyck1994)). Therefore, we omit the details and leave them in Appendix A.2. By the standard smooth-pasting conditions,
 $$ {\left.\frac{\partial \hat{W}(x)}{\partial x}\right|}_{x={\hat{x}}_i^S-}={\left.\frac{\partial {\hat{W}}_q(x)}{\partial x}\right|}_{x={\hat{x}}_i^S+},\hskip2em {\left.\frac{\partial \hat{V}(x)}{\partial x}\right|}_{x={\hat{x}}_i^F-}={\left.\frac{\partial {\hat{V}}_q(x)}{\partial x}\right|}_{x={\hat{x}}_i^F+}, $$
we derive the manager-optimal and firm-optimal investment thresholds:
 $$ {\displaystyle \begin{array}{l}{\hat{x}}_i^S=\left(\frac{\lambda }{\theta +\lambda \left(1-\theta \right)}\right)\left(\frac{1}{q-1}\right)\left(\frac{r-\mu }{1-\tau}\right)\left(\frac{\gamma_{+}}{\gamma_{+}-1}\right)I,\\ {}{\hat{x}}_i^F=\left(\frac{1}{q-1}\right)\left(\frac{r-\mu }{1-\tau}\right)\left(\frac{\gamma_{+}}{\gamma_{+}-1}\right)I,\end{array}} $$
where
 $ {\gamma}_{+} $
is given by equation (A.2) in Appendix A.1.
We can show that
 $$ \frac{\partial {\hat{x}}_i^S}{\partial \theta }=-\left(\frac{1-\lambda }{\theta +\lambda \left(1-\theta \right)}\right){\hat{x}}_i^S\le 0,\hskip2em \frac{\partial {\hat{x}}_i^S}{\partial \lambda }=\left(\frac{\theta }{\theta +\lambda \left(1-\theta \right)}\right)\left(\frac{{\hat{x}}_i^S}{\lambda}\right)\ge 0. $$
A higher
 $ \theta $
increases the manager’s private gains from cash diversion, thereby increasing his incentives for overinvestment. For the rest of the article, we refer to this effect as the diversion effect. Conversely, an increase in
 $ \lambda $
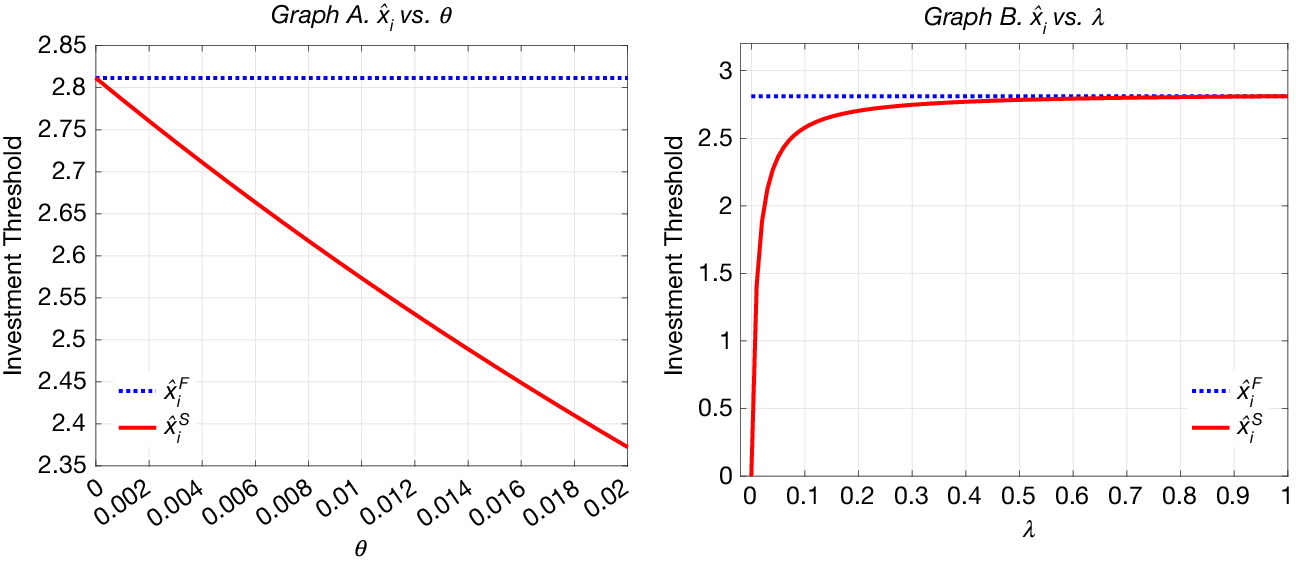
raises the investment cost borne by the manager, which increases his incentives for underinvestment. This effect is termed the cost-sharing effect. Figure 1 illustrates these patterns.
In the benchmark shown in Figure 1, the firm issues no debt (
 $ c=0 $
). Graph A varies the diversion rate
 $ \theta $
, with
 $ {\hat{x}}_i^S={\hat{x}}_i^F $
at
 $ \theta =0 $
. Graph B varies managerial ownership
 $ \lambda $
, with
 $ {\hat{x}}_i^S={\hat{x}}_i^F $
at
 $ \lambda =1 $
. Parameters:
 $ r=0.07 $
,
 $ \mu =0 $
,
 $ \sigma =0.1 $
,
 $ \tau =0.35 $
,
 $ I=20 $
,
 $ q=2 $
,
 $ \theta =0.01 $
, and
 $ \lambda =0.075 $
.

It is easily seen that
 $ {\hat{x}}_i^S=\left(\frac{\lambda }{\theta +\lambda \left(1-\theta \right)}\right){\hat{x}}_i^F\le {\hat{x}}_i^F $
(i.e., in this benchmark, the diversion effect always dominates the cost-sharing effect). The ratio
 $ \frac{\lambda }{\theta +\lambda \left(1-\theta \right)} $
captures the manager’s trade-off in making the investment: he bears only a fraction
 $ \lambda $
of the investment cost but receives a fraction
 $ \theta +\lambda \left(1-\theta \right)\ge \lambda $
of the cash flows. Given that
 $ \theta +\lambda \left(1-\theta \right)\ge \lambda $
, the manager has incentives to overinvest, which in this context manifests as exercising the investment option too early. Note that
 $ {\hat{x}}_i^S={\hat{x}}_i^F $
, that is, the manager makes the investment that is firm-optimal, holds under two specific conditions: when
 $ \lambda =1 $
(the manager bears the full investment cost) or when
 $ \theta =0 $
(there is no opportunity for cash flow diversion). In either case, the manager’s interests align perfectly with maximizing firm value, eliminating his incentives to overinvest.
We compute the derivative of the initial firm value under manager-optimal strategy as:
 $$ {\displaystyle \begin{array}{l}\frac{\partial {\hat{V}}^S\left({x}_0;\lambda \right)}{\partial \lambda }=\left(I{\gamma}_{+}\right)\left(\frac{1-\lambda }{\lambda}\right){\left(\frac{\theta }{\theta +\lambda \left(1-\theta \right)}\right)}^2{\left(\frac{x_0}{{\hat{x}}_i^S}\right)}^{\gamma_{+}}\ge 0,\\ {}\frac{\partial {\hat{V}}^S\left({x}_0;\lambda \right)}{\partial \theta }=-\left(\theta I{\gamma}_{+}\right){\left(\frac{1-\lambda }{\theta +\lambda \left(1-\theta \right)}\right)}^2{\left(\frac{x_0}{{\hat{x}}_i^S}\right)}^{\gamma_{+}}\le 0.\end{array}} $$
Firm value increases with
 $ \lambda $
and decreases with
 $ \theta $
, and achieves the value under firm-optimal strategy when
 $ \lambda =1 $
. Therefore, at
 $ t=0 $
, the manager’s optimal ownership strategy is to set
 $ \lambda =1 $
, which eliminates minority shareholders and perfectly aligns managerial incentives with firm interests.
B. Underinvestment and Shareholder–Creditor Conflict
Next, we allow the firm to issue debt (i.e.,
 $ c>0 $
), but assume away owner–manager conflict by setting either
 $ \theta =0 $
or
 $ \lambda =1 $
. This framework follows Mauer and Ott (Reference Mauer, Ott, Brennan and Trigeorgis2000). We use “~” to denote the value functions and thresholds in this benchmark.
The manager chooses the investment threshold
 $ {\tilde{x}}_i $
, the pre-investment default threshold
 $ {\tilde{x}}_{\mathrm{\ell}} $
, and the post-investment default threshold
 $ {\tilde{x}}_d $
. Let
 $ {\tilde{x}}_i^F $
and
 $ {\tilde{x}}_i^S $
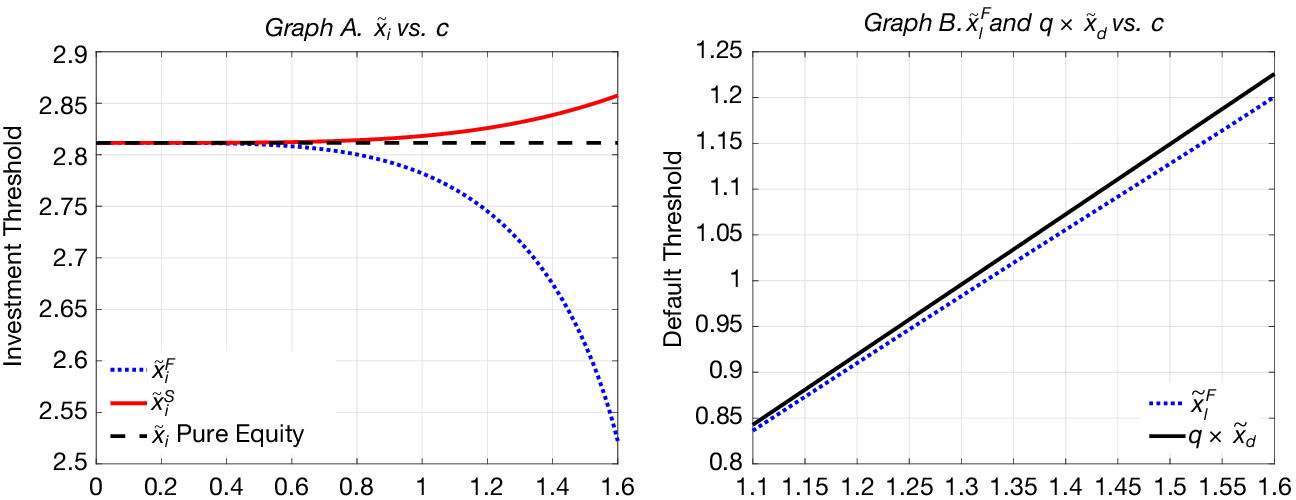
represent the firm- and manager-optimal investment thresholds, respectively, maximizing firm value and the manager’s continuation value. The solution steps closely follow those in Mauer and Ott (Reference Mauer, Ott, Brennan and Trigeorgis2000), and it is a specific case of the equilibrium outlined in the subsequent Section IV. Figure 2 describes the findings.
In Figure 2, the benchmark scenario assumes no private benefits (
 $ \theta =0 $
) or full managerial ownership (
 $ \lambda =1 $
). Graph A displays investment thresholds as a function of coupon payment
 $ c $
, with
 $ {\tilde{x}}_i^S={\tilde{x}}_i^F={\hat{x}}_i $
at
 $ c=0 $
. Graph B illustrates default thresholds versus coupon payment
 $ c $
, with
 $ q\times {\tilde{x}}_d>{\tilde{x}}_{\mathrm{\ell}}^F $
. Parameters:
 $ r=0.07 $
,
 $ \mu =0 $
,
 $ \sigma =0.1 $
,
 $ \tau =0.35 $
,
 $ \alpha =0.6 $
,
 $ I=20 $
, and
 $ q=2 $
.

Graph A of Figure 2 illustrates how investment thresholds
 $ {\tilde{x}}_i^F $
and
 $ {\tilde{x}}_i^S $
vary with coupon payment
 $ c $
. The solid red line indicates that the manager-optimal threshold—chosen by the manager—increases with
 $ c $
. This pattern aligns with the classical debt overhang argument: as the firm issues more debt, equity holders have reduced incentives to invest because they must bear full investment cost while more value accrues to debt holders. If
 $ c=0 $
, the debt overhang effect disappears, and the two investment thresholds are identical.
Interestingly, the dotted blue line shows that the firm-optimal investment threshold decreases with
 $ c $
. In other words, it is optimal for the firm to exercise the investment option earlier as it takes on more debt. This occurs because more debt leads to an earlier default, as confirmed by Graph B, where the default thresholds increase with
 $ c $
. Once the firm defaults, it loses the investment option. Therefore, it is optimal to exercise the option earlier as the firm takes on more debt. Note that Graph B also shows that the post-investment default cash flow threshold
 $ q\times {\tilde{x}}_d $
is always above the pre-investment cash flow threshold
 $ {\tilde{x}}_{\mathrm{\ell}}^F $
.Footnote 7 This difference, again, is due to the value of the investment option.
At
 $ t=0 $
, the manager optimally chooses the coupon payment to maximize firm value under the manager-optimal investment threshold. In this benchmark scenario, the optimal coupon level
 $ {\tilde{c}}^{\ast } $
is determined to be
 $ 1.3697 $
, which effectively balances the trade-off between the tax advantages of debt and potential bankruptcy losses. The corresponding leverage ratio
 $ \left({\tilde{D}}^S/{\tilde{V}}^S\right) $
and yield spread (
 $ {\tilde{c}}^{\ast }/{\tilde{D}}^S-r $
) are
 $ 73.05\% $
and
 $ 0.82\% $
, respectively.
IV. Equilibrium Under Both Agency Conflicts
Recall that Section III.A shows that owner–manager conflict results in overinvestment, whereas Section III.B reveals that shareholder–creditor conflict typically leads to underinvestment. This section studies a levered firm with cash flow diversion, where the incentives for both overinvestment and underinvestment coexist. We will examine how the three forces—the diversion effect, cost-sharing effect, and debt overhang effect—interact to shape the investment outcomes and how they interplay with the firm’s ownership structure and capital structure.
A. Model Solution
This subsection solves the model for arbitrary
 $ \theta $
. The firm- and manager-optimal investment strategies are defined similarly to those in Section III, respectively, maximizing firm value and the manager’s continuation value. Let
 $ {x}_i $
denote the endogenous investment threshold, and
 $ \overline{T}\left({x}_i\right) $
represent the time to exercise the investment option. We employ a backward induction approach, beginning our analysis after the investment option has been exercised, that is,
 $ t>\overline{T}\left({x}_i\right) $
. The problem is identical to Leland (Reference Leland1994). Let
 $ {W}_q(x) $
denote the manager’s continuation value function after investment. We have the following Hamilton–Jacobi–Bellman (HJB) equation:
 $$ {rW}_q(x)=\left(\theta +\lambda \left(1-\theta \right)\right)\left(1-\tau \right)\left( qx-c\right)+\mu x\frac{\partial {W}_q(x)}{\partial x}+\frac{1}{2}{\sigma}^2{x}^2\frac{\partial^2{W}_q(x)}{\partial {x}^2}, $$
which satisfies the value-matching and smooth-pasting conditions at the default boundary
 $ {x}_d $
:
 $$ {W}_q\left({x}_d\right)=0,\hskip2em {\left.\frac{\partial {W}_q(x)}{\partial x}\right|}_{x={x}_d+}=0. $$
These conditions lead to
 $$ {x}_d=\left(\frac{1}{q}\right)\left(\frac{r-\mu }{r}\right)\left(\frac{\gamma_{-}}{\gamma_{-}-1}\right)c, $$
where
 $ {\gamma}_{-} $
is given by equation (A.2) in Appendix A.1. As argued in Leland (Reference Leland1994), the default threshold
 $ {x}_d $
is the same for both the firm- and manager-optimal scenarios.Footnote 8 Note that
 $ {x}_d $
is independent of the diversion rate
 $ \theta $
, managerial ownership
 $ \lambda $
, and the tax rate
 $ \tau $
.
Next turn to
 $ t<\overline{T}\left({x}_i\right) $
. Let
 $ W(x) $
be the manager’s continuation value function, which satisfies the following HJB equation:
 $$ rW(x)=\left(\theta +\lambda \left(1-\theta \right)\right)\left(1-\tau \right)\left(x-c\right)+\mu x\frac{\partial W(x)}{\partial x}+\frac{1}{2}{\sigma}^2{x}^2\frac{\partial^2W(x)}{\partial {x}^2}. $$
There are two boundaries: the manager chooses to default as
 $ {X}_t\downarrow {x}_{\mathrm{\ell}}^S $
and exercises the investment option as
 $ {X}_t\uparrow {x}_i^S $
. Both boundaries satisfy value-matching and smooth-pasting conditions:
 $$ {\displaystyle \begin{array}{l}W\left({x}_{\mathrm{\ell}}^S\right)=0,\hskip2em W\left({x}_i^S\right)={W}_q\left({x}_i^S\right)-\lambda I,\\ {}{\left.\frac{\partial W(x)}{\partial x}\right|}_{x={x}_{\mathrm{\ell}}^S+}=0,\hskip2em {\left.\frac{\partial W(x)}{\partial x}\right|}_{x={x}_i^S-}={\left.\frac{\partial {W}_q(x)}{\partial x}\right|}_{x={x}_i^S+}.\end{array}} $$
The boundary
 $ {x}_i^S $
characterizes the manager-optimal investment strategy. We will compare it with the firm-optimal investment strategy
 $ {x}_i^F $
, which maximizes firm value. Specifically, let
 $ {V}_q(x) $
and
 $ V(x) $
be the firm value functions after and before the investment, satisfying the following HJB equations:
 $$ {\displaystyle \begin{array}{c}{rV}_q(x)=\left(1-\tau \right) qx+\tau c+\mu x\frac{\partial {V}_q(x)}{\partial x}+\frac{1}{2}{\sigma}^2{x}^2\frac{\partial^2{V}_q(x)}{\partial {x}^2},\\ {} rV(x)=\left(1-\tau \right)x+\tau c+\mu x\frac{\partial V(x)}{\partial x}+\frac{1}{2}{\sigma}^2{x}^2\frac{\partial^2V(x)}{\partial {x}^2}.\end{array}} $$
Similarly, the above equations satisfy the following value-matching and smooth-pasting conditions at the thresholds
 $ {x}_d $
,
 $ {x}_{\mathrm{\ell}}^F $
, and
 $ {x}_i^F $
:
 $$ {\displaystyle \begin{array}{l}{V}_q\left({x}_d\right)=\left(1-\alpha \right)\left(\frac{1-\tau }{r-\mu}\right){qx}_d,\hskip1em V\left({x}_{\mathrm{\ell}}^F\right)=\left(1-\alpha \right)\left(\frac{1-\tau }{r-\mu}\right){x}_{\mathrm{\ell}}^F,\hskip1em V\left({x}_i^F\right)={V}_q\left({x}_i^F\right)-I,\\ {}\hskip0em {\left.\frac{\partial {W}_q(x)}{\partial x}\right|}_{x={x}_d+}=0,\hskip2em {\left.\frac{\partial W(x)}{\partial x}\right|}_{x={x}_{\mathrm{\ell}}^F+}=0,\hskip2em {\left.\frac{\partial V(x)}{\partial x}\right|}_{x={x}_i^F-}={\left.\frac{\partial {V}_q(x)}{\partial x}\right|}_{x={x}_i^F+}.\end{array}} $$
Note that the smooth-pasting conditions for the two default thresholds hold for shareholders/manager value because the firm operates under limited liability. This implies that while the investment decision aims to maximize firm value, default decisions—due to limited liability—are still made to maximize the manager’s value.
We proceed to solve the model using standard contingent-claims pricing methods detailed in Appendix A.3. The problem requires numerically solving two equations to find
 $ {x}_i $
and
 $ {x}_{\mathrm{\ell}} $
.
B. Baseline Results and Comparative Statics
At
 $ t=0 $
, the manager jointly chooses
 $ \left\{c,\lambda \right\} $
to maximize the initial firm value
 $ {V}^S\left({x}_0;c,\lambda \right) $
under the manager-optimal investment policy, that is,
 $$ \left\{{c}^{\ast },{\lambda}^{\ast}\right\}:= \underset{\left\{c,\lambda \right\}}{\arg \max}\left\{{V}^S\left({x}_0;c,\lambda \right)\right\}, $$
for given
 $ {x}_0 $
and
 $ \theta >0 $
. Under baseline parameters in Table 1, there is a unique set of internal solutions to problem (9):
 $ {c}^{\ast }=1.4051 $
and
 $ {\lambda}^{\ast }=0.0975 $
, associated with a leverage ratio of
 $ {D}^S/{V}^S=74.58\% $
and a yield spread of
 $ \left({c}^{\ast }/{D}^S-r\right)=0.84\% $
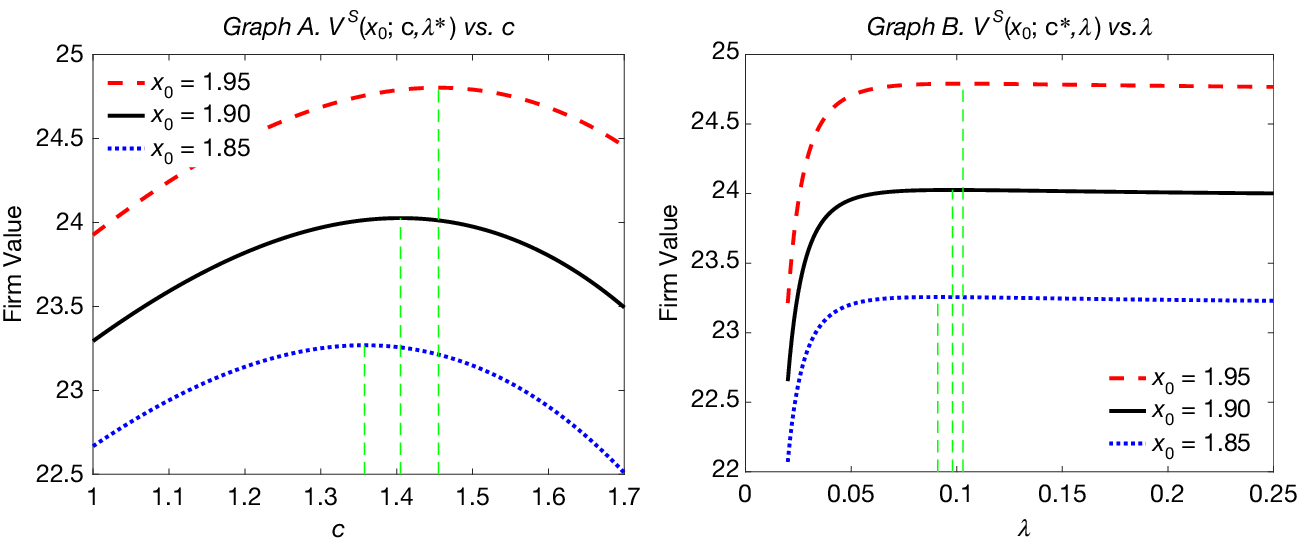
. Figure 3 shows that firm value exhibits an inverted U-shaped function of either
 $ c $
or
 $ \lambda $
. In addition to investment efficiency, the optimal coupon level
 $ {c}^{\ast } $
needs to balance tax shield benefits and bankruptcy losses and also depends on cash flow level
 $ {x}_0 $
. Accordingly, the optimal ownership
 $ {\lambda}^{\ast } $
needs to adjust as well.Footnote 9 Note that
 $ {\lambda}^{\ast }<1 $
, so the cost-sharing effect is weaker compared to the levered benchmark with
 $ \lambda =1 $
in Section III.B. Recall that both the cost-sharing and debt overhang effects contribute to investment delays. Consequently, a higher debt level (
 $ {c}^{\ast }>{\tilde{c}}^{\ast } $
)—and thus a stronger debt overhang effect—is needed to balance investment efficiency, inducing a higher leverage ratio and yield spread.
Under various initial cash flow levels
 $ {x}_0 $
, Graph A of Figure 3 varies
 $ c $
while fixing
 $ {\lambda}^{\ast }=0.0975 $
, and Graph B varies
 $ \lambda $
while fixing
 $ {c}^{\ast }=1.4051 $
. Each curve in the two graphs exhibits an inverted U-shaped function with a unique maximum point, indicated by the vertical dashed line. Parameters:
 $ r=0.07 $
,
 $ \mu =0 $
,
 $ \sigma =0.1 $
,
 $ \tau =0.35 $
,
 $ \alpha =0.6 $
,
 $ I=20 $
,
 $ q=2 $
, and
 $ \theta =0.01 $
.

Table 3 shows the investment and default thresholds under optimal capital and ownership structure. A few patterns emerge. First, the manager’s optimal investment threshold is lower than the firm-optimal threshold:
 $ {x}_i^S<{x}_i^F $
. This occurs because, under these parameter values, the diversion effect dominates the debt overhang and cost-sharing effects, leading to overinvestment. Second, before exercising the investment option, the manager-optimal default threshold is lower than the firm-optimal (
 $ {x}_{\mathrm{\ell}}^S<{x}_{\mathrm{\ell}}^F $
), while after exercising the investment, the two thresholds are identical (both are
 $ q\times {x}_d $
). This result shows that the value of the investment option reduces the manager’s incentives to default.
Table 3 presents the investment and default thresholds in a levered firm with both agency conflicts under optimal capital and ownership structure
 $ \left\{{c}^{\ast },{\lambda}^{\ast}\right\} $
. Parameters:
 $ r=0.07 $
,
 $ \mu =0 $
,
 $ \sigma =0.1 $
,
 $ \tau =0.35 $
,
 $ \alpha =0.6 $
,
 $ I=20 $
,
 $ q=2 $
,
 $ \theta =0.01 $
,
 $ {c}^{\ast }=1.4051 $
, and
 $ {\lambda}^{\ast }=\mathrm{0.0975.} $

Interestingly,
 $ {x}_{\mathrm{\ell}}^S<q\times {x}_d $
, so that the default threshold before investment falls below the one after investment. These findings reveal that the investment option can significantly influence the manager’s default decisions.
We now examine how the model solutions—especially the investment and default thresholds, as well as the optimal ownership and capital structure—depend on the model parameters. We will compare the firm-optimal threshold with the manager-optimal one and, therefore, study how overinvestment and underinvestment are affected by these parameters.
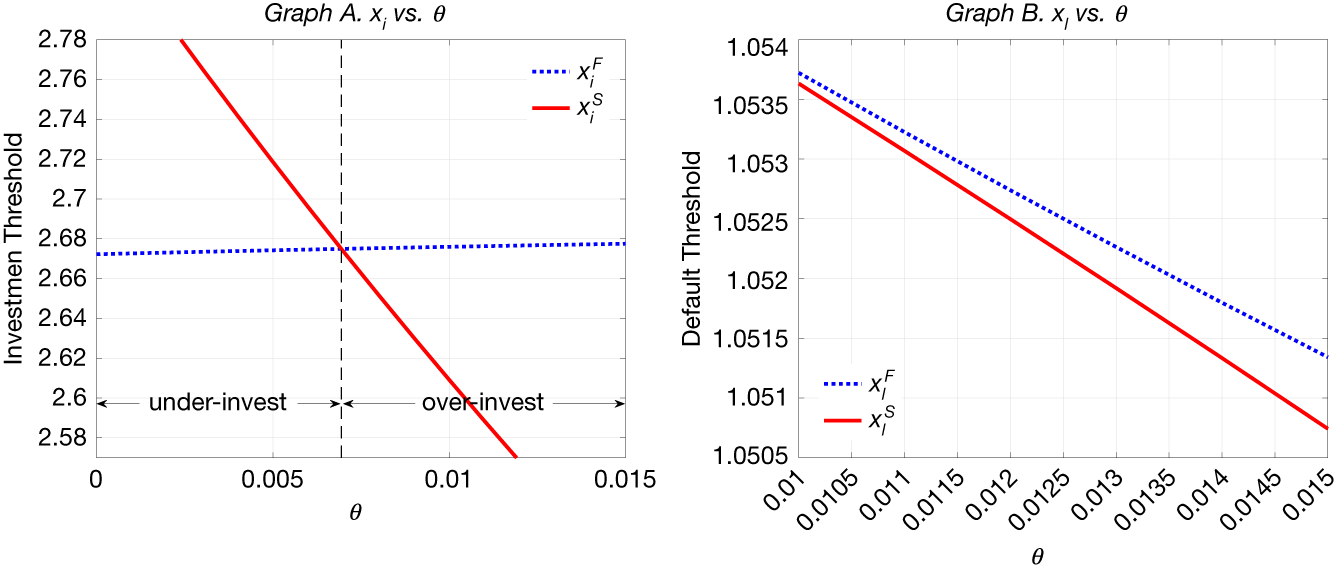
Figure 4 illustrates how the investment and default thresholds depend on the manager’s diversion rate
 $ \theta $
. Graph A shows that the manager-optimal investment threshold
 $ {x}_i^S $
decreases with
 $ \theta $
, because a stronger diversion effect increases the incentives for overinvestment. By contrast, the firm-optimal threshold
 $ {x}_i^F $
increases with
 $ \theta $
because the manager’s incentives to default are diminished at higher values of
 $ \theta $
. This latter effect is confirmed by Graph B, which shows that a higher
 $ \theta $
also reduces
 $ {x}_{\mathrm{\ell}}^F $
, the default threshold before the investment option is exercised. Meanwhile, equation (8) shows that the default threshold
 $ {x}_d $
after the investment option is exercised, however, is independent of
 $ \theta $
. These patterns imply that the manager underinvests when
 $ \theta $
is low and overinvests when
 $ \theta $
is high. Moreover, there exists a threshold level of
 $ \theta $
at which the manager-optimal investment threshold coincides with the firm-optimal threshold.
Figure 4 Graph A highlights an intersection point between
 $ {x}_i^S $
and
 $ {x}_i^F $
. Parameters:
 $ r=0.07 $
,
 $ \mu =0 $
,
 $ \sigma =0.1 $
,
 $ \tau =0.35 $
,
 $ \alpha =0.6 $
,
 $ I=20 $
,
 $ q=2 $
,
 $ {c}^{\ast }=1.4051 $
, and
 $ {\lambda}^{\ast }=0.0975 $
.

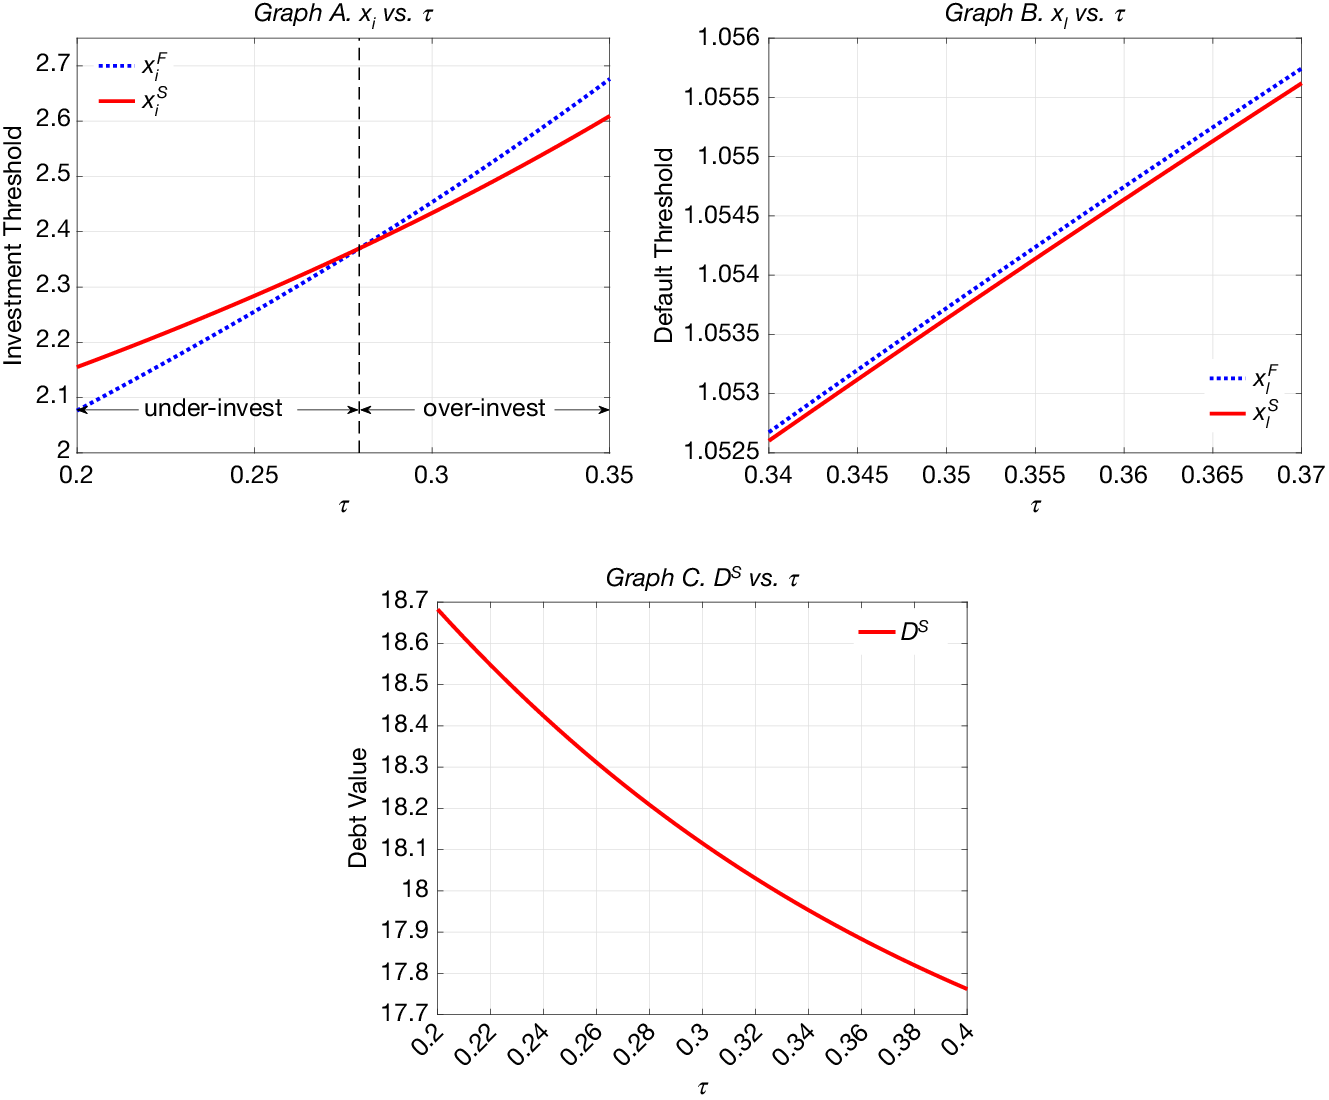
Figure 5 shows how the tax rate
 $ \tau $
affects investment and default decisions. A higher tax rate
 $ \tau $
increases the tax burden of the firm, as the government claims a larger fraction of the cash flows. The reduced after-tax cash flow lowers investment incentives, leading the firms to further delay investment. This is reflected in Graph A, where both firm-optimal and manager-optimal investment thresholds increase with
 $ \tau $
. For the same reason, the manager chooses to default earlier, as confirmed by the higher default thresholds in Graph B. When firms default earlier, the market value of the firm’s debt decreases, which weakens the debt overhang effect. These combined effects explain why we observe underinvestment when
 $ \tau $
is low but overinvestment when
 $ \tau $
is high.
Figure 5 Graph A highlights an intersection point between
 $ {x}_i^S $
and
 $ {x}_i^F $
. Parameters:
 $ {x}_0=1.9 $
,
 $ r=0.07 $
,
 $ \mu =0 $
,
 $ \sigma =0.1 $
,
 $ \alpha =0.6 $
,
 $ I=20 $
,
 $ q=2 $
,
 $ \theta =0.01 $
,
 $ {c}^{\ast }=1.4051 $
, and
 $ {\lambda}^{\ast }=0.0975 $
.

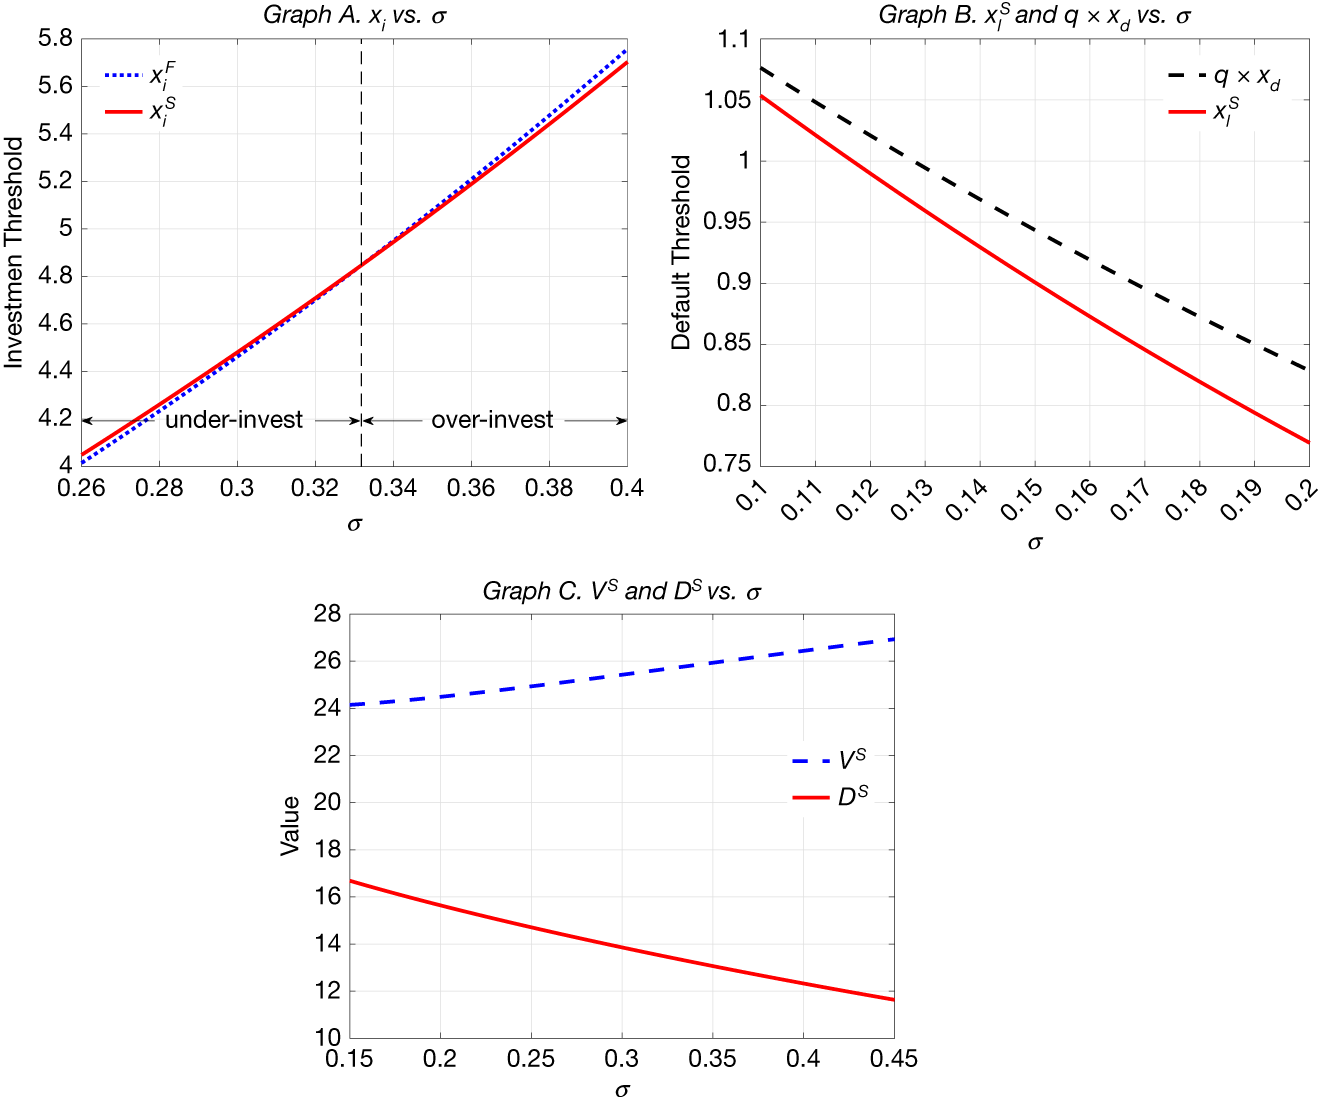
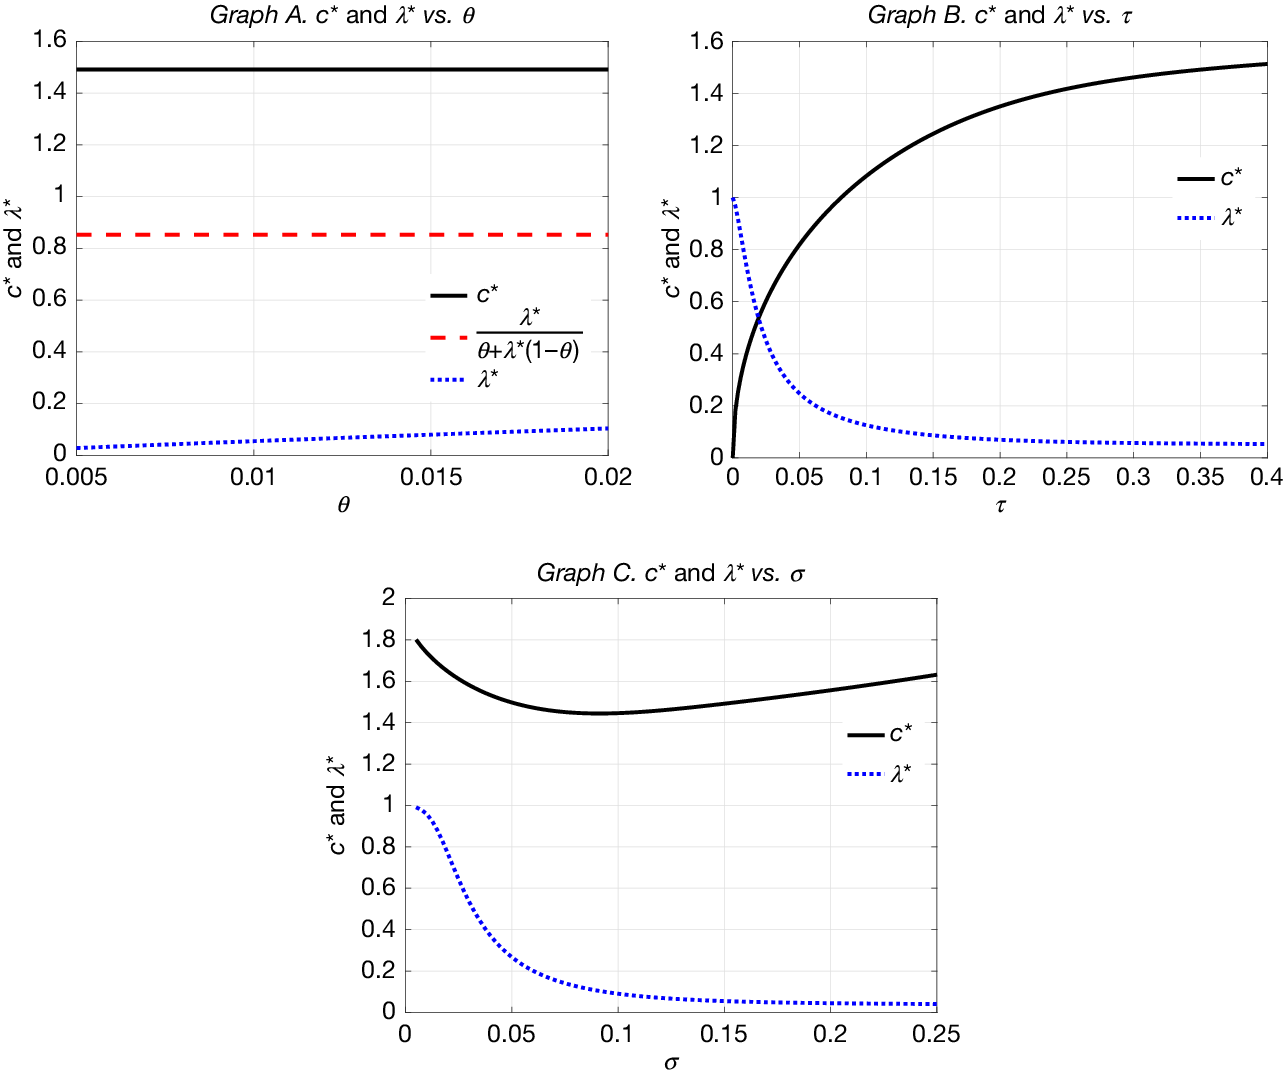
Figure 6 shows how cash flow volatility
 $ \sigma $
affects investment and default decisions. A higher volatility
 $ \sigma $
has two effects. First, following standard real-option logic, higher uncertainty increases the value of waiting and firm value, as confirmed by Graph C. Consistently, Graph A shows that both the firm- and manager-optimal investment thresholds increase with
 $ \sigma $
. For this reason, firms default at lower thresholds when uncertainty is higher, as shown in Graph B. Second, under the same coupon payment
 $ c $
, a higher
 $ \sigma $
reduces the market value of debt, as illustrated in Graph C. As a result, the debt overhang effect becomes weaker at higher levels of volatility. These two effects combined explain why there is underinvestment when
 $ \sigma $
is low but overinvestment when
 $ \sigma $
is high.
Figure 6 Graph A highlights an intersection point between
 $ {x}_i^S $
and
 $ {x}_i^F $
. Parameters:
 $ {x}_0=1.9 $
,
 $ r=0.07 $
,
 $ \mu =0 $
,
 $ \tau =0.35 $
,
 $ \alpha =0.6 $
,
 $ I=20 $
,
 $ q=2 $
,
 $ \theta =0.01 $
,
 $ {c}^{\ast }=1.4051 $
, and
 $ {\lambda}^{\ast }=0.0975 $
.

Figure 7 illustrates how the joint optimal managerial ownership and coupon level determined by problem (9) vary with diversion rate, tax rate, and volatility. Graph A shows that the optimal managerial ownership
 $ {\lambda}^{\ast } $
increases with
 $ \theta $
. The reason is that when
 $ \theta $
increases, the diversion effect becomes stronger. The manager needs to share more investment costs to offset the overinvestment incentives. In fact, the ratio
 $ \frac{\lambda^{\ast }}{\theta +{\lambda}^{\ast}\left(1-\theta \right)} $
stays unchanged, so that the optimal coupon level
 $ {c}^{\ast } $
also stays unchanged.Footnote 10 Graph B illustrates that as the tax rate rises, the tax shield benefits increase, so the manager prefers to issue more debt. As a result, the manager needs to share less investment cost (lower
 $ {\lambda}^{\ast } $
).Footnote 11 Graph C shows that
 $ {c}^{\ast } $
exhibits a U-shaped relationship with
 $ \sigma $
, consistent with Leland (Reference Leland1994). It also shows that
 $ {\lambda}^{\ast } $
decreases with
 $ \sigma $
, which is because by selling more equity, the manager can better diversify the increased cash flow risk.
In Figure 7, the ratio
 $ \frac{\lambda^{\ast }}{\theta +{\lambda}^{\ast}\left(1-\theta \right)} $
and optimal
 $ {c}^{\ast } $
in Graph A remain constant across various
 $ \theta $
. Parameters:
 $ {x}_0=1.9 $
,
 $ r=0.07 $
,
 $ \mu =0 $
,
 $ \sigma =0.15 $
,
 $ \tau =0.35 $
,
 $ \alpha =0.5 $
,
 $ I=20 $
,
 $ q=2 $
, and
 $ \theta =0.01 $
.

C. Optimal Capital or Ownership Structure
In practice, firms often face constraints in simultaneously optimizing their capital and ownership structure. On the one hand, firms may be able to optimize capital structure but face limitations in adjusting ownership structure due to regulatory requirements, insider trading laws, disclosure rules, and shareholder preferences. On the other hand, firms may optimally adjust ownership structure but fail to optimize capital structure due to financial constraints, covenant restrictions, and regulatory rules. This subsection explores scenarios where firms can optimally choose either their capital structure or ownership structure, but not both.
We first investigate the firm-value-maximizing coupon level (
 $ {c}^{\ast } $
) for a given stock ownership (
 $ \lambda $
) and resource diversion (
 $ \theta $
), that is, we solve the optimization problemFootnote 12
 $$ {c}^{\ast}\left(\lambda, \theta \right)=\underset{c}{\arg \hskip0.3em \max}\left\{{V}^S\left({x}_0;\lambda, \theta \right)\right\}, $$
and examine how investment thresholds behave as functions of
 $ \lambda $
and
 $ \theta $
when
 $ {c}^{\ast}\left(\lambda, \theta \right) $
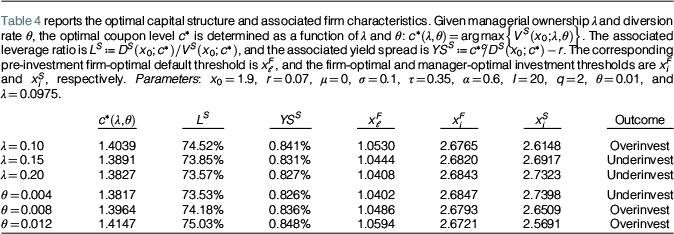
endogenously adjust. Table 4 presents the evolution of leverage ratios, yield spreads, and investment thresholds at the optimal capital structure across different values of
 $ \lambda $
and
 $ \theta $
. The results suggest that as
 $ \lambda $
increases and thus the cost-sharing effect gets stronger, the needed debt to balance investment efficiency decreases, leading to a lower optimal coupon level and the resulting leverage ratio and yield spread. Conversely, as
 $ \theta $
rises, more debt is necessary to mitigate the increased overinvestment incentives, so the optimal coupon level and the associated leverage ratio and yield spread increase accordingly.
Table 4 reports the optimal capital structure and associated firm characteristics. Given managerial ownership
 $ \lambda $
and diversion rate
 $ \theta $
, the optimal coupon level
 $ {c}^{\ast } $
is determined as a function of
 $ \lambda $
and
 $ \theta $
:
 $ {c}^{\ast}\left(\lambda, \theta \right)=\underset{c}{\arg \max}\left\{{V}^S\left({x}_0;\lambda, \theta \right)\right\} $
. The associated leverage ratio is
 $ {L}^S:= {D}^S\left({x}_0;{c}^{\ast}\right)/{V}^S\left({x}_0;{c}^{\ast}\right) $
, and the associated yield spread is
 $ {YS}^S:= {c}^{\ast }/{D}^S\left({x}_0;{c}^{\ast}\right)-r $
. The corresponding pre-investment firm-optimal default threshold is
 $ {x}_{\mathrm{\ell}}^F $
, and the firm-optimal and manager-optimal investment thresholds are
 $ {x}_i^F $
and
 $ {x}_i^S $
, respectively. Parameters:
 $ {x}_0=1.9 $
,
 $ r=0.07 $
,
 $ \mu =0 $
,
 $ \sigma =0.1 $
,
 $ \tau =0.35 $
,
 $ \alpha =0.6 $
,
 $ I=20 $
,
 $ q=2 $
,
 $ \theta =0.01 $
, and
 $ \lambda =\mathrm{0.0975.} $

Table 4 reveals some interesting patterns regarding the default and investment thresholds. First, as
 $ \lambda $
increases (and thus
 $ {c}^{\ast } $
decreases), the firm faces reduced default risk and can wait longer to invest, reflected by a lower
 $ {x}_{\mathrm{\ell}}^F $
and a higher
 $ {x}_i^F $
. Second, as
 $ \theta $
increases (and thus
 $ {c}^{\ast } $
increases), the default risk rises (higher
 $ {x}_{\mathrm{\ell}}^F $
), prompting the firm to invest earlier (lower
 $ {x}_i^F $
). Furthermore, it indicates that the manager-optimal investment threshold increases with
 $ \lambda $
but decreases with
 $ \theta $
. Recall that managerial ownership
 $ \lambda $
and resource diversion
 $ \theta $
influence investment decisions through the critical factor
 $ \frac{\lambda }{\theta +\lambda \left(1-\theta \right)} $
, as shown in equation (5). This ratio captures the trade-off between the cost-sharing effect and the diversion effect. As
 $ \lambda $
rises, the ratio increases, implying that the cost-sharing effect dominates (higher
 $ {x}_i^S $
) and the firm tends to underinvest. Conversely, as
 $ \theta $
rises, the ratio decreases, which reflects that the diversion effect prevails (lower
 $ {x}_i^S $
) and the firm has a tendency toward overinvestment. Notably, when
 $ \lambda $
approaches
 $ 0 $
, the manager bears less of the investment cost and tends to invest immediately.Footnote 13 In this case, the substantive results regarding the effect of diversion rate presented in Table 4 still hold.
We next study the symmetric counterpart of problem (10) to solve for the optimal managerial ownership (
 $ {\lambda}^{\ast } $
) given a coupon level (
 $ c $
) and diversion rate (
 $ \theta $
):
 $$ {\lambda}^{\ast}\left(c,\theta \right)=\underset{\lambda }{\arg \hskip0.3em \max}\left\{{V}^S\left({x}_0;c,\theta \right)\right\}. $$
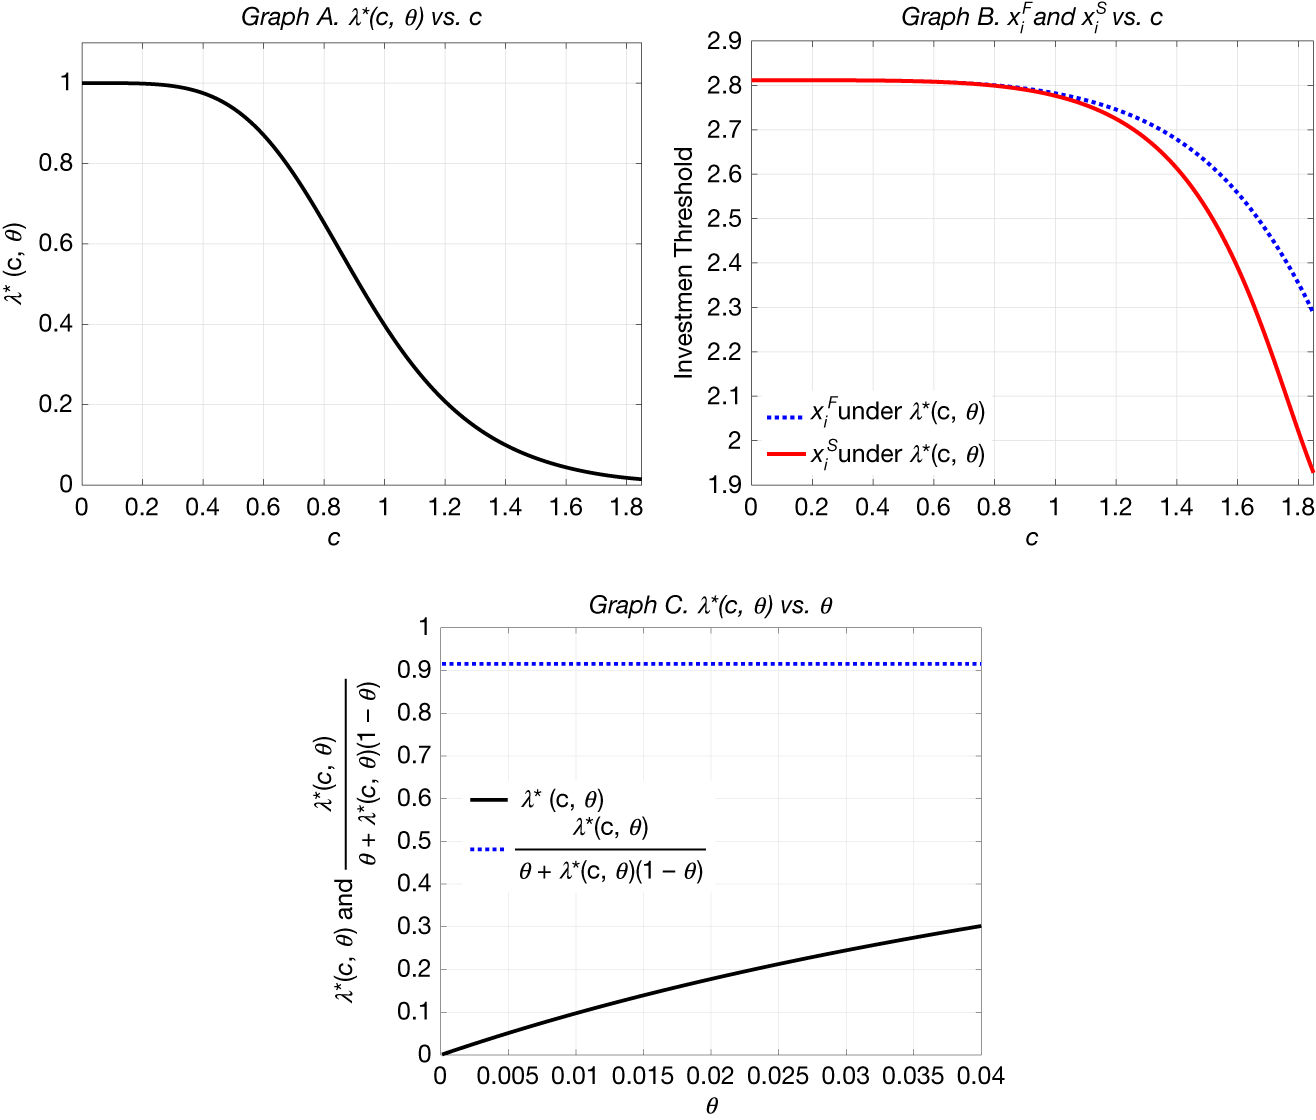
Figure 8 illustrates the optimal ownership, investment thresholds, and key ratio,
 $ \frac{\lambda^{\ast }}{\theta +{\lambda}^{\ast}\left(1-\theta \right)} $
, as
 $ c $
or
 $ \theta $
varies. First, note that when
 $ c=0 $
, the model reduces to the pure-equity benchmark, where
 $ {\lambda}^{\ast }=1 $
and
 $ {x}_i^F={x}_i^S $
. As debt increases and the debt overhang effect gets stronger, the required cost-sharing effect to balance investment efficiency decreases, as reflected by a lower
 $ {\lambda}^{\ast } $
in Graph A. Graph B shows that the firm-optimal investment threshold
 $ {x}_i^F $
decreases due to the increased default risk. With a reduced
 $ {\lambda}^{\ast } $
as
 $ c $
rises, the ratio
 $ \frac{\lambda^{\ast }}{\theta +{\lambda}^{\ast}\left(1-\theta \right)} $
decreases, implying the diversion effect dominates (lower
 $ {x}_i^S $
) and the firm tends to overinvest. Finally, as
 $ \theta $
rises, the optimal ownership also increases to mitigate the increased diversion effect, as depicted in Graph C. Accordingly, the equilibrium key ratio
 $ \frac{\lambda^{\ast}\left(c,\theta \right)}{\theta +{\lambda}^{\ast}\left(c,\theta \right)\left(1-\theta \right)} $
, which captures the manager’s trade-off between investment cost and cash flow revenue, remains unchanged as
 $ \theta $
varies. As a result, the investment and default thresholds also stay constant, as evidenced by equations (A.5), (A.6), and (A.7).
In Figure 8, given coupon level
 $ c $
and diversion rate
 $ \theta $
, the optimal managerial ownership level
 $ {\lambda}^{\ast } $
is determined as a function of
 $ c $
and
 $ \theta $
:
 $ {\lambda}^{\ast}\left(c,\theta \right)=\underset{\lambda }{\arg \max}\left\{{V}^S\left({x}_0;c,\theta \right)\right\} $
. The corresponding firm-optimal and manager-optimal investment thresholds are
 $ {x}_i^F $
and
 $ {x}_i^S $
, respectively. The ratio
 $ \frac{\lambda^{\ast}\left(c,\theta \right)}{\theta +{\lambda}^{\ast}\left(c,\theta \right)\left(1-\theta \right)} $
in Graph C remains constant across various
 $ \theta $
. Parameters:
 $ {x}_0=1.9 $
,
 $ r=0.07 $
,
 $ \mu =0 $
,
 $ \sigma =0.1 $
,
 $ \tau =0.35 $
,
 $ \alpha =0.6 $
,
 $ I=20 $
,
 $ q=2 $
,
 $ \theta =0.01 $
, and
 $ c=1.4051 $
.

D. Investment Efficiency Versus Ownership and Capital Structure
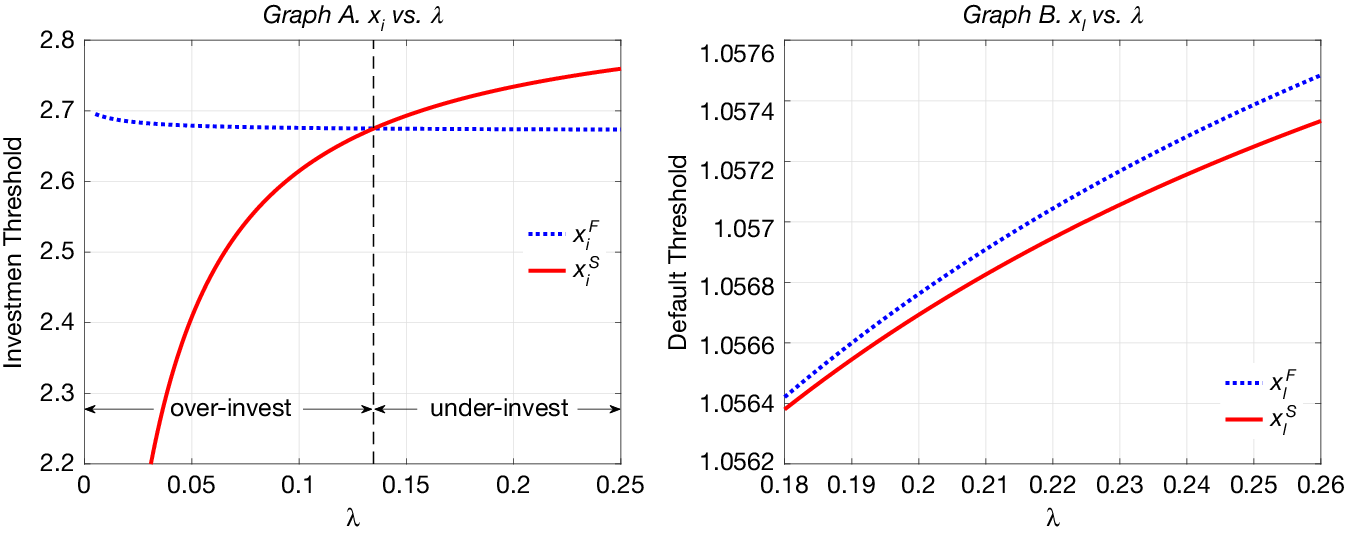
This subsection assumes that the firm has no flexibility in choosing its ownership or capital structure, and examines how investment efficiency responds to exogenous changes in
 $ \lambda $
or
 $ c $
. Recall that the manager’s equity ownership
 $ \lambda $
affects investment decisions through two effects: cost-sharing and diversion. These effects are captured separately by
 $ \lambda $
and
 $ \theta +\lambda \left(1-\theta \right) $
, with their ratio
 $ \frac{\lambda }{\theta +\lambda \left(1-\theta \right)} $
being the key factor, as shown in the case of the pure-equity firm in Section III.A. When
 $ \lambda $
increases, both terms increase, but the cost-sharing effect dominates since the ratio
 $ \frac{\lambda }{\theta +\lambda \left(1-\theta \right)} $
increases with
 $ \lambda $
. This explains why the manager-optimal investment threshold
 $ {x}_i^S $
increases with
 $ \lambda $
, as shown in Graph A of Figure 9. In contrast, the firm-optimal investment threshold
 $ {x}_i^F $
decreases with
 $ \lambda $
. Note that a stronger cost-sharing effect caused by increased
 $ \lambda $
reduces the attractiveness of investment to the manager, which reduces his opportunity cost of pre-investment default and thereby incentivizes earlier default, as confirmed by Graph B. Therefore, it is optimal for the firm to exercise the investment option earlier. These patterns imply that there is underinvestment when
 $ \lambda $
is high and overinvestment when
 $ \lambda $
is low.
Figure 9 Graph A highlights an intersection point between
 $ {x}_i^S $
and
 $ {x}_i^F $
. Parameters:
 $ r=0.07 $
,
 $ \mu =0 $
,
 $ \sigma =0.1 $
,
 $ \tau =0.35 $
,
 $ \alpha =0.6 $
,
 $ I=20 $
,
 $ q=2 $
,
 $ \theta =0.01 $
, and
 $ {c}^{\ast }=1.4051 $
.

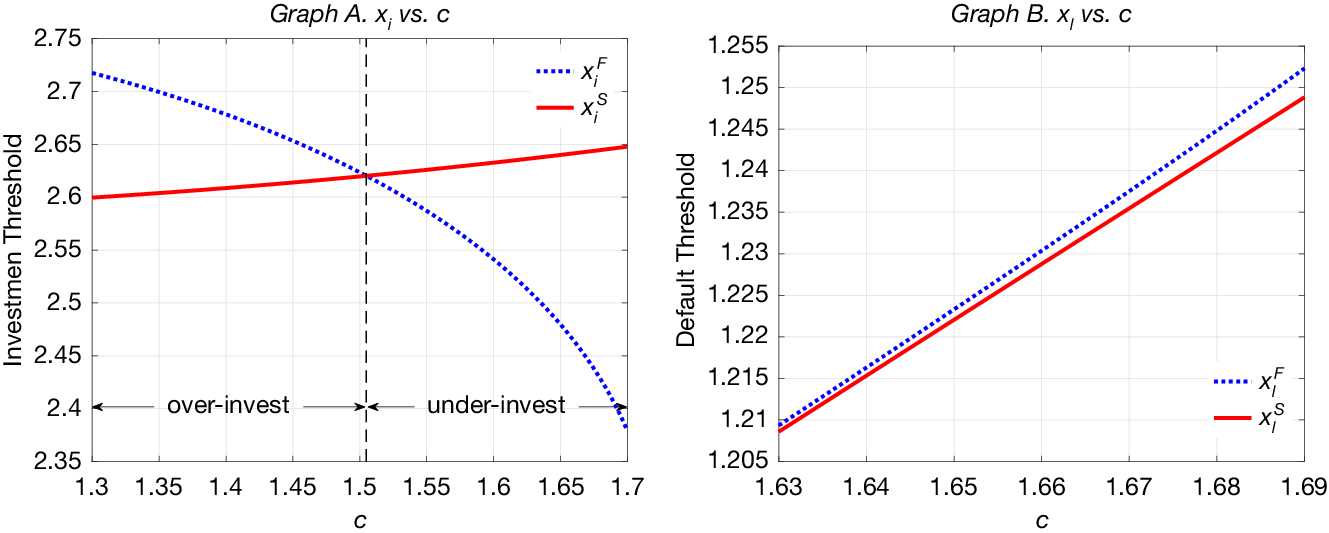
Turning to the effect of the coupon payment
 $ c $
, Figure 10 illustrates how the coupon payment
 $ c $
affects investment and default decisions. A higher coupon payment
 $ c $
increases the debt overhang effect, so that the manager finds it optimal to delay investment. This is reflected by the higher manager-optimal investment threshold in Graph A. A larger debt burden also induces earlier default, as confirmed by the higher default thresholds in Graph B. Given that firms default earlier under higher coupon payments, the firm-optimal strategy is to exercise the investment option earlier, which explains why the firm-optimal investment threshold decreases with
 $ c $
in Graph A. These patterns imply that there is underinvestment when
 $ c $
is high and overinvestment when
 $ c $
is low.
Figure 10 Graph A highlights an intersection point between
 $ {x}_i^S $
and
 $ {x}_i^F $
. Parameters:
 $ r=0.07 $
,
 $ \mu =0 $
,
 $ \sigma =0.1 $
,
 $ \tau =0.35 $
,
 $ \alpha =0.6 $
,
 $ I=20 $
,
 $ q=2 $
,
 $ \theta =0.01 $
, and
 $ {\lambda}^{\ast }=0.0975 $
.

1. Investment Efficiency
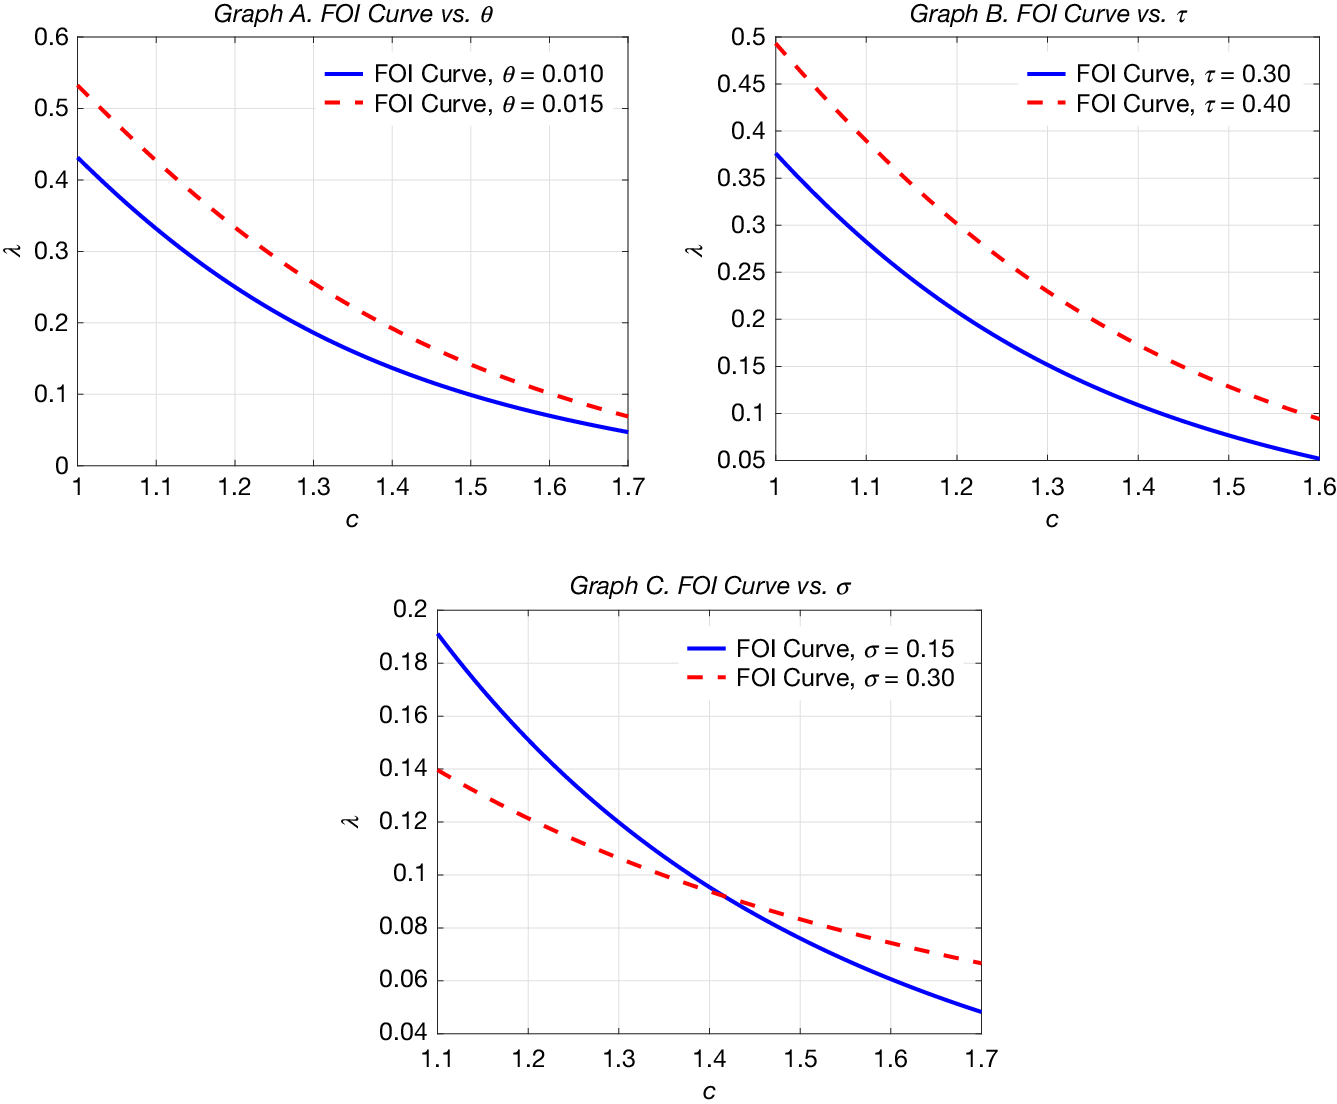
Previous figures have shown that firm-optimal and manager-optimal investment thresholds can coincide so that underinvestment and overinvestment effects exactly offset each other. In this case, the investment policy is efficient. Figure 11 plots the combinations of ownership (
 $ \lambda $
) and capital structure (
 $ c $
) that achieve this efficiency, which is referred to as the Firm-Optimal Investment (FOI) curve. Several interesting patterns emerge. First, there exists a negative relationship between
 $ c $
and
 $ \lambda $
along the efficiency curve. This substitutability arises because both debt overhang and cost-sharing effects contribute to underinvestment. Second, the curve shifts upward with the diversion rate
 $ \theta $
, as higher diversion increases incentives for overinvestment. For any given
 $ c $
, a higher
 $ \lambda $
is needed to curb the overinvestment incentives. Similarly, the curve shifts upward with tax rate
 $ \tau $
because higher default thresholds reduce the market value of debt and weaken the debt overhang effect. For a given
 $ \lambda $
, a higher
 $ c $
is needed to curb overinvestment. Interestingly, Graph C shows that the substitutability between
 $ c $
and
 $ \lambda $
decreases with volatility (
 $ \sigma $
). This occurs because higher
 $ \sigma $
, by reducing the market value of debt, reduces the incremental debt overhang effect from an increase in
 $ c $
, requiring a smaller reduction in
 $ \lambda $
to maintain investment efficiency.
In Figure 11, combination
 $ \left\{c,\lambda \right\} $
on each curve achieves the firm-optimal investment (FOI). Parameters:
 $ r=0.07 $
,
 $ \mu =0 $
,
 $ \sigma =0.1 $
,
 $ \tau =0.35 $
,
 $ \alpha =0.6 $
,
 $ I=20 $
,
 $ q=2 $
, and
 $ \theta =0.01 $
.

2. Measuring Efficiency Loss in Investment
Recall that
 $ {V}^F $
and
 $ {V}^S $
are the initial firm values under firm-optimal and manager-optimal investment policies, respectively. We measure agency cost as the percentage efficiency loss in initial firm value due to suboptimal investment policies (i.e.,
 $ \left({V}^F-{V}^S\right)/{V}^F $
). Under
 $ \left\{{c}^{\ast },{\lambda}^{\ast}\right\} $
and other parameters in Table 1, agency costs are
 $ 0.02\% $
. This is lower than
 $ 0.07\% $
in the levered benchmark, where
 $ \theta =0 $
or
 $ \lambda =1 $
, and considerably lower than
 $ 0.90\% $
reported by Mauer and Ott (Reference Mauer, Ott, Brennan and Trigeorgis2000) and
 $ 0.61\% $
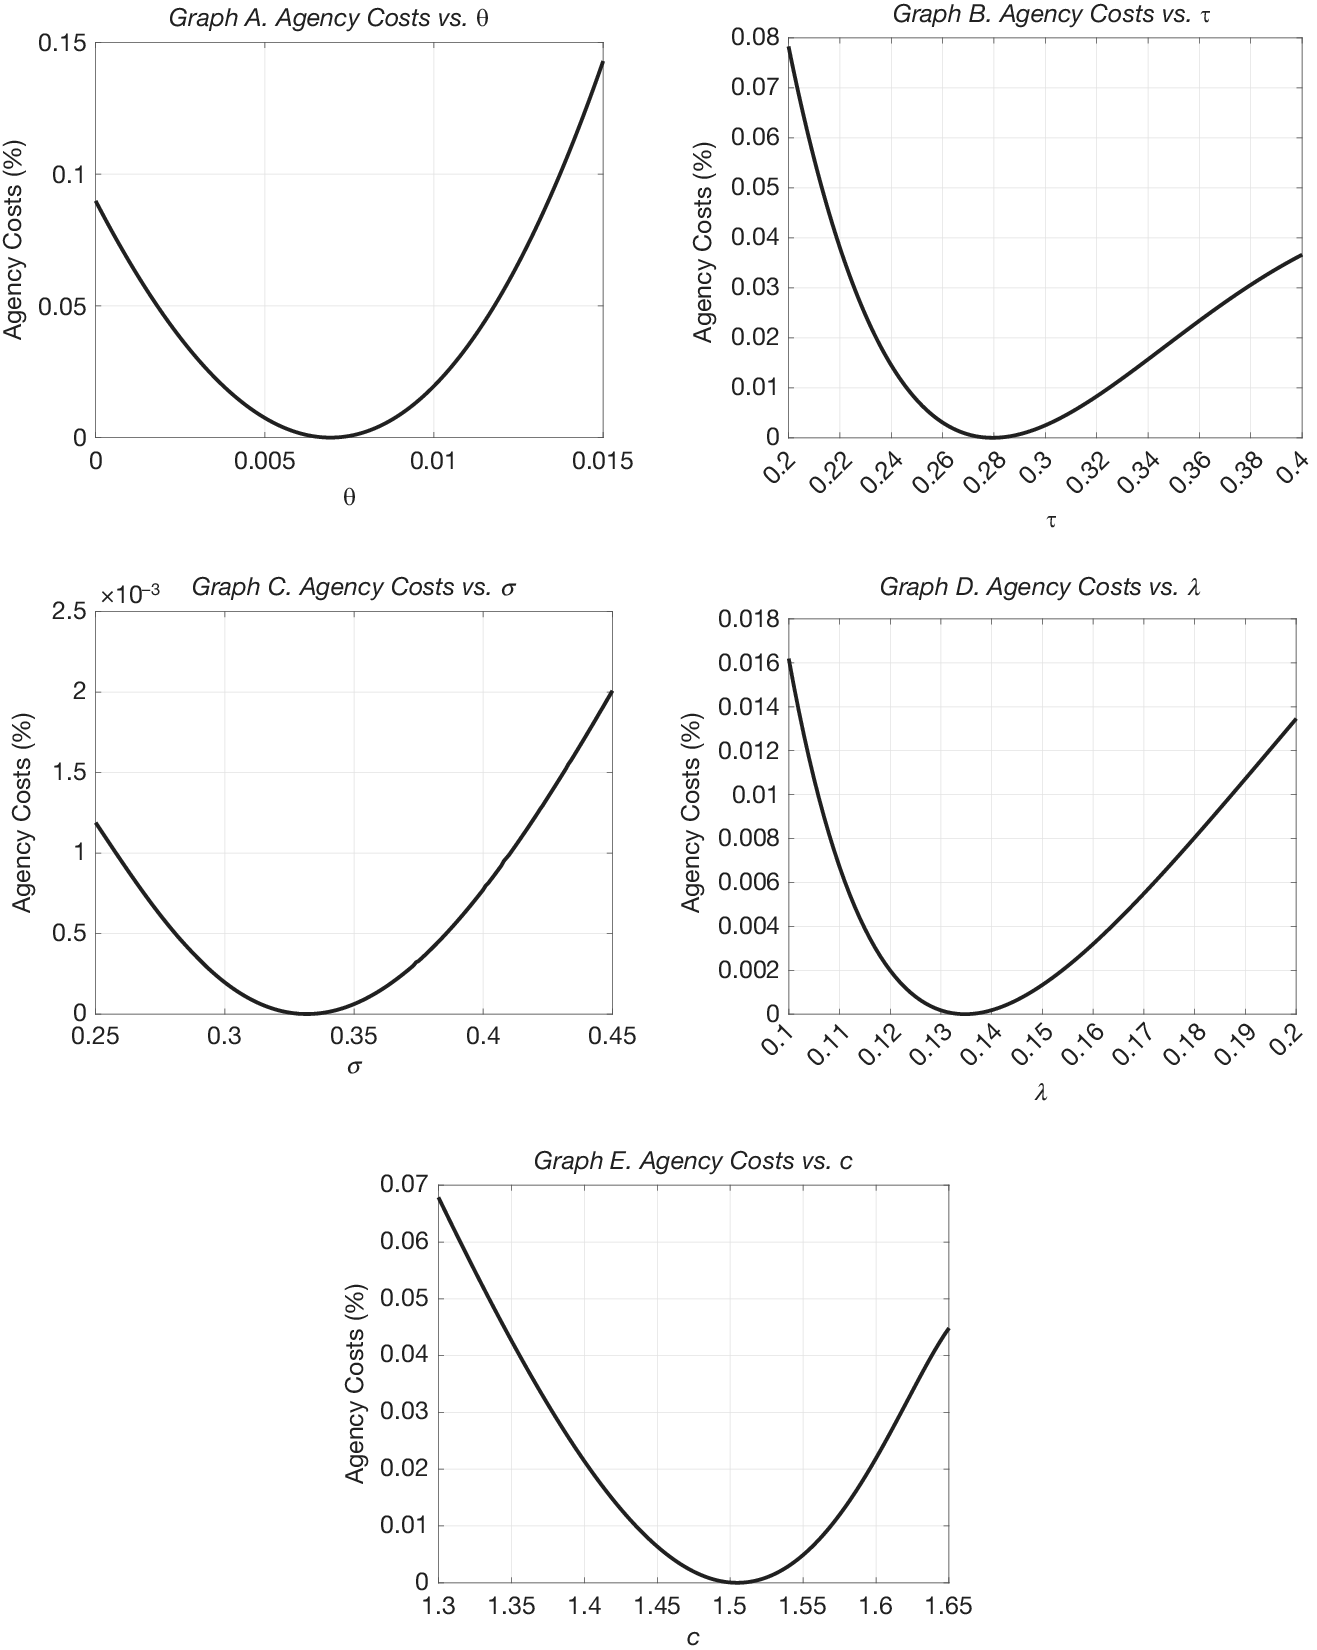
by Hackbarth and Mauer (Reference Hackbarth and Mauer2012). The relatively low agency costs in our model arise because the diversion effect introduces overinvestment incentives, which partially offset the debt overhang effect. Figure 12 illustrates how agency costs vary with parameters
 $ \left\{\theta, \tau, \sigma, \lambda, c\right\} $
. All graphs exhibit U-shaped patterns with a minimum value of 0.
In Figure 12, agency costs are the efficiency loss in initial firm value, measured as
 $ \left({V}^F-{V}^S\right)/{V}^F $
and expressed in percentage (%). The five graphs respectively vary i) diversion rate, ii) tax rate, iii) volatility, iv) managerial ownership, and v) coupon payment, each exhibiting a U-shaped curve with a minimum value of 0. Parameters:
 $ {x}_0=1.9 $
,
 $ r=0.07 $
,
 $ \mu =0 $
,
 $ \sigma =0.1 $
,
 $ \tau =0.35 $
,
 $ \alpha =0.6 $
,
 $ I=20 $
,
 $ q=2 $
,
 $ \theta =0.01 $
,
 $ {c}^{\ast }=1.4051 $
, and
 $ {\lambda}^{\ast }=0.0975 $
.

V. Extension, Empirical Relevance, and Related Literature
A. Extension: Ownership-Dependent Resource Diversion
This section extends the model by assuming
 $ \theta $
is a decreasing function of
 $ \lambda $
.Footnote 14 This extension is motivated by the rationale that as
 $ \lambda $
increases, managers are less inclined to divert resources because they share with minority shareholders the loss in firm value as resources are diverted (see Jensen and Meckling (Reference Jensen and Meckling1976)).Footnote 15
Specifically, we assume
 $ \theta =f\left(\lambda \right) $
, satisfying
 $ {f}^{\prime}\left(\lambda \right)<0 $
,
 $ f(1)=0 $
, and
 $ f(0)=b $
, where
 $ b\in \left(0,1\right) $
stands for the maximum diversion rate. This formulation implies that when the manager retains all the equity, he has no incentive to divert. The derivative
 $ {f}^{\prime}\left(\lambda \right) $
reflects the sensitivity of the manager’s diversion rate to his equity stake. In the numerical analysis, we model
 $ f\left(\cdot \right) $
as an exponential function,Footnote 16 that is,
 $$ \theta =f\left(\lambda \right):= {\left(1-b\right)}^{\lambda }+b-1, $$
where
 $ b=0.01 $
. The solution steps remain unchanged.
Compared to the case of fixed diversion rate, when
 $ \theta $
decreases with
 $ \lambda $
, an increase in ownership has an additional effect of diminishing the diversion effect, which further reduces the manager’s incentives to overinvest. We can see this effect clearly in the case of a pure-equity firm. By substituting
 $ \theta =f\left(\lambda \right) $
into equation (5), we derive that
 $$ \frac{\mathrm{d}{\hat{x}}_i^S}{\mathrm{d}\lambda }=\left(\frac{f\left(\lambda \right)\overset{\mathrm{d}\mathrm{iminished}\ \mathrm{diversion}}{\overbrace{-\lambda \hskip0.1em \left(\hskip0.1em 1-\lambda \hskip0.1em \right){f}^{\prime}\left(\lambda \right)}}}{f\left(\lambda \right)+\lambda \left(1-f\left(\lambda \right)\right)}\right)\left(\frac{{\hat{x}}_i^S}{\lambda}\right)\ge 0. $$
The incremental delay in investment is captured by the additional positive term
 $ \left(-\lambda \left(1-\lambda \right){f}^{\prime}\left(\lambda \right)\right) $
in equation (11), which is equal to
 $ 0 $
in equation (6).
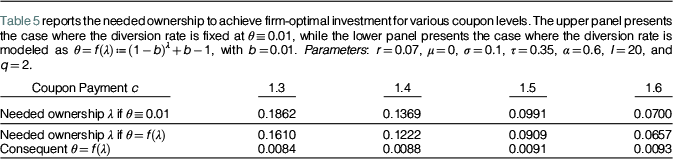
For a levered firm, the qualitative results continue to hold when the diversion rate depends on ownership. Table 5 further compares two scenarios: one where the diversion rate
 $ \theta $
is fixed, and another where
 $ \theta $
decreases as ownership
 $ \lambda $
increases. When
 $ \theta $
decreases with ownership, we find that a lower ownership stake
 $ \lambda $
is needed to achieve the firm-optimal investment level compared to the case of fixed
 $ \theta $
. Moreover, this difference in needed ownership levels becomes less pronounced as coupon payment
 $ c $
increases.
Table 5 reports the needed ownership to achieve firm-optimal investment for various coupon levels. The upper panel presents the case where the diversion rate is fixed at
 $ \theta \equiv 0.01 $
, while the lower panel presents the case where the diversion rate is modeled as
 $ \theta =f\left(\lambda \right):= {\left(1-b\right)}^{\lambda }+b-1 $
, with
 $ b=0.01 $
. Parameters:
 $ r=0.07 $
,
 $ \mu =0 $
,
 $ \sigma =0.1 $
,
 $ \tau =0.35 $
,
 $ \alpha =0.6 $
,
 $ I=20 $
, and
 $ q=2. $

Finally, the diminished diversion effect due to higher ownership contributes to the increase in firm value. We can see this effect from the pure-equity case. By equations (5) and (A.3), and applying
 $ \theta =f\left(\lambda \right) $
, we derive that
 $$ \frac{\mathrm{d}{\hat{V}}^S\left({x}_0;\lambda \right)}{\mathrm{d}\lambda }=\left(I{\gamma}_{+}\right)\left(\frac{1-\lambda }{\lambda}\right)\left(\frac{{\left[f\left(\lambda \right)\right]}^2\hskip0.1em \overset{\mathrm{d}\mathrm{iminished}\ \mathrm{diversion}}{\overbrace{-\lambda \left(1-\lambda \right){f}^{\prime}\left(\lambda \right)f\left(\lambda \right)}}}{{\left[f\left(\lambda \right)+\lambda \left(1-f\left(\lambda \right)\right)\right]}^2}\right){\left(\frac{x_0}{{\hat{x}}_i^S}\right)}^{\gamma_{+}}\ge 0. $$
The additional positive term
 $ \left(-\lambda \left(1-\lambda \right){f}^{\prime}\left(\lambda \right)f\left(\lambda \right)\right) $
in equation (12) reflects the incremental firm value from the reduced diversion effect as
 $ \lambda $
increases, which equals
 $ 0 $
in equation (7).
B. Empirical Relevance
Our model integrates two types of conflicts, which allows us to identify the diversion effect and cost-sharing effect that impact investment efficiency alongside the debt overhang effect. We show that the diversion effect incentivizes overinvestment, while the cost-sharing effect more closely aligns managerial incentives with firm interests, thereby reducing the tendency to overinvestment. These findings are consistent with Morck et al. (Reference Morck, Shleifer and Vishny1989), who assert that there is a natural tendency for the manager to allocate company resources in ways that maximize his own interests, often conflicting with the interests of external shareholders. Moreover, their empirical research indicates that granting a certain level of equity to the manager can effectively mitigate this conflict of interest.
We have demonstrated that higher managerial ownership mitigates overinvestment in a pure-equity firm. This result is supported by empirical evidence indicating that pure-equity family firms are generally reluctant to get access to external equity financing, as reported in Romano et al. (Reference Romano, Tanewski and Smyrnios2001), Blanco-Mazagatos, De Quevedo-Puente, and Castrillo (Reference Blanco-Mazagatos, De Quevedo-Puente and Castrillo2007), Wu et al. (Reference Wu, Chua and Chrisman2007), and Croci, Doukas, and Gonenc (Reference Croci, Doukas and Gonenc2011). Further, we have shown that in a levered firm, there is underinvestment when
 $ \lambda $
is high and overinvestment when
 $ \lambda $
is low. This finding is consistent with Hermalin and Weisbach (Reference Hermalin and Weisbach1991), Griffith (Reference Griffith1999), and Davies, Hillier, and McColgan (Reference Davies, Hillier and McColgan2005), who provide empirical evidence of a significant nonlinear relationship between corporate value and managerial ownership, which is also supported by Morck et al. (Reference Morck, Shleifer and Vishny1988) and McConnell and Servaes (Reference McConnell and Servaes1990), who document an inverted U-shaped relationship between firm performance and insider ownership, as illustrated in Graph B of Figure 3.
Our model generates several new testable predictions. First, we have shown how agency conflicts and market conditions, described by the parameters
 $ \left\{\theta, \tau, \sigma, \lambda, c\right\} $
, affect investment timing and agency costs. Second, we provide predictions on how ownership structure and capital structure vary with firm characteristics and the institutional environment represented by
 $ \left\{\theta, \tau, \sigma \right\} $
.
C. Relation to the Literature
Our model builds upon the growth option framework of Mauer and Ott (Reference Mauer, Ott, Brennan and Trigeorgis2000) and Hackbarth and Mauer (Reference Hackbarth and Mauer2012), who emphasize the underinvestment problem and the agency costs of debt. Beyond the traditional trade-off between tax benefits and bankruptcy costs (see Leland (Reference Leland1994)), we enhance their framework by incorporating the manager’s private benefits and show how different forces interact and shape the firm’s investment and financing policies.
Our work extends existing work on agency frictions (see, e.g., Jensen and Meckling (Reference Jensen and Meckling1976), Jensen (Reference Jensen1986), Stulz (Reference Stulz1990), and Morellec (Reference Morellec2004)). Jensen and Meckling (Reference Jensen and Meckling1976) suggest that increasing managerial ownership can align the interests of managers and shareholders, thereby reducing agency costs. Jensen (Reference Jensen1986) argues that debt can mitigate the agency costs of free cash flow by limiting the cash flow available for managerial discretion. In a two-period model, Stulz (Reference Stulz1990) examines how optimal financing policies can mitigate agency frictions and investment inefficiencies. The friction in Stulz (Reference Stulz1990) is the managers’ free cash flow problem, where managers may invest in negative-NPV projects to derive perquisites from investment. In that model, shareholders cannot observe cash flows or investment decisions; therefore, managers tend to overinvest. Debt serves as a useful tool to force managers to pay out cash and curb incentives for overinvestment. However, this hard-claim nature of debt can lead to underinvestment when the realized cash flows are low. Morellec (Reference Morellec2004) further extends Stulz (Reference Stulz1990) to a continuous-time framework. In his model, the manager tends to overinvest in negative-NPV projects due to his ability to derive utility from investment. He then shows how debt financing can mitigate managerial diversion by restricting free cash flow.
Our framework differs in several key ways. Unlike Stulz (Reference Stulz1990), there is no asymmetric information in our model. Most fundamentally, Jensen (Reference Jensen1986), Stulz (Reference Stulz1990), and Morellec (Reference Morellec2004) all focus on managers’ free cash flow problem, where managers may invest in negative-NPV projects; however, our model has no free cash flow problem since investments always have positive NPV and the manager (along with equity holders) has deep pockets, following the standard approach as in the Leland (Reference Leland1994) model. In our model, overinvestment incentives arise from managers’ ability to divert cash flows, and firms issue debt to exploit the tax shield benefit of debt.Footnote 17 Indeed, we show that when the tax rate is 0, the firm optimally never issues any debt.
Moreover, the dynamic nature of our model reveals important interactions between investment and default decisions that are absent from the Stulz’s (Reference Stulz1990) static framework. Specifically, the uncertain timing between investment and default highlights how investment options influence default incentives, similar to the results in Mauer and Ott (Reference Mauer, Ott, Brennan and Trigeorgis2000) and Hackbarth and Mauer (Reference Hackbarth and Mauer2012). For instance, we find that the post-investment default threshold is independent of agency frictions (
 $ \theta $
,
 $ \lambda $
) and tax shield benefits (
 $ \tau $
). However, the pre-investment default threshold varies with these parameters, highlighting how investment options interact with default incentives and agency friction severity.
Our dynamic model also generates different predictions from Stulz (Reference Stulz1990) regarding the effects of cash flow volatility. While Stulz (Reference Stulz1990) finds that higher volatility universally reduces firm value across debt levels, our model, consistent with Dixit and Pindyck (Reference Dixit and Pindyck1994), shows that increased volatility can enhance the value of investment options and potentially increase firm value. As shown in Figure 6, higher volatility mitigates underinvestment but exacerbates overinvestment.
Morellec et al. (Reference Morellec, Nikolov and Schürhoff2012), (Reference Morellec, Nikolov and Schürhoff2018) study the impact of managerial diversion on leverage decisions. Our work has a different focus: we study how joint ownership and capital structure decisions interact to mitigate and eliminate investment inefficiency associated with the timing of investment. Kanagaretnam and Sarkar (Reference Kanagaretnam and Sarkar2011) study how managerial ownership addresses underinvestment in a growth option model, but there is no incentive for overinvestment, and they do not study optimal financing structures.
VI. Conclusion
This article analyzes investment and financing decisions through a continuous-time model that considers both owner–manager and shareholder–creditor conflicts. We study how agency conflicts interact with investment, ownership, and capital structure using analytical and numerical approaches. Our analysis reveals three key forces shaping firm investment: diversion, cost-sharing, and debt overhang. The interplay of these forces can potentially lead firms to achieve firm-optimal investment policies. Our findings show that agency costs have U-shaped relationships with the diversion rate, tax rate, volatility, managerial ownership, and coupon payment. The combination of ownership and capital structure choices can reduce or eliminate agency costs. We reveal how agency conflicts, tax benefits, and bankruptcy costs interact to shape optimal ownership and capital structure, providing explanations for several documented empirical results.
For model simplicity, we only allow the manager to choose capital and ownership structure at
 $ t=0 $
. Recent studies (see DeMarzo and He (Reference DeMarzo and He2021), Hu, Varas, and Ying (Reference Hu, Varas and Ying2021), and Benzoni, Garlappi, Goldstein, and Ying (Reference Benzoni, Garlappi, Goldstein and Ying2022)) have explored dynamic capital and debt structures with flexible debt issuance and varying maturities. Additionally, real-world debt renegotiation often mitigates debt overhang concerns. Future research could extend our model to incorporate these dynamic elements.
Appendix. Derivations
A.1 Method of Pricing Corporate Securities
Following the general method of pricing corporate securities summarized in Tan and Yang (Reference Tan and Yang2017), here we present a sketch of deriving the manager’s continuation value before investment
 $ \hat{W}\left({X}_t\right) $
in a pure-equity firm. The value functions of all other securities can be obtained similarly.
Given the investment threshold
 $ {\hat{x}}_i $
, the manager’s continuation value before investment is
 $$ \hat{W}(x)=\unicode{x1D53C}\left[{\int}_0^{\overline{T}\left({\hat{x}}_i\right)}{e}^{- rt}\left(\theta +\lambda \left(1-\theta \right)\right)\left(1-\tau \right){X}_t\mathrm{d}t+{e}^{-r\overline{T}\left({\hat{x}}_i\right)}\left[{\hat{W}}_q\left({\hat{x}}_i\right)-\lambda I\right]\right], $$
where
 $ \overline{T}\left({\hat{x}}_i\right):= \operatorname{inf}\left\{t\ge 0:{X}_t\ge {\hat{x}}_i\right\} $
. By the dynamic programming method,
 $ \hat{W}(x) $
satisfies the following ordinary differential equation
 $$ r\hat{W}(x)=\left(\theta +\lambda \left(1-\theta \right)\right)\left(1-\tau \right)x+\mu x\frac{\partial \hat{W}(x)}{\partial x}+\frac{1}{2}{\sigma}^2{x}^2\frac{\partial^2\hat{W}(x)}{\partial {x}^2}, $$
the general solution to which is of the form
 $$ \hat{W}(x)=\left(\theta +\lambda \left(1-\theta \right)\right)\left(\frac{1-\tau }{r-\mu}\right)x+{B}_1{(x)}^{\gamma_{-}}+{B}_2{(x)}^{\gamma_{+}},\hskip2.1em \mathrm{for}\hskip0.22em 0<x<{\hat{x}}_i, $$
where
 $ {B}_1 $
and
 $ {B}_2 $
are constants to be determined, and
 $ {\gamma}_{+} $
(
 $ {\gamma}_{-} $
) is the positive (negative) root of equation
 $ \frac{1}{2}{\sigma}^2\gamma \left(\gamma -1\right)+\mu \gamma -r=0 $
, given by
 $$ {\gamma}_{+}:= \frac{1}{2}-\frac{\mu }{\sigma^2}+\sqrt{{\left(\frac{1}{2}-\frac{\mu }{\sigma^2}\right)}^2+\frac{2r}{\sigma^2}}>1,\hskip1em {\gamma}_{-}:= \frac{1}{2}-\frac{\mu }{\sigma^2}-\sqrt{{\left(\frac{1}{2}-\frac{\mu }{\sigma^2}\right)}^2+\frac{2r}{\sigma^2}}<0. $$
The equation (A.1) for
 $ \hat{W}(x) $
is subject to the boundary condition
 $$ \hat{W}\left({\hat{x}}_i\right)={\hat{W}}_q\left({\hat{x}}_i\right)-\lambda I, $$
in addition to
 $ {B}_1=0 $
due to
 $ {\gamma}_{-}<0 $
and finite valuation. Then we can solve the value of
 $ {B}_2 $
and thus derive the value function
 $ \hat{W}(x) $
, given by
 $$ \hat{W}(x)=\left(\theta +\lambda \left(1-\theta \right)\right)\left(\frac{1-\tau }{r-\mu}\right)x+\left[{\hat{W}}_q\left({\hat{x}}_i\right)-\lambda I-\left(\theta +\lambda \left(1-\theta \right)\right)\left(\frac{1-\tau }{r-\mu}\right){\hat{x}}_i\right]{\left(\frac{x}{{\hat{x}}_i}\right)}^{\gamma_{+}}. $$
A.2 Solution to a Pure-Equity Firm
We employ a backward induction method. After investment, the manager’s cash flow is
 $ \left(\theta +\lambda \left(1-\theta \right)\right)\left(1-\tau \right){qX}_t $
, including private benefits
 $ \theta \left(1-\tau \right){qX}_t $
from diversion and equity stake
 $ \lambda \left(1-\theta \right)\left(1-\tau \right){qX}_t $
. Minority shareholders’ cash flow is
 $ \left(1-\lambda \right)\left(1-\theta \right)\left(1-\tau \right){qX}_t $
. Hence, after investment, the manager’s value is
 $$ {\hat{W}}_q(x)=\unicode{x1D53C}\left[{\int}_0^{+\infty }{e}^{- rt}\left(\theta +\lambda \left(1-\theta \right)\right)\left(1-\tau \right){qX}_t\mathrm{d}t\right]=\left(\theta +\lambda \left(1-\theta \right)\right)\left(\frac{1-\tau }{r-\mu}\right) qx, $$
and minority shareholders’ value is
 $$ {\hat{J}}_q(x)=\unicode{x1D53C}\left[{\int}_0^{+\infty }{e}^{- rt}\left(1-\lambda \right)\left(1-\theta \right)\left(1-\tau \right){qX}_t\mathrm{d}t\right]=\left(1-\lambda \right)\left(1-\theta \right)\left(\frac{1-\tau }{r-\mu}\right) qx. $$
Firm value after investment equals the sum of
 $ {\hat{W}}_q(x) $
and
 $ {\hat{J}}_q(x) $
, given by
 $$ {\hat{V}}_q(x)=\unicode{x1D53C}\left[{\int}_0^{+\infty }{e}^{- rt}\left(1-\tau \right){qX}_t\mathrm{d}t\right]=\left(\frac{1-\tau }{r-\mu}\right) qx. $$
Before investment, the instantaneous cash flows to the manager and minority shareholders are
 $ \left(\theta +\lambda \left(1-\theta \right)\right)\left(1-\tau \right){X}_t $
and
 $ \left(1-\lambda \right)\left(1-\theta \right)\left(1-\tau \right){X}_t $
, respectively. Once the cash flow hits the investment threshold
 $ {\hat{x}}_i $
from below, the firm exercises its investment option, with the manager paying a fraction of the sunk cost
 $ \lambda I $
and minority shareholders paying the remaining portion
 $ \left(1-\lambda \right)I $
. Therefore, the manager’s value before investment is
 $$ {\displaystyle \begin{array}{c}\hat{W}(x)=\unicode{x1D53C}\left[{\int}_0^{\overline{T}\left({x}_i\right)}{e}^{- rt}\left(\theta +\lambda \left(1-\theta \right)\right)\left(1-\tau \right){X}_t\mathrm{d}t+{e}^{-r\overline{T}\left({\hat{x}}_i\right)}\left[{\hat{W}}_q\left({\hat{x}}_i\right)-\lambda I\right]\right]\\ {}=\left(\theta +\lambda \left(1-\theta \right)\right)\left(\frac{1-\tau }{r-\mu}\right)x+\left[{\hat{W}}_q\left({\hat{x}}_i\right)-\lambda I-\left(\theta +\lambda \left(1-\theta \right)\right)\left(\frac{1-\tau }{r-\mu}\right){\hat{x}}_i\right]{\left(\frac{x}{{\hat{x}}_i}\right)}^{\gamma_{+}}.\end{array}} $$
In the same way, minority shareholders’ value is
 $$ {\displaystyle \begin{array}{c}\hat{J}(x)=\unicode{x1D53C}\left[{\int}_0^{\overline{T}\left({\hat{x}}_i\right)}{e}^{- rt}\left(1-\lambda \right)\left(1-\theta \right)\left(1-\tau \right){X}_t\mathrm{d}t+{e}^{-r\overline{T}\left({\hat{x}}_i\right)}\left[{\hat{J}}_q\left({\hat{x}}_i\right)-\left(1-\lambda \right)I\right]\right]\\ {}=\left(1-\lambda \right)\left(1-\theta \right)\left(\frac{1-\tau }{r-\mu}\right)x+\left[{\hat{J}}_q\left({\hat{x}}_i\right)-\left(1-\lambda \right)I-\left(1-\lambda \right)\left(1-\theta \right)\left(\frac{1-\tau }{r-\mu}\right){\hat{x}}_i\right]{\left(\frac{x}{{\hat{x}}_i}\right)}^{\gamma_{+}},\end{array}} $$
and firm value is
 $$ {\displaystyle \begin{array}{c}\hat{V}(x)=\unicode{x1D53C}\left[{\int}_0^{\overline{T}\left({\hat{x}}_i\right)}{e}^{- rt}\left(1-\tau \right){X}_t\mathrm{d}t+{e}^{-r\overline{T}\left({\hat{x}}_i\right)}\left[{\hat{V}}_q\left({\hat{x}}_i\right)-I\right]\right]\\ {}=\left(\frac{1-\tau }{r-\mu}\right)x+\left[{\hat{V}}_q\left({\hat{x}}_i\right)-I-\left(\frac{1-\tau }{r-\mu}\right){\hat{x}}_i\right]{\left(\frac{x}{{\hat{x}}_i}\right)}^{\gamma_{+}}.\end{array}} $$
The smooth-pasting condition for manager-optimal investment threshold
 $ {\hat{x}}_i^S $
is
 $$ {\operatorname{}\frac{\mathrm{\partial}\hat{W}(x)}{\mathrm{\partial}x}|}_{x={\hat{x}}_i^S-}={\operatorname{}\frac{\mathrm{\partial}{\hat{W}}_q(x)}{\mathrm{\partial}x}|}_{x={\hat{x}}_i^S+}, $$
leading to
 $$ {\hat{x}}_i^S=\left(\frac{\lambda }{\theta +\lambda \left(1-\theta \right)}\right)\left(\frac{1}{q-1}\right)\left(\frac{r-\mu }{1-\tau}\right)\left(\frac{\gamma_{+}}{\gamma_{+}-1}\right)I. $$
Similarly, for firm-optimal investment threshold
 $ {\hat{x}}_i^F $
, we have
 $$ {\operatorname{}\frac{\mathrm{\partial}\hat{V}(x)}{\mathrm{\partial}x}|}_{x={\hat{x}}_i^F-}={\operatorname{}\frac{\mathrm{\partial}{\hat{V}}_q(x)}{\mathrm{\partial}x}|}_{x={\hat{x}}_i^F+}, $$
leading to
 $$ {\hat{x}}_i^F=\left(\frac{1}{q-1}\right)\left(\frac{r-\mu }{1-\tau}\right)\left(\frac{\gamma_{+}}{\gamma_{+}-1}\right)I. $$
A.3 Solution to a Levered Firm
We now consider a levered firm with an investment option. Debt provides tax shields but incurs financial distress costs. Once default occurs, the firm is directly liquidated, and the absolute priority rule applies. The manager has the right to make the investment and default policies.
After investment, if the cash flow decreases and hits the default boundary
 $ {x}_d $
from above, the firm chooses to go bankrupt. Upon liquidation, shareholders get nothing, and debtholders collect the liquidation value
 $ \left(1-\alpha \right)\left(\frac{1-\tau }{r-\mu}\right){qx}_d $
, equal to the recovery rate times the unlevered firm value. The cash flows to debtholders, the manager, and minority shareholders after investment but prior to bankruptcy are
 $ c $
,
 $ \left(\theta +\lambda \left(1-\theta \right)\right)\left(1-\tau \right)\left({qX}_t-c\right) $
, and
 $ \left(1-\lambda \right)\left(1-\theta \right)\left(1-\tau \right)\Big({qX}_t-c $
), respectively. Thus, after investment but before default, debt value is
 $$ {\displaystyle \begin{array}{c}{D}_q(x)=\unicode{x1D53C}\left[{\int}_0^{\underline{T}\left({x}_d\right)}{e}^{- rt}c\mathrm{d}t+{e}^{-r\underline{T}\left({x}_d\right)}\left(1-\alpha \right)\left(\frac{1-\tau }{r-\mu}\right){qx}_d\right]\\ {}=\frac{c}{r}+\left[\left(1-\alpha \right)\left(\frac{1-\tau }{r-\mu}\right){qx}_d-\frac{c}{r}\right]{\left(\frac{x}{x_d}\right)}^{\gamma_{-}},\end{array}} $$
where
 $ \underline{T}\left({x}_d\right):= \operatorname{inf}\left\{t\ge 0:{X}_t\le {x}_d\right\} $
. The manager’s value is
 $$ {\displaystyle \begin{array}{c}{W}_q(x)=\unicode{x1D53C}\left[{\int}_0^{\underline{T}\left({x}_d\right)}{e}^{- rt}\left(\theta +\lambda \left(1-\theta \right)\right)\left(1-\tau \right)\left({qX}_t-c\right)\mathrm{d}t\right]\\ {}=\left(\theta +\lambda \left(1-\theta \right)\right)\left(1-\tau \right)\left[\left(\frac{qx}{r-\mu }-\frac{c}{r}\right)-\left(\frac{qx_d}{r-\mu }-\frac{c}{r}\right){\left(\frac{x}{x_d}\right)}^{\gamma_{-}}\right].\end{array}} $$
Minority shareholders’ value is
 $$ {\displaystyle \begin{array}{c}{J}_q(x)=\unicode{x1D53C}\left[{\int}_0^{\underline{T}\left({x}_d\right)}{e}^{- rt}\left(1-\lambda \right)\left(1-\theta \right)\left(1-\tau \right)\left({qX}_t-c\right)\mathrm{d}t\right]\\ {}=\left(1-\lambda \right)\left(1-\theta \right)\left(1-\tau \right)\left[\left(\frac{qx}{r-\mu }-\frac{c}{r}\right)-\left(\frac{qx_d}{r-\mu }-\frac{c}{r}\right){\left(\frac{x}{x_d}\right)}^{\gamma_{-}}\right],\end{array}} $$
and firm value is
 $$ {\displaystyle \begin{array}{c}{V}_q(x)=\unicode{x1D53C}\left[{\int}_0^{\underline{T}\left({x}_d\right)}{e}^{- rt}\left[\left(1-\tau \right){qX}_t+\tau c\right]\mathrm{d}t+{e}^{-r\underline{T}\left({x}_d\right)}\left(1-\alpha \right)\left(\frac{1-\tau }{r-\mu}\right){qx}_d\right]\\ {}=\left(\frac{1-\tau }{r-\mu}\right) qx+\frac{\tau c}{r}-\left[\alpha \left(\frac{1-\tau }{r-\mu}\right){qx}_d+\frac{\tau c}{r}\right]{\left(\frac{x}{x_d}\right)}^{\gamma_{-}}.\end{array}} $$
Before both investment and bankruptcy, debtholders receive coupon payments
 $ c $
, the manager receives
 $ \left(\theta +\lambda \left(1-\theta \right)\right)\left(1-\tau \right)\left({X}_t-c\right) $
, and minority shareholders get
 $ \left(1-\lambda \right)\left(1-\theta \right)\left(1-\tau \right)\left({X}_t-c\right) $
. Once the cash flow deteriorates and hits the bankruptcy boundary
 $ {x}_{\mathrm{\ell}} $
from above, debtholders get the liquidation value while shareholders receive nothing. Conversely, once the cash flow grows and hits the investment threshold
 $ {x}_i $
from below, we take it that the debtholders, the manager, minority shareholders, and the firm get nothing but a lump-sum payment, amounting to
 $ {D}_q\left({x}_i\right) $
,
 $ {W}_q\left({x}_i\right)-\lambda I $
,
 $ {J}_q\left({x}_i\right)-\left(1-\lambda \right)I $
, and
 $ {V}_q\left({x}_i\right)-I $
, respectively. Thus, the debt value is
 $$ {\displaystyle \begin{array}{c}D(x)=\unicode{x1D53C}\left[{\int}_0^{\hat{T}}{e}^{- rt}c\mathrm{d}t+{e}^{-r\hat{T}}{G}_D\left({X}_{\hat{T}}\right)\right]\\ {}=\frac{c}{r}+{\Delta}_{\mathrm{\ell}}(x)\left[\left(1-\alpha \right)\left(\frac{1-\tau }{r-\mu}\right){x}_{\mathrm{\ell}}-\frac{c}{r}\right]+{\Delta}_i(x)\left[{D}_q\left({x}_i\right)-\frac{c}{r}\right],\end{array}} $$
where
 $ \hat{T}:= \operatorname{inf}\left\{t\ge 0:{X}_t\notin \left({x}_{\mathrm{\ell}},{x}_i\right)\right\} $
,
 $ {G}_D\left({x}_{\mathrm{\ell}}\right)=\left(1-\alpha \right)\left(\frac{1-\tau }{r-\mu}\right){x}_{\mathrm{\ell}} $
,
 $ {G}_D\left({x}_i\right)={D}_q\left({x}_i\right) $
,
 $ {\Delta}_{\mathrm{\ell}}(x):= \frac{{\left({x}_i\right)}^{\gamma_{+}}{(x)}^{\gamma_{-}}-{\left({x}_i\right)}^{\gamma_{-}}{(x)}^{\gamma_{+}}}{{\left({x}_i\right)}^{\gamma_{+}}{\left({x}_{\mathrm{\ell}}\right)}^{\gamma_{-}}-{\left({x}_i\right)}^{\gamma_{-}}{\left({x}_{\mathrm{\ell}}\right)}^{\gamma_{+}}} $
, and
 $ {\Delta}_i(x):= \frac{{\left({x}_{\mathrm{\ell}}\right)}^{\gamma_{-}}{(x)}^{\gamma_{+}}-{\left({x}_{\mathrm{\ell}}\right)}^{\gamma_{+}}{(x)}^{\gamma_{-}}}{{\left({x}_i\right)}^{\gamma_{+}}{\left({x}_{\mathrm{\ell}}\right)}^{\gamma_{-}}-{\left({x}_i\right)}^{\gamma_{-}}{\left({x}_{\mathrm{\ell}}\right)}^{\gamma_{+}}} $
. The manager’s value is
 $$ {\displaystyle \begin{array}{l}\hskip-2em W(x)=\unicode{x1D53C}\left[{\int}_0^{\hat{T}}{e}^{- rt}\left(\theta +\lambda \left(1-\theta \right)\right)\left(1-\tau \right)\left({X}_t-c\right)\mathrm{d}t+{e}^{-r\hat{T}}{G}_W\left({X}_{\hat{T}}\right)\right]\\ {}\hskip1.8em =\left(\theta +\lambda \left(1-\theta \right)\right)\left(1-\tau \right)\left(\frac{x}{r-\mu }-\frac{c}{r}\right)-{\Delta}_{\mathrm{\ell}}(x)\left(\theta +\lambda \left(1-\theta \right)\right)\left(1-\tau \right)\left(\frac{x_{\mathrm{\ell}}}{r-\mu }-\frac{c}{r}\right)\\ {}\hskip2em +{\Delta}_i(x)\left[{W}_q\left({x}_i\right)-\lambda I-\left(\theta +\lambda \left(1-\theta \right)\right)\left(1-\tau \right)\left(\frac{x_i}{r-\mu }-\frac{c}{r}\right)\right],\end{array}} $$
where
 $ {G}_W\left({x}_{\mathrm{\ell}}\right)=0 $
and
 $ {G}_W\left({x}_i\right)={W}_q\left({x}_i\right)-\lambda I $
. Minority shareholders’ value is
 $$ {\displaystyle \begin{array}{l}J(x)=\unicode{x1D53C}\left[{\int}_0^{\hat{T}}{e}^{- rt}\left(1-\lambda \right)\left(1-\theta \right)\left(1-\tau \right)\left({X}_t-c\right)\mathrm{d}t+{e}^{-r\hat{T}}{G}_J\left({X}_{\hat{T}}\right)\right]\\ {}\hskip3em =\left(1-\lambda \right)\left(1-\theta \right)\left(1-\tau \right)\left(\frac{x}{r-\mu }-\frac{c}{r}\right)-{\Delta}_{\mathrm{\ell}}(x)\left(1-\lambda \right)\left(1-\theta \right)\left(1-\tau \right)\left(\frac{x_{\mathrm{\ell}}}{r-\mu }-\frac{c}{r}\right)\\ {}\hskip3.5em +{\Delta}_i(x)\left[{J}_q\left({x}_i\right)-\left(1-\lambda \right)I-\left(1-\lambda \right)\left(1-\theta \right)\left(1-\tau \right)\left(\frac{x_i}{r-\mu }-\frac{c}{r}\right)\right],\end{array}} $$
where
 $ {G}_J\left({x}_{\mathrm{\ell}}\right)=0 $
and
 $ {G}_J\left({x}_i\right)={J}_q\left({x}_i\right)-\left(1-\lambda \right)I $
. Firm value is
 $$ {\displaystyle \begin{array}{l}V(x)=\unicode{x1D53C}\left[{\int}_0^{\hat{T}}{e}^{- rt}\left[\left(1-\tau \right){X}_t+\tau c\right]\mathrm{d}t+{e}^{-r\hat{T}}G\left({X}_{\hat{T}}\right)\right]\\ {}\hskip3.25em =\left(\frac{1-\tau }{r-\mu}\right)x+\frac{\tau c}{r}-{\Delta}_{\mathrm{\ell}}(x)\left[\alpha \left(\frac{1-\tau }{r-\mu}\right){x}_{\mathrm{\ell}}+\frac{\tau c}{r}\right]\\ {}\hskip3.3em +{\Delta}_i(x)\left[{V}_q\left({x}_i\right)-I-\left(\frac{1-\tau }{r-\mu}\right){x}_i-\frac{\tau c}{r}\right],\end{array}} $$
where
 $ G\left({x}_{\mathrm{\ell}}\right)=\left(1-\alpha \right)\left(\frac{1-\tau }{r-\mu}\right){x}_{\mathrm{\ell}} $
and
 $ G\left({x}_i\right)={V}_q\left({x}_i\right)-I $
.
The post-investment default threshold
 $ {x}_d $
and the pre-investment one
 $ {x}_{\mathrm{\ell}} $
are determined by the smooth-pasting conditions, respectively given by
 $$ {\left.\frac{\partial {W}_q(x)}{\partial x}\right|}_{x={x}_d+}=0,\hskip1em {\left.\frac{\partial W(x)}{\partial x}\right|}_{x={x}_{\mathrm{\ell}}+}=0, $$
leading to
 $$ {x}_d=\left(\frac{1}{q}\right)\left(\frac{r-\mu }{r}\right)\left(\frac{\gamma_{-}}{\gamma_{-}-1}\right)c, $$
and the default threshold
 $ {x}_{\mathrm{\ell}} $
determined by
 $$ {\displaystyle \begin{array}{l}{\Gamma}_1\left[\left(1-\tau \right)\left[\left(\frac{q-1}{r-\mu}\right){x}_i-\left(\frac{c}{r}\right)\left(\frac{1}{\gamma_{-}-1}\right){\left(\frac{x_i}{x_d}\right)}^{\gamma_{-}}\right]-\frac{\lambda I}{\theta +\lambda \left(1-\theta \right)}\right]\\ {}={\Gamma}_2\left(1-\tau \right)\left(\frac{x_{\mathrm{\ell}}}{r-\mu }-\frac{c}{r}\right)-\left(\frac{1-\tau }{r-\mu}\right){x}_{\mathrm{\ell}},\end{array}} $$
where
 $ {\Gamma}_1:= \frac{\left({\gamma}_{+}-{\gamma}_{-}\right){\left({x}_{\mathrm{\ell}}\right)}^{\left({\gamma}_{+}+{\gamma}_{-}\right)}}{{\left({x}_i\right)}^{\gamma_{+}}{\left({x}_{\mathrm{\ell}}\right)}^{\gamma_{-}}-{\left({x}_i\right)}^{\gamma_{-}}{\left({x}_{\mathrm{\ell}}\right)}^{\gamma_{+}}} $
and
 $ {\Gamma}_2:= \frac{\gamma_{-}{\left({x}_i\right)}^{\gamma_{+}}{\left({x}_{\mathrm{\ell}}\right)}^{\gamma_{-}}-{\gamma}_{+}{\left({x}_i\right)}^{\gamma_{-}}{\left({x}_{\mathrm{\ell}}\right)}^{\gamma_{+}}}{{\left({x}_i\right)}^{\gamma_{+}}{\left({x}_{\mathrm{\ell}}\right)}^{\gamma_{-}}-{\left({x}_i\right)}^{\gamma_{-}}{\left({x}_{\mathrm{\ell}}\right)}^{\gamma_{+}}} $
.
We assert that the derived default thresholds are incentive compatible; that is, they maximize both the manager’s value and firm value subject to the manager’s limited liability. This assertion aligns with the arguments and approaches in Leland (Reference Leland1994), Mauer and Ott (Reference Mauer, Ott, Brennan and Trigeorgis2000), and Hackbarth and Mauer (Reference Hackbarth and Mauer2012), among others. To see this analytically, we examine the determination of the post-investment default threshold
 $ {x}_d $
. First, the manager-optimal default strategy is formulated to solve the problem:
 $$ \underset{x_d}{\max }{W}_q(x),\hskip2em \forall x\ge {x}_d. $$
By the first-order optimality condition
 $ \frac{\partial {W}_q(x)}{\partial {x}_d}=0 $
, we get
 $ {x}_d=\left(\frac{1}{q}\right)\left(\frac{r-\mu }{r}\right)\left(\frac{\gamma_{-}}{\gamma_{-}-1}\right)c $
. Note that
 $$ {\left.\frac{\partial^2{W}_q(x)}{\partial {x}_d^2}\right|}_{x_d=\left(\frac{1}{q}\right)\left(\frac{r-\mu }{r}\right)\left(\frac{\gamma_{-}}{\gamma_{-}-1}\right)c}=\left(\theta +\lambda \left(1-\theta \right)\right)\left(1-\tau \right)\left(\frac{q}{x_d}\right)\left(\frac{\gamma_{-}-1}{r-\mu}\right){\left(\frac{x}{x_d}\right)}^{\gamma_{-}}<0. $$
Therefore, for any
 $ x\ge {x}_d $
,
 $ {W}_q(x) $
can be maximized by setting
 $ {x}_d=\left(\frac{1}{q}\right)\left(\frac{r-\mu }{r}\right)\left(\frac{\gamma_{-}}{\gamma_{-}-1}\right)c $
. Next, consider the firm-optimal default threshold, which solves
 $$ \underset{x_d}{\max }{V}_q(x),\hskip2em \mathrm{subject}\ \mathrm{to}:{W}_q(x)\ge 0,\hskip2em \forall x\ge {x}_d. $$
We derive that
 $$ \frac{\partial {V}_q(x)}{\partial {x}_d}=\left[ q\alpha \left({\gamma}_{-}-1\right)\left(\frac{1-\tau }{r-\mu}\right)+\frac{\tau c{\gamma}_{-}}{rx_d}\right]{\left(\frac{x}{x_d}\right)}^{\gamma_{-}}<0 $$
since
 $ {\gamma}_{-}<0 $
. Thus, the lower
 $ {x}_d $
, the larger
 $ {V}_q(x) $
. However, the choice of
 $ {x}_d $
must take into account the manager’s limited liability: for any
 $ x\ge {x}_d $
,
 $ {W}_q(x) $
must be nonnegative. We get
 $$ {\displaystyle \begin{array}{c}{\left.\frac{\partial {W}_q(x)}{\partial x}\right|}_{x={x}_d}=\left(\theta +\lambda \left(1-\theta \right)\right)\left(1-\tau \right)\left[q\left(\frac{1-{\gamma}_{-}}{r-\mu}\right)+\frac{c{\gamma}_{-}}{rx_d}\right],\\ {}\frac{\partial^2{W}_q(x)}{\partial {x}^2}=\left(\theta +\lambda \left(1-\theta \right)\right)\left(1-\tau \right)\left(1-{\gamma}_{-}\right)\left(\frac{\gamma_{-}}{x^2}\right)\left(\frac{qx_d}{r-\mu }-\frac{c}{r}\right){\left(\frac{x}{x_d}\right)}^{\gamma_{-}}.\end{array}} $$
Given
 $ {x}_d $
, we have
 $ {W}_q\left({x}_d\right)=0 $
. So if
 $ {\left.\frac{\partial {W}_q(x)}{\partial x}\right|}_{x={x}_d}<0 $
, then
 $$ \exists \unicode{x025B} >0,{W}_q\left({x}_d+\unicode{x025B} \right)<{W}_q\left({x}_d\right)=0, $$
violating the manager’s limited liability. Thus, we must have
 $ {\left.\frac{\partial {W}_q(x)}{\partial x}\right|}_{x={x}_d}\ge 0 $
, equivalent to
 $$ {x}_d\ge \left(\frac{1}{q}\right)\left(\frac{r-\mu }{r}\right)\left(\frac{\gamma_{-}}{\gamma_{-}-1}\right)c. $$
In this region of
 $ {x}_d $
, if
 $ {x}_d\le \frac{\left(r-\mu \right)c}{qr} $
, we get
 $ \frac{\partial^2{W}_q(x)}{\partial {x}^2}\ge 0 $
and then
 $ \frac{\partial {W}_q(x)}{\partial x}\ge {\left.\frac{\partial {W}_q(x)}{\partial x}\right|}_{x={x}_d}\ge 0 $
; if
 $ {x}_d>\frac{\left(r-\mu \right)c}{qr} $
, then
 $ \frac{\partial {W}_q(x)}{\partial x}>0 $
. In both cases, we can derive
 $ {W}_q(x)\ge {W}_q\left({x}_d\right)=0 $
for any
 $ x\ge {x}_d $
, meaning the manager’s limited liability holds. Thus, we look for a
 $ {x}_d $
in the region
 $ {x}_d\ge \left(\frac{1}{q}\right)\left(\frac{r-\mu }{r}\right)\left(\frac{\gamma_{-}}{\gamma_{-}-1}\right)c $
that maximizes
 $ {V}_q(x) $
. Since
 $ {V}_q(x) $
decreases with
 $ {x}_d $
, the firm-optimal default threshold
 $ {x}_d $
is therefore
 $$ {x}_d=\left(\frac{1}{q}\right)\left(\frac{r-\mu }{r}\right)\left(\frac{\gamma_{-}}{\gamma_{-}-1}\right)c\hskip2em \iff \hskip2em {\left.\frac{\partial {W}_q(x)}{\partial x}\right|}_{x={x}_d}=0. $$
Thus, the smooth-pasting condition
 $ {\left.\frac{\partial {W}_q(x)}{\partial x}\right|}_{x={x}_d}=0 $
is essential for maximizing the post-investment firm value subject to the manager’s limited liability constraint. Given that both the manager and minority shareholders receive 0 salvage value in default, they agree on the firm’s default policies, as discussed in Morellec et al. (Reference Morellec, Nikolov and Schürhoff2012), (Reference Morellec, Nikolov and Schürhoff2018). Additionally, the smooth-pasting condition for pre-investment default threshold
 $ {x}_{\mathrm{\ell}} $
involves complexities, which are elaborated upon in Chapter 4 of Dixit and Pindyck (Reference Dixit and Pindyck1994).
The manager-optimal investment threshold
 $ {x}_i^S $
that maximizes the manager’s ex-post value is determined by
 $$ {\left.\frac{\partial W(x)}{\partial x}\right|}_{x={x}_i-}={\left.\frac{\partial {W}_q(x)}{\partial x}\right|}_{x={x}_i+}, $$
which gives
 $$ {\displaystyle \begin{array}{l}\left(1-\tau \right)\left[{\Gamma}_3\left(\frac{x_{\mathrm{\ell}}}{r-\mu }-\frac{c}{r}\right)+\left(\frac{q-1}{r-\mu}\right){x}_i-\left(\frac{c}{r}\right)\left(\frac{\gamma_{-}}{\gamma_{-}-1}\right){\left(\frac{x_i}{x_d}\right)}^{\gamma_{-}}\right]\\ {}={\Gamma}_4\left[\left(1-\tau \right)\left[\left(\frac{q-1}{r-\mu}\right){x}_i-\left(\frac{c}{r}\right)\left(\frac{1}{\gamma_{-}-1}\right){\left(\frac{x_i}{x_d}\right)}^{\gamma_{-}}\right]-\frac{\lambda I}{\theta +\lambda \left(1-\theta \right)}\right],\end{array}} $$
where
 $ {\Gamma}_3:= \frac{\left({\gamma}_{-}-{\gamma}_{+}\right){\left({x}_i\right)}^{\left({\gamma}_{+}+{\gamma}_{-}\right)}}{{\left({x}_i\right)}^{\gamma_{+}}{\left({x}_{\mathrm{\ell}}\right)}^{\gamma_{-}}-{\left({x}_i\right)}^{\gamma_{-}}{\left({x}_{\mathrm{\ell}}\right)}^{\gamma_{+}}} $
and
 $ {\Gamma}_4:= \frac{\gamma_{+}{\left({x}_i\right)}^{\gamma_{+}}{\left({x}_{\mathrm{\ell}}\right)}^{\gamma_{-}}-{\gamma}_{-}{\left({x}_i\right)}^{\gamma_{-}}{\left({x}_{\mathrm{\ell}}\right)}^{\gamma_{+}}}{{\left({x}_i\right)}^{\gamma_{+}}{\left({x}_{\mathrm{\ell}}\right)}^{\gamma_{-}}-{\left({x}_i\right)}^{\gamma_{-}}{\left({x}_{\mathrm{\ell}}\right)}^{\gamma_{+}}} $
. The firm-optimal investment threshold
 $ {x}_i^F $
that maximizes firm value is determined by
 $$ {\left.\frac{\partial V(x)}{\partial x}\right|}_{x={x}_i-}={\left.\frac{\partial {V}_q(x)}{\partial x}\right|}_{x={x}_i+}, $$
which leads to
 $$ {\displaystyle \begin{array}{l}{\Gamma}_3\left[\alpha \left(\frac{1-\tau }{r-\mu}\right){x}_{\mathrm{\ell}}+\frac{\tau c}{r}\right]-{\gamma}_{-}\left(\frac{c}{r}\right)\left[\left(\frac{{\alpha \gamma}_{-}}{\gamma_{-}-1}\right)\left(1-\tau \right)+\tau \right]{\left(\frac{x_i}{x_d}\right)}^{\gamma_{-}}\\ {}\hskip3em ={\Gamma}_4\left[{V}_q\left({x}_i\right)-I-\left(\frac{1-\tau }{r-\mu}\right){x}_i-\frac{\tau c}{r}\right]-\left(\frac{1-\tau }{r-\mu}\right)\left(q-1\right){x}_i.\end{array}} $$
We can solve equations (A.5), (A.6), and (A.7) numerically. Specifically, solving equations (A.5) and (A.6) simultaneously yields the manager-optimal investment and default polices
 $ \left\{{x}_i^S,{x}_{\mathrm{\ell}}^S\right\} $
, and solving equations (A.5) and (A.7) simultaneously produces the firm-optimal polices
 $ \left\{{x}_i^F,{x}_{\mathrm{\ell}}^F\right\} $
.