There is considerable commercial interest in the lactoperoxidase (LP) enzyme due to its antimicrobial properties. The enzyme has both medical and nutritional benefits (Chiu & Etzel, Reference Chiu and Etzel1997). The demand for the enzyme in a pure form is increasing. A variety of procedures are available for the purification of the enzyme, however, cation-exchange chromatography is the most common method used in the isolation and recovery process (Uchida et al. Reference Uchida, Dosako, Sato and Kawakami2003). The method uses a wide range of resins with different recovery capacities (Yoshida & Ye-Xiuyun, Reference Yoshida and Ye-Xiuyun1991a). Fonteh (Reference Fonteh2001) attributed the poor recovery of LP (54%) to the resin used, Carboxymethyl Sephadex (CM-25C). The molecular weights and isoelectric points of lactoperoxidase, lactoferrin and other secretory components are similar (Uchida et al. Reference Uchida, Dosako, Sato and Kawakami2003) posing difficulties in the isolation of LP in a pure form. While some researchers (Polis & Shmukler, Reference Polis and Shmukler1953) have reported the presence of lactoferrin (LF), others (Morrison et al. Reference Morrison, Hamilton and Stotz1957) have reported several forms of the enzyme. Ion exchangers can be used in both batch and column procedures, either individually or in combination. The inefficiency of batch procedures compared with column procedures has been reported. Nevertheless, batch methods are still important as they are simpler than column procedures, use inexpensive equipment and are very rapid with fewer technical difficulties due to either swelling or shrinkage of adsorbents.
The current study was therefore carried out to further examine the extraction efficiency and product quality of a batch procedure compared with column procedures. Two types of resins (CM 25C and SP-650C) were used and a number of process variables were included in the study. A further aim was to assess the purity of LP isolates from both procedures, especially with regard to its separation from LF and the possible occurrence of the enzyme in more than one form.
Materials and Methods
Preparation of rennet whey
Fresh bulk milk from the University farm was warmed to 30°C and clarified rennet whey was prepared as described by Goodall et al. (Reference Goodall, Grandison, Jauregi and Price2008). The product was dispensed into 250 ml sterile plastic bottles and frozen at −18°C. When required, the whey was thawed at room temperature for 4 h and degassed under vacuum. The initial lactoperoxidase activity of whey [Eo] was assayed just before each chromatographic run.
Buffer solution
The standard buffer solution for packing, loading and washing procedures was 0·05 m-sodium phosphate, pH 6·5.
Cation Exchange Chromatography – Batch procedure
A 500 ml glass beaker containing 25 ml settled resin was used in the batch procedure. Whey (10–50 ml) was added and the mixture was gently and continuously shaken (ZMD 201 shaker, Amersham, UK) for 20 min unless otherwise stated, at 150 shakings /minute to keep the resin in suspension. The resin was then allowed to settle and the depleted whey was drawn off the settled resin by means of a syringe and the recovered resin washed with three successive 50 ml aliquots of buffer. Elution was completed using 25 ml buffer containing 2 m-NaCl for SP-650C and 1 m-NaCl for CM-25C with shaking (150/min) for 20 min, unless otherwise stated. The supernatant recovered from the settled resins was used for measuring LP activity. Three separate factors were determined as follows:
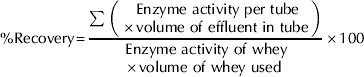
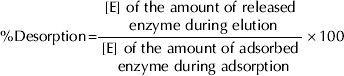

where [E]=enzyme activity.
The adsorption ratio (AR) which was used to establish the adsorption capacity of each respective resin was computed as follows:

The following experimental procedures were carried out by the batch method:
— To establish the saturation points of the two resins, the whey volume during the adsorption stage was increased stepwise from 10 to 50 ml.
— To examine the effect of resin-whey contact time, 20 ml and 50 ml whey were mixed with 25 ml settled CM-25C and SP-650C resins and the ion exchange process monitored by drawing off 1 ml depleted whey at 10 min intervals up to 60 min, and measuring LP activity.
— To examine the effect of salt concentration of elution buffer on LP recovery, solutions of buffer containing 0·2–1·0 m-NaCl were used for elution with CM-25C (25 ml) and 20 ml whey. As a check to ensure that the high salt concentrations in the reaction mixture did not reduce LP activity, LP activity was also measured in solutions of purified enzyme dissolved in the same NaCl solutions.
— To determine if enzyme desorption was affected by elution time, the elution buffer was contacted with the resin (CM-25C) following adsorption, for times varying from 10 to 60 min.
— To determine whether two-step elution was more efficient than a single step, batches of CMC-25C resin (25 ml) were held in contact with whey (20 ml). The resins were then eluted in two steps using half the volume of elution buffer (12·5 ml) for each step. This procedure was carried out with five different elution buffers containing 0·0125–0·2 m-NaCl.
Cation Exchange Chromatography (CEC) – Column procedure
The CEC system included a gradient mixer (GM-1, Pharmacia Biotech., Uppsala, Sweden), fraction collector (2110, Biorad, Ca. USA), UV monitor (EM-1 Econo, Biorad, Ca. USA), and chart recorder (BS-271, Bryans, Cambridge, UK). The system components were connected by 1·0 and 3·0 mm internal diameter silicon tubes (Pharmacia Biotech. Uppsala, Sweden). The packed resin had bed dimensions of 2·6 cm (internal diameter)×30 cm (159·3 cm3) in a glass column. The buffer was vacuum degassed through a nylon membrane filter 0·2 μm (Pall Corporation, Michigan, USA). The flow rate was 4 ml/min (45 cm/h). The enzyme was adsorbed on the resin by applying 50 to 250 ml whey. The enzyme was then eluted using the appropriate buffered salt solution.
For the SP-650C resin (TOSOH corp. Tokyo, Japan), suspended resin (260 ml) was poured into a 1000 ml beaker and washed with 4 volumes of buffer. The resin was then re-suspended in buffer and the slurry concentrated to 50% before packing. After packing, the resin was equilibrated with 0·1 m-NaCl in buffer. Then 250 ml whey was applied to the column and washed with 250 ml of the buffer. The adsorbed proteins were eluted with a linear gradient of increasing NaCl concentration (0–2 m-NaCl). The absorbance at 280 nm was measured on a UV monitor. The LP activities in the eluates were determined as described below. Subsequently, 250 ml 0·5 m-NaOH, followed by 250 ml 0·5 m-NaCl were eluted for cleaning the SP-650C resin.
For the CM-25C resin, dry resin (30 g) was swollen by suspending in 300 ml buffer. The buffer was decanted off and the resin washed twice with the same volume of buffer. Swelling was accomplished by heating the resin at 100°C for 2 h with constant stirring. After cooling, the resin was re-suspended, packed and equilibrated in buffer solution. After adsorption, the resin was washed with buffer. The adsorbed proteins were eluted with a linear gradient of increasing NaCl concentration (0–1 m-NaCl). Cleaning was achieved by eluting 250 ml 2 m-NaCl followed by the same amount of 0·1 m-NaOH. After two runs, the resin was regenerated following the cleaning process by soaking in 250 ml 70% ethanol. The resin was then rinsed twice with buffer solution before being re-packed.
Chemical and enzymic analysis
Lactoperoxidase activity in whey and eluted fractions was determined according to Fonteh et al. (Reference Fonteh, Grandison and Lewis2002).
To determine the effect of NaCl concentration on LP activity, 30 mg l-1 purified enzyme (DMV International, Delhi, USA) was dissolved in buffer containing 0–1 m-NaCl prior to measurement of LP activity.
Analysis of proteins in whey and eluted fractions from batch and column CEC were analysed by SDS-PAGE (Laemmli, 1970) and by reversed phase HPLC according to Casal et al. (Reference Casal, Montilla, Moreno, Olano and Corzo2006) with slight modification according to Goodall et al. (Reference Goodall, Grandison, Jauregi and Price2008).
Results
Batch procedure
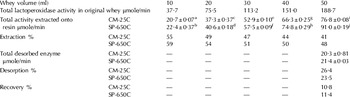
There was a consistent increase in the total enzyme activity adsorbed with stepwise increases in whey volume (Table 1), but the corresponding percentage extraction decreased with increased whey volume. It was difficult to establish the exact saturation points for the two resins. The differences in adsorption were significant (P⩽0·05) between resins and for different whey volumes. The percentage desorption and percentage recovery of LP enzyme after loading 50 ml whey were low for both resins (Table 1).
Effect of whey volume on the lactoperoxidase desorption and recovery (n=3) during batch cation-exchange chromatography with two resins (CM-25C and SP-650C). Values bearing the same superscript letters in both rows and columns are not significantly different (P⩾0·05)

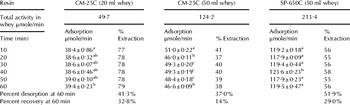
The resin-whey contact time had very little influence (P⩾0·05) on adsorption regardless of the amount of whey and type of resin used (Table 2). This result was surprising, and implied that equilibrium had been reached within 10 min.
Changes in the amount of adsorbed enzyme with changes in resin-enzyme contact time when 20 and 50 ml whey was used on CM-25C and SP-650C resins (n=3). Values bearing the same superscript letters in the same column are not significantly different (P⩾0·05)

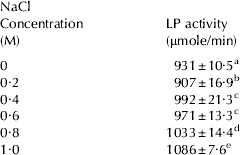
Table 3a clearly demonstrates that increasing NaCl did not reduce enzyme activity. In fact there was a slight increase in activity at the higher salt concentrations. The effect of salt strength on LP recovery is shown in Table 3b. This demonstrated small but significant (P⩽0·05) increases in LP desorption as the salt strength increased.
Changes in Lactoperoxidase (LP) activity of solutions of purified enzyme (30 mg L−1) dissolved in buffer containing increasing NaCl concentrations (n=4). Values bearing the same superscript letters in the same column are not significantly different (P⩾0·05)
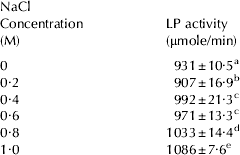
Effect of NaCl concentrations in elution buffer on enzyme desorption and recovery using CM-25C resin (n=3). Values bearing the same superscript letters in the same column are not significantly different (P⩾0·05)

Extending elution time resulted in small but significant increases (P⩽0·05) in enzyme desorption and thus elution, although the majority of the LP had been desorbed within 10 min (Table 4).
Effect of elution time on enzyme elution and recovery (n=3) in a batch system using CM-25C resin. Values bearing the same superscript letters in the same column are not significantly different (P⩾0·05)

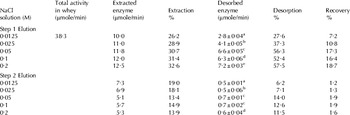
For the study of two-step elution, five batches of CM-25C resin were held in contact with whey and the extraction ranged between 26·2 and 32·6% (Table 5). The resins were then eluted in two steps. There was significant variation (P⩽0·05) in desorption at different concentration levels in both elution steps, however, the effect was much more pronounced in the first elution step. Elution was similar at 0·05–0·2 m which implies that the maximum had been reached at 0·05 m and this was the optimum elution concentration. Over 50% of adsorbed enzyme was desorbed at ⩾0·05 m in the first elution step, which is about five times higher than the amount of enzyme desorbed in the second elution at the same concentrations. However, the total amount of enzyme desorbed in both steps was only two-thirds of the total adsorbed enzyme, which suggests an incomplete release of the enzyme from the resin matrix.
Desorption of enzyme in a batch system from CM-25C resin in a two step elution (n=3). Values bearing the same superscript letters in the same column are not significantly different (P⩾0·05)

Column procedure
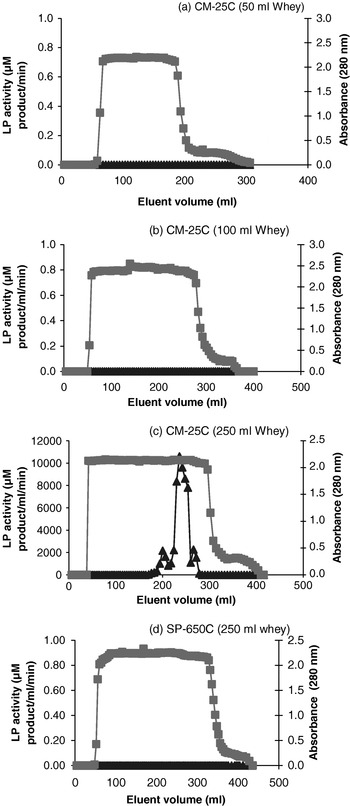
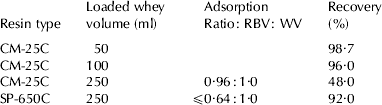
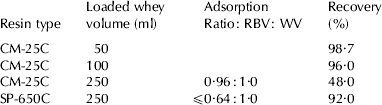
Different volumes of whey were applied during this process to examine the adsorption capabilities of the two types of resins used. Figure 1 summarises the adsorption and washing phases. Complete adsorption of the enzyme depended on the amount of whey applied (Wv) onto the column and its adsorption capacity. Figure 1 and Table 6 summarise the adsorption and recoveries of enzyme for the different runs. Complete adsorption on CM-25C was achieved with 50 ml and 100 ml whey (Fig. 1a & 1b). No enzyme activity was detected in the deproteinised whey streams when these volumes were applied, showing that the saturation point of the resin was not reached. On raising Wv to 250 ml, enzyme activity was detectable when 166 ml deproteinised whey had passed through (Fig. 1c). This marked the saturation point and maximum adsorption capacity of CM-25C resin. However, when the same amount of whey (250 ml) was applied onto SP-650C (Fig. 1d), with the same bed dimensions, no enzyme activity was detected in the deproteinised stream implying complete adsorption from the deproteinised stream and further potential for enzyme adsorption.
Adsorption profiles of LP enzymes in eluents for the different whey volumes applied on CM-25C and SP-650C resins. LP activity, ▴; A280 nm,  .

The adsorption capacities and recoveries from CM-25C and SP-650C resins in eluents for the different chromatographic runs. RBV, Resin bed volume; WV, Whey volume
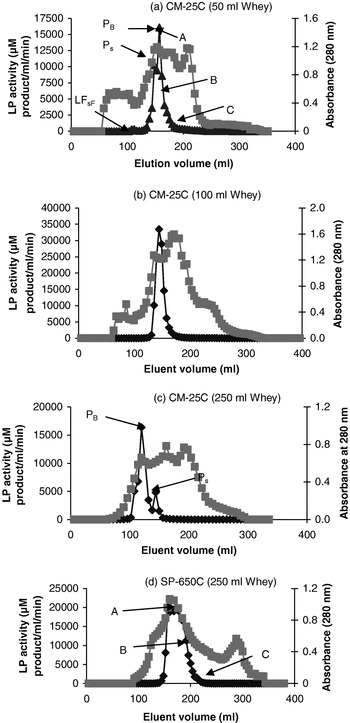
Elution profiles with both resins using a linear elution gradient are shown in Fig. 2. While LP activity was generally eluted as 1 or 2 clear peaks, a wider spread and other peaks of A280 can be seen. This presumably relates to other proteins of similar MWt and charge, which could include Lactoferrin (LF).
Elution profiles of LP enzyme on CM-25C and SP-650C resins loaded with different whey volumes. PB, big peak; PS, small peak; A, recovered peak LP fractions; B, subsequent pooled LP fractions & C, the next subsequent pooled LP fractions and LFsf, LF suspected fraction. LP activity, ◆; A280 nm, .

The recovery efficiency of the resins depended on Wv and the resin saturation condition (Table 6). This was determined based on the total LP activity of recovered fractions and total LP activity of whey. Higher recoveries were recorded when the Wv was less than or equal to the saturation point whey volume (Ws). The recovery was almost 100% with under-saturation, but was greatly reduced with over-saturation (Wv≫Ws). The recovery for SP-650C (92%) was twice that for CM-25C (48%) when the same whey volume (250 ml) was loaded.
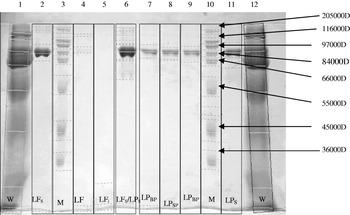
Figure 3 illustrates the SDS-PAGE for LP isolates recovered from the column procedure using CM-25C resin. The LF standard (track 2) ran at MWt 84 700 Da and LP standard (track 11) at 86 100 Da. A mixture of LF/LP standards (track 6) gave a single band and hence the method cannot readily distinguish between the 2 proteins. Tracks 7, 8 & 9 were single bands of LP resolved from fractions collected from big and small peaks (Fig. 2a; Fig. 3). Although two peaks of LP were found in some chromatograms during elution (Fig. 2), the MWt (86 800 Da) for LP recovered from the small peak (Fig. 2a; track 8, Ps) compared well with the MWt of the two replicates of LP recovered from the big peak (PB, Fig. 2a; tracks 7 and 9), that is, 87 500 Da and 86 100 Da respectively. Tracks 4 & 5 relate to fractions suspected to contain LF collected from the very small peak that preceded the LP elution peak (Fig. 2a), however, no bands were visible in these fractions.
SDS-PAGE of whey and LP isolates recovered from Ion exchange chromatography by column procedure. LPs and LFs are standards for LP and LF respectively; W, whey; M, Markers; LPBP and LPSP are LP fractions collected from big peak and small peak repectively; LFi, suspected LF fraction.

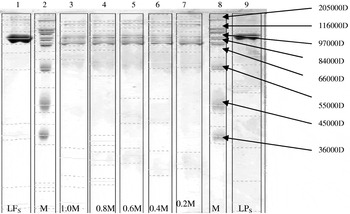
The SDS-PAGE profiles for LP fractions eluted using different salt concentrations in the batch procedure are presented in Fig. 4. The batch fractions eluted using 1, 0·8, 0·6, 0·4 and 0·2 m gave strong bands corresponding to LP, and some faint bands were observed at 67 000 Da and at 116 000 Da. The band at 67 000 Da was probably bovine serum albumin, while that at 116 000 Da was not identified. There was no great difference in molecular weight distribution between the different fractions.
SDS-PAGE of LP isolates eluted using different salt concentrations in a batch procedure. LPs and LFs are LP and LF standards; M, Markers.

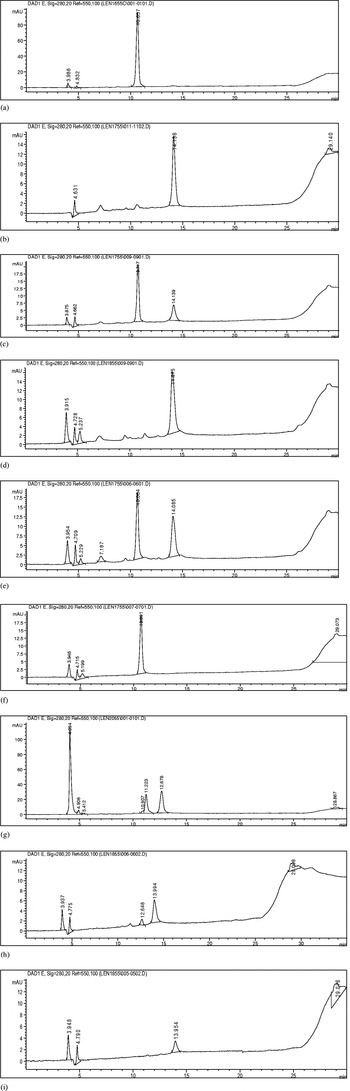
The composition of the different fractions was investigated by using reverse phase HPLC to assess their purity. The chromatographic pattern of the batch and column procedures LP isolates from whey are shown in Fig. 5(a–i). The retention times (Rt) for the standards were about 10–11 min for LF and about 14 min for LP (Fig. 5a & b). Their mixture of LF & LP (Fig. 5c) showed a good degree of separation of the two proteins. Three subfractions from column separations using SP-650C (relating to pooled fractions of the peak collected up to point A, from points A-B, and from B-C on Fig. 2d were examined. Figure 5d shows that the fraction corresponding to point A in Fig. 2d contained only a single peak with Rt~14 min corresponding to LP. However, the subsequent fraction A-B (Fig. 2d) contained two peaks with Rt~10 min and ~14 min corresponding to both LF and LP (Fig. 5e). The next subsequent fraction B-C (Fig. 2d) had only one peak with Rt~10 min corresponding to LF (Fig. 5f). Figure 5h & 5i relate to peaks Pb and Ps from Fig. 2a, i.e. column procedure using CM-25C. The latter shows a clear single peak corresponding to LP, while the former is less clear, with an obvious peak for LP and a second unidentified smaller peak running between the retention times for LP and LF, and a very small peak corresponding to LF. The eluate from the batch method (CM-25C) contained 2 peaks corresponding to LP and LF (Fig. 5g).
Reverse phase HPLC chromatograms for the different fractions of LP isolates. (a) Chromatogram for LF standard; (b) Chromatogram for LP standard; (c) Chromatogram for the mixture of LP/LF standards; (d) Chromatogram for LP isolate, fraction A from column procedure with SP-650C; (e) Chromatogram for LP isolate, fraction B from column procedure with SP-650C; (f) Chromatogram for LP isolate fraction C (bearing pure LF) from column procedure with SP-650C; (g) Chromatogram for LP isolates from batch extraction with CM-25C; (h) Chromatogram for LP isolate, main peak (PB) from column procedure with CM-25C; (i) Chromatogram for LP isolate, small peak (Ps) from column procedure with CM-25C.

A number of other unidentified peaks with retention times of about 4 min were also observed on HPLC in both the batch and column procedure LP isolates.
Discussion
The extraction of LP from whey by CEC was quite variable, depending on the type of resin and various operational factors.
Poor recoveries of LP activity were found using batch procedures with both resins. Recovery depends on both extraction of protein from the whey and desorption from the resin. While total protein extraction increased with increasing whey volume, the efficiency of extraction declined (Table 1), being below 50% for both resins at the higher whey volumes, and less than 60% at the lower whey volumes. It therefore seems unlikely that the low extraction rates were due to overloading the resins. One possibility for the diminishing efficiency at higher whey volumes, as described by Chiu & Etzel (Reference Chiu and Etzel1997), is that LP that is adsorbed on to the cation exchanger at the initial stage is subsequently displaced by more strongly binding material such as LF and other solutes. Desorption of the LP from the resin was even less efficient, with around 25% of the activity being recovered leading to a final recovery of just over 10% for both resins. The final recovery was slightly greater for SP-650C than CM-25C. Morrison et al. (Reference Morrison, Hamilton and Stotz1957) reported a similar poor recovery (19%) using a batch procedure. One explanation for the poor recovery could be the short resin/whey contact time, however, subsequent experiments (Table 2) indicate that increasing contact time above 20 min had a negligible effect. Longer extraction times (3 h) have been employed in previous studies (Morrison et al. Reference Morrison, Hamilton and Stotz1957; Paul et al. Reference Paul, Ohlsson and Henriksson1980; Hernández et al. Reference Hernández, Markwijik and Vreeman1990) but poor recovery was still recorded. We thus speculate that the poor recovery encountered at higher percentage extraction could be due to either enzyme inactivation or incomplete enzyme desorption. Incomplete desorption has been reported with even five to six successive elutions (Morrison et al. Reference Morrison, Hamilton and Stotz1957).
Enzyme inactivation by higher concentrations of NaCl was thought to be a possible factor affecting enzyme recovery in the batch system. However, enzyme activity was not diminished, and even appeared to increase slightly at NaCl concentrations up to 1 m (Table 3a). Small but significant changes in enzyme desorption with increased salt concentration were also observed (Table 3b). Desorption increased significantly with time up to 60 min, although a large proportion of this was achieved in the first 10 min (Table 4). Incorporating a second elution step gave only a very limited improvement in LP recovery, although this was only carried out at NaCl concentrations up to 0·2 m (Table 5). This is in agreement with Morrison et al. (Reference Morrison, Hamilton and Stotz1957) who reported the presence of enzyme on the resin though in low concentrations after five or six successive elutions were employed. In summary, recovery of LP with batch CEC systems was quite low, although modest improvements were made through increasing contact time for adsorption and desorption, increasing the concentration of elution buffer and number of elution steps. One suggestion for the low recovery could be loss of LP activity due to adsorption of the enzyme onto the glass surfaces, a phenomenon reported by Hernández et al. (Reference Hernández, Markwijik and Vreeman1990).
Recovery efficiencies were much greater using the column procedures. Clearly SP-650C resin has a higher adsorption capacity than CM-25C (Table 6). The adsorption capacities are in broad agreement with Yoshida & Ye-Xiuyun (Reference Yoshida and Ye-Xiuyun1991a) who reported higher capacities with SP-TP than CM-TP columns. Recoveries >90% were seen with both resins as long as they were within the saturation point. Similar recoveries were found by other authors: Yoshida & Ye-Xiuyun (Reference Yoshida and Ye-Xiuyun1991b) recorded a 91·4% recovery in a similar system, while Chiu & Etzel (Reference Chiu and Etzel1997) observed complete removal of LP activity from whey by adsorption onto the ion exchange membrane when loaded whey was within the maximum adsorption capacity of the resin.
SDS-PAGE was carried out on some of the fractions resulting from column and batch methods. Both methods produced fractions predominantly containing a band corresponding to LP or LF, but this method did not permit the distinction of the two proteins. The estimated MWts for LP in both cases compare well with literature data—e.g. 80 000 Da (Uchida et al. Reference Uchida, Dosako, Sato and Kawakami2003); 89 000 Da (Yoshida & Ye-Xiuyun, Reference Yoshida and Ye-Xiuyun1991b). In the column procedure, the lack of resolved bands in fractions suspected to contain LF (Fig. 2a; tracks 4 and 5, Fig. 3) which were collected from the very small peak appearing on the right base line just before the main LP elution peak could be due to either its absence or its presence only in minute concentration. Investigation of the twin peaks of LP activity, seen in Fig. 2a, suggests that the MWts were more or less identical, and provides no evidence of different protein structures. In the batch procedure the bands for LP eluted using different salt concentration were identical. There was no apparent heterogeneity in LP fractions produced by either method. A partial alteration of LP has been reported during isolation resulting in its electrophoretic and chromatographic heterogeneity (De Wit & Van Hooydonk, Reference De Wit and Van Hooydonk1996), but this was not apparent in the current study. The SDS-PAGE (Figs. 3 & 4) images generally show clearer bands for the column isolates compared with batch isolates implying that the column procedure recovers purer fraction than batch procedure.
Reversed phase HPLC provided clear distinction of the LP and LF peaks. In all the CEC fractions investigated, the LP peak appeared to be a singlet with no evidence of heterogeneity. Other authors have reported the occurrence of 2 or more forms of the enzyme in milk (Polis & Shmukler, Reference Polis and Shmukler1953; Morrison et al. Reference Morrison, Hamilton and Stotz1957; Fonteh, Reference Fonteh2001) but this is not supported in the current study.
Most of the CEC fractions of LP activity contained some LF. It is notable that fractions corresponding to A and B-C on Fig. 2 (Figs. 5d & f) contained little detectable LF, while fraction A-B was highly contaminated with LF. Rombatus et al. (Reference Rombatus, Schroeder and Morrison1967) described the purification of a fraction of LP in which the red protein (presumably LF) constituted a major portion of the protein material. The other contaminant of LP isolates was probably a low molecular weight compound reported by Foley & Bates (Reference Foley and Bates1987), which has a retention time of around 4 min. Although the compound was present in almost all fractions, it was more prevalent in the batch isolates (Fig. 5g).
In summary, the two isolation procedures (batch and column) were successful in recovering active LP from cheese whey. The recovery was much greater with column procedures and the purity was higher. However, the production of LP free from LF and other proteins was difficult, although it is possible to assess the extent of contamination by reversed phase HPLC.
The authors would like to thank Commonwealth Universities for financial support.