Introduction
Since the late 1970s, the Netherlands has had a relatively strongly institutionalised culture of early exit from the labour market (Henkens and Kalmijn Reference Henkens, Kalmijn, Blossfeld, Buchholz and Hofäcker2006; Hofäcker Reference Hofäcker2010). Similar to many other countries, early retirement arrangements as well as disability and unemployment benefit schemes have functioned as institutionalised pathways for older workers to bridge the period between the exit from a career job and the entry into the regular old-age pension system (Kohli and Rein Reference Kohli, Rein, Kohli, Rein, Guillemard and Van Gunsteren1991). These exit pathways were to a large extent the result of labour-shedding policies that came into existence in the late 1970s when, under adverse economic conditions, older workers were encouraged to leave the labour market through various early retirement and social security schemes (Ebbinghaus Reference Ebbinghaus2006; Van Oorschot Reference Van Oorschot2007).
By the mid-1990s, the incidence of early exit and low labour market participation among older workers had increasingly become regarded as a threat to the sustainability of pension and care systems, as well as the welfare state as a whole (Hartlapp and Kemmerling Reference Hartlapp and Kemmerling2008; Hofäcker Reference Hofäcker2010; Organisation for Economic Co-operation and Development (OECD) 2006). In 1995, 42.5 per cent of Dutch people between the ages of 55 and 65 were making use of one of the exit pathways, with 23.5 per cent on disability benefits, 13.3 per cent in pre-retirement (VUT) schemes and 5.7 per cent on unemployment benefits (Ebbinghaus Reference Ebbinghaus2006: 138). A series of reforms to close down early exit pathways has taken place since then. Still, early exit pathways had become to such an extent ingrained in cultural norms, expectations and institutional incentives – for both employees as well as employers – that they continued to be a major determinant of lower labour market participation among workers over 55 years old (Henkens and Kalmijn Reference Henkens, Kalmijn, Blossfeld, Buchholz and Hofäcker2006; Hofäcker Reference Hofäcker2010; Visser et al. Reference Visser, Gesthuizen, Kraaykamp and Wolbers2016b ).
National institutional and policy contexts set the conditions and constraints that guide retirement decisions at a micro-level (Hofäcker Reference Hofäcker2010). At the same time, individual characteristics and factors at the firm level determine which retirement options are accessible, available and preferable (Vickerstaff and Cox Reference Vickerstaff and Cox2005: 80). Opportunities for retirement are not and have not been equally spread throughout societies, but have been found to be strongly related to the individual's socio-economic position (Radl Reference Radl2013; Schils Reference Schils2008; Visser et al. Reference Visser, Gesthuizen, Kraaykamp and Wolbers2016b ). Whereas some enjoy possibilities and resources for long and rewarding working lives, others may be compelled to exit early because of health issues or displacement. At the same time, some might be offered attractive options to exit early, e.g. in the form of generous pre-retirement packages, whereas others’ only option is to continue working until the statutory pension age of 65. As a result, there might be voluntary and involuntary early retirement, as well as voluntary and involuntary longer working lives (Anxo, Ericson and Jolivet Reference Anxo, Ericson and Jolivet2012; Dingemans and Henkens Reference Dingemans and Henkens2014; Dorn and Sousa-Poza Reference Dorn and Sousa-Poza2010).
Many studies on the socio-economic drivers of retirement behaviour have focused on retirement or exit as a single transition, event or state (Debrand and Sirven Reference Debrand and Sirven2009; Engelhardt Reference Engelhardt2012; Schils Reference Schils2008; Visser et al. Reference Visser, Gesthuizen, Kraaykamp and Wolbers2016b ) or on retirement as an intention or preference (Dal Bianco, Trevisan and Weber Reference Dal Bianco, Trevisan and Weber2015; Riedel, Hofer and Wögerbauer Reference Riedel, Hofer and Wögerbauer2015; Solem et al. Reference Solem, Syse, Furunes, Mykletun, De Lange, Schaufeli and Ilmarinen2016; Van Dam, Van Der Vorst and Van Der Heijden Reference Van Dam, Van Der Vorst and Van Der Heijden2009). However, the consensus in contemporary research is that retirement is hardly ever a simple and single transition from employment to an old-age pension, but rather a process stretching out over several years (Shultz and Wang Reference Shultz and Wang2011: 170), including a set of changes in work- and labour market-related behaviour (Denton and Spencer Reference Denton and Spencer2009; Moen Reference Moen, Mortimer and Shanahan2003). Retirement does not necessarily mean a sudden and full withdrawal from paid labour, but can also include a reduction in work hours, a move to a less demanding job or the partial take-up of a pension (Borland Reference Borland2005).
One challenge in studying the longitudinal and process-like nature of retirement has certainly been the lack of available detailed longitudinal microdata and the need for relevant analytical tools. In this article, I propose a way of filling a gap in the current research by analysing work-to-retirement trajectories from paid employment towards the receipt of old-age pension benefits of a group of 2,277 Dutch older workers between the of ages 56 and 66 during the period 1999–2011. I slightly adapt Fasang's concept of retirement trajectories as ‘sequences of monthly primary income sources within an age bracket when old age pension entrance is theoretically possible’ (Fasang Reference Fasang2012: 687). The concept of ‘work-to-retirement trajectories’ used in this study includes two additional assumptions: first, workers had to be employed at the baseline of the study; and second, not only old-age pensions entrance was theoretically possible within this age bracket, but workers were at risk of access to any of the identified exit pathways.
Whereas in some definitions and statistics, workers are already considered old at 50 or at an even younger age, the 55–65 age bracket was considered appropriate for analysing older workers’ retirement trajectories (Arts and Otten Reference Arts and Otten2013; OECD 2006). In the case of this study, the age of 56 was selected as the baseline, as a ten-year follow-up period was the optimal solution within the limitations of data availability. In the Netherlands, a substantial proportion of the population was still active in the labour market at the ages of 55–56. At the same time, at the ages of 57–58 workers started to be entitled to definite labour market withdrawal through one of the exit pathways. Hence, from the age of 56, it should be possible to identify the ‘pull’ effect of various social security schemes (Ebbinghaus Reference Ebbinghaus2006).
I apply sequence and cluster analysis to register-based data to identify the main typologies of work-to-retirement trajectories. Subsequently, I analyse the relation between these work-to-retirement trajectories and a set of individual and socio-economic factors at the onset of the trajectories. I investigate whether workers in certain jobs, sectors and types of firms were more likely to end up in some types of trajectories rather than others.
Work and retirement in the Netherlands
Retirement through the old-age pension system
The multi-pillar old-age pension system in the Netherlands consists of two main pillars: a public basic pension (AOW) and ‘supplementary’ occupational pensions (Anderson Reference Anderson and Ebbinghaus2011). The AOW is a nearly universal flat-rate benefit, paid to all who are over 65 years of age and have resided in the Netherlands for 50 years between the ages 15 and 65. Those who have resided in the country for a shorter time receive a reduced benefit, although it is possible to insure oneself for time spent abroad. Occupational pensions provide supplementary earnings-related benefits and are organised per sector, company or profession. Around 2010, they covered around 90 per cent of wage earners. Full entitlements usually require an employment history of around 35–40 years, depending on the pension fund. In 2010, the AOW benefit for a single person was around 70 per cent of the net minimum wage. Supplemented by occupational pensions, the average replacement rate of pension is around 70 per cent of previously earned wages (Anderson Reference Anderson and Ebbinghaus2011: 294). As a result of recent reforms, the eligibility age for AOW will gradually increase towards 66 in 2018 and 67 in 2021.
Early retirement
Since the early 1980s, the Netherlands had a rather generous system of early retirement schemes (VUT) regulated by collective agreements in the services and manufacturing sectors (Van Oorschot Reference Van Oorschot2007). Most VUT schemes offered early retirement between the ages of 58 and 60 with a replacement rate of around 75–80 per cent of previously earned wages. The government subsidised early retirement by offering tax exemption of premiums. From 1997, the VUT schemes were to be phased out and replaced by less generous and actuarially fairer pre-pension schemes, which were capital funded instead of pay-as-you-go. In 2006, the fiscal benefits of these schemes were abolished, making early retirement even less attractive.
Disability benefits
Disability benefits (WAO) have been an important alternative exit pathway out of the labour market since the 1980s. Its rather generous benefits were earnings-related, its duration depended on age and work history (up to six years for those over 58), recipients were exempt from job-seeking obligations and occupational pension rights continued to be accrued during the period of receipt (Van Oorschot Reference Van Oorschot2007). After a series of smaller adjustments in the 1990s and early 2000s, the whole disability benefit scheme was overhauled and WAO changed into the new WIA in 2006. Entitlements became subject to stricter screening, while disabled workers were required to be available for work according to their capacity. Major responsibilities for re-employment of the sick and disabled were shifted to the employer.
Unemployment benefits
Unemployment benefits (WW) have not been as important an exit pathway as early retirement and disability, but were nevertheless designed in such a way that they provided disincentives for older workers to return to work from unemployment. Again, the entitlement has been related to work history and previous earnings. Between 1987 and 2003, a so-called ‘follow-up benefit’ existed that entitled older claimants to another three and a half years flat-rate non-means-tested benefit after the maximum duration of the earnings-related WW's five years expired, effectively bridging the period until the standard retirement age (Van Oorschot Reference Van Oorschot2007). This ‘follow-up benefit’ was abolished in 2003. In 2004, stricter job-search efforts were introduced as a precondition for entitlement to unemployment benefits for those older than 57.5 years old (Lammers, Bloemen and Hochguertel Reference Lammers, Bloemen and Hochguertel2013). This further reduced the significance of unemployment benefits as an exit pathway.
Women in the labour market and in retirement
The Netherlands has traditionally been a male-breadwinner society, where men worked and women stayed home. The Dutch welfare state, including the pension system, was largely designed to meet the needs of single-earner households. Pensions, for example, were paid to households on the basis of the employment and earnings history of the husband only (Anderson Reference Anderson and Ebbinghaus2011). However, since the 1980s, labour market participation among women has risen significantly, including among those aged 55–65. Whereas in 1992 the net labour market participation of women aged 55–65 was only 17.7 per cent (as compared to 58.3 per cent of the men in the same age group), by 2012 this percentage had increased to 55.1 (80.4 per cent for men) (CBS 2015).
Similar to other countries, a large proportion of women work part-time and women tend to have longer breaks in their employment histories due to motherhood and child-care tasks (Arts and Otten Reference Arts and Otten2013; Fasang, Aisenbrey and Schömann Reference Fasang, Aisenbrey and Schömann2013). Even though in the 1980s the AOW and occupational pensions were reformed to better reflect the participation of women in the labour market and offer equal rights to pensions in the case of part-time work, women have continued to accumulate lower entitlements due to their shorter work histories. Moreover, studies have found that women synchronise their retirement decisions with their older spouses (Denaeghel, Mortelmans and Borghgraef Reference Denaeghel, Mortelmans and Borghgraef2011). Until recently, Dutch couples where the husband retired at the age of 65 would receive a supplement to the AOW if the spouse had not yet reached 65, encouraging women to exit the labour market as well. Finally, older women are more likely to leave work when their husband retires or take up care tasks for ageing parents or spouses (Henkens and Van Solinge Reference Henkens and Van Solinge2002). Therefore, labour market activity is still much lower among older women than among men.
Factors at the firm level
Moreover, as Guillemard and Van Gunsteren (Reference Guillemard, Van Gunsteren, Kohli, Rein, Guillemand and Van Gunsteren1991) argued in the early 1990s, much of the decision-making power on retirement resides neither with the state nor with the individual, but has shifted to the discretion of the employer (see also Hofäcker Reference Hofäcker2010: 45; Vickerstaff and Cox Reference Vickerstaff and Cox2005: 80). In the Netherlands, welfare state reforms in the 1990s and 2000s have been aimed at transferring responsibilities for workers’ employment and welfare from the state to the domain of employers, especially with regard to sickness and disability (Vrooman Reference Vrooman2010). Moreover, physical working conditions as well as psycho-social factors in the workplace have been found to either create possibilities for continuing careers or push workers out from the labour force (Dal Bianco, Trevisan and Weber Reference Dal Bianco, Trevisan and Weber2015; Van Solinge and Henkens Reference Van Solinge and Henkens2014), while potentially moderating the effects of poor health on labour market exit (Van den Berg, Elders and Burdorf Reference Van den Berg, Elders and Burdorf2010). Therefore, it is important to take into account factors at the firm level as well when analysing the effects of retirement arrangements on individual trajectories (Conen, Henkens and Schippers Reference Conen, Henkens and Schippers2014).
Entitlements, freedom of choice and socio-economic position
An individual's use of exit pathways can be broadly related to two aspects: entitlement and freedom of choice (Schils Reference Schils2008: 318). Entitlement includes the fulfilment of certain criteria that grant the older worker access to various pension and benefit schemes. In a country like the Netherlands, with a long tradition of corporatism, sectoral-level collective bargaining and Bismarckian-type earnings-related social insurance schemes, access to different exit pathways is largely determined by an individual's work history and accumulation of contributions. On the other hand, the decision to exit the labour market might not be up to the workers themselves, but be the result of factors outside their own control. The freedom to choose might be limited, e.g. by an individual's sickness, disability or skill inadequacy, whereas displacement or age discrimination by employers can ‘push’ an older worker out from the labour market (Ebbinghaus Reference Ebbinghaus2006).
One's entitlements and choice of retirement timing might not coincide. Moreover, studies have found that both aspects as well as their coincidence – and lack of coincidence – are related to workers’ individual characteristics and socio-economic positions, albeit often with mixed results (Radl Reference Radl2013; Schils Reference Schils2008; Solem et al. Reference Solem, Syse, Furunes, Mykletun, De Lange, Schaufeli and Ilmarinen2016). I identify four combinations of entitlement and freedom of choice to classify different types of retirement. First of all, when one is entitled to retire early and chooses to do so, this can be labelled voluntary early retirement. Early exit through early retirement schemes is usually the prime example of a voluntary exit route from the labour market, in which older workers take the opportunity of retirement that is presented to them (Radl Reference Radl2013; Schils Reference Schils2008). Given that the Dutch VUT schemes mainly existed in manufacturing and services, it is expected that early retirement dominates in these sectors and among related occupations. For the Netherlands, however, no strong evidence has been found for this sectoral influence (Visser et al. Reference Visser, Gesthuizen, Kraaykamp and Wolbers2016a ). In a cross-national study, Radl (Reference Radl2013) did confirm that manual workers and lower sales and service workers were more likely to enter into voluntary retirement. Debrand and Sirven (Reference Debrand and Sirven2009) found in their study that public-sector employees were more likely to retire earlier.
Early retirement is less likely to be found among groups with shorter work and contribution histories, especially women (Schils Reference Schils2008) and immigrants (Visser et al. Reference Visser, Gesthuizen, Kraaykamp and Wolbers2016b ). The size of the firm might matter, as larger companies often have had better coverage and enforcement of collective agreements which give better access to early retirement schemes (Naschold and De Vroom Reference Naschold and De Vroom1994). Riedel, Hofer and Wögerbauer (Reference Riedel, Hofer and Wögerbauer2015) found that employees in larger firms were more likely to at least plan for earlier retirement than those in smaller companies.
Second, in the case of voluntary non-retirement, one may be entitled to retire but choose not to. Voluntary non- or late retirement is expected to be found especially among groups in society that have had long and steady careers, but still find satisfaction in the continuation of their work and have the resources and capacity to do so (Higgs et al. Reference Higgs, Mein, Ferrie, Hyde and Nazroo2003; Mor-Barak Reference Mor-Barak1995). Several studies have found that level of education has a positive effect on employment of older workers (Debrand and Sirven Reference Debrand and Sirven2009; Engelhardt Reference Engelhardt2012; Radl Reference Radl2013; Visser et al. Reference Visser, Gesthuizen, Kraaykamp and Wolbers2016a , Reference Visser, Gesthuizen, Kraaykamp and Wolbers2016b ), whereas those with higher education have later planned as well as preferred retirement ages (Riedel, Hofer and Wögerbauer Reference Riedel, Hofer and Wögerbauer2015; Solem et al. Reference Solem, Syse, Furunes, Mykletun, De Lange, Schaufeli and Ilmarinen2016). In addition, higher education has been found to be related to better health at later age (Leopold and Engelhardt Reference Leopold and Engelhardt2011), while the higher educated find better opportunities for employment and re-employment in their late careers (Schuring et al. Reference Schuring, Robroek, Otten, Arts and Burdorf2013). Henkens and Kalmijn's (Reference Henkens, Kalmijn, Blossfeld, Buchholz and Hofäcker2006) findings that workers in higher non-manual positions are less likely to exit early, and Riedel, Hofer and Wögerbauer's (Reference Riedel, Hofer and Wögerbauer2015) results that those employed in personal services plan later retirement, also fit this pattern.
Third, when one prefers to retire but cannot, because of a lack of (sufficient) entitlements, this can be called involuntary non-retirement. Even if entitlements have been accrued, the generosity of pension benefits might be so low that continued work is a financial necessity (Higgs et al. Reference Higgs, Mein, Ferrie, Hyde and Nazroo2003; Schils Reference Schils2008). In the Dutch case, eligibility to early retirement schemes has been dependent on the length of the employment history. As a result, women tend to have lower entitlements to (early) pensions and their pension benefits are likely to be lower, as their work histories have usually been shorter than men's (Fasang, Aisenbrey and Schömann Reference Fasang, Aisenbrey and Schömann2013; Schils Reference Schils2008). A second group that is less likely to have worked a sufficient number of years for entitlement to early retirement are first-generation migrants. Additionally, for them, a reduction of AOW benefits as a result of a shorter period of residence in the country increases the risk that they need to continue work even after 65 (Anderson Reference Anderson and Ebbinghaus2011).
The self-employed in the Netherlands do not automatically accrue pensions like employees and as a result often have poorer pension entitlements. Moreover, in the past they have not been covered by any of the VUT schemes. Studies have confirmed that the self-employed are less likely to exit the labour market early, both in the Netherlands as well as from a cross-national perspective (Debrand and Sirven Reference Debrand and Sirven2009; Engelhardt Reference Engelhardt2012; Henkens and Kalmijn Reference Henkens, Kalmijn, Blossfeld, Buchholz and Hofäcker2006; Schils Reference Schils2008). Studies have also found that in agriculture, where self-employment is prevalent, the incidence of late retirement is more common (Henkens and Kalmijn Reference Henkens, Kalmijn, Blossfeld, Buchholz and Hofäcker2006; Riedel, Hofer and Wögerbauer Reference Riedel, Hofer and Wögerbauer2015). It is possible that many self-employed people also voluntarily choose to retire late, but because of the low coverage of entitlements there is still a high probability of involuntariness.
Finally, involuntary retirement occurs when, regardless of entitlements, one would prefer to continue working but is compelled to retire. In the literature, involuntary (early) retirement is usually represented by exit through disability or unemployment benefit schemes (Radl Reference Radl2013; Van Rijn et al. Reference Van Rijn, Robroek, Brouwer and Burdorf2014). After all, people rarely become ill or displaced out of their own choice. Nevertheless, in the case of chronical or severe illness, exit through a disability pension can be voluntary, or at least a relief. Moreover, the Dutch disability benefits scheme, at least until 2006, has been criticised for offering an easy and attractive way for both employers and employees to shed older workers. In any case, it is likely that in certain sectors and professions, such as in manufacturing, construction or other heavy manual work, health issues are more prevalent than in others and increase the likelihood of exiting through disability (Visser et al. Reference Visser, Gesthuizen, Kraaykamp and Wolbers2016a ).
Since 1992, the WAO insurance premium for employers had been linked to the number of disabled employees, hence there was an incentive for employers to keep the outflow through disability benefit schemes low. Since 2006, the employer has carried the brunt of the responsibility for the re-integration of disabled workers. In manufacturing companies it might be more difficult to find a suitable replacement position for someone who has limited capacities to do manual work (Schreurs et al. Reference Schreurs, Van Emmerik, De Cuyper, Notelaers and De Witte2011). Moreover, larger firms are likely to have more resources and possibilities than small companies to adjust a partially disabled worker's tasks or work environment (Conen, Henkens and Schippers Reference Conen, Henkens and Schippers2014).
Unemployment has been more common in certain ‘declining sectors’, in particular manufacturing (Visser et al. Reference Visser, Gesthuizen, Kraaykamp and Wolbers2016a , Reference Visser, Gesthuizen, Kraaykamp and Wolbers2016b ). Blue-collar workers have been found to retire earlier than they would have preferred, indicating that they more often exit through involuntary routes (Solem et al. Reference Solem, Syse, Furunes, Mykletun, De Lange, Schaufeli and Ilmarinen2016). At the same time, unemployment is usually least common in the public sector, which offers relatively secure jobs compared to the private sector. Also, unemployment is more common among those older workers with lower education and skills (Henkens and Kalmijn Reference Henkens, Kalmijn, Blossfeld, Buchholz and Hofäcker2006; Radl Reference Radl2013; Visser et al. Reference Visser, Gesthuizen, Kraaykamp and Wolbers2016b ). Finally, Visser et al. (Reference Visser, Gesthuizen, Kraaykamp and Wolbers2016b ) found that first-generation immigrants were more likely to exit the labour market through unemployment as well as disability.
Data and methods
Retirement as a trajectory and sequence analysis
Whereas traditionally retirement has been researched as a single state or event, in the context of exit pathways the process of retirement may consist of several states and transitions that are interrelated. In this article I apply the concept of work-to-retirement trajectory. From a lifecourse perspective, Aisenbrey and Fasang (Reference Aisenbrey and Fasang2010: 421) argued, the ‘trajectory’ is a ‘theoretically superior concept’ to ‘transition’, as it emphasises the continuity within a series of events. Trajectories are shaped by historical and institutional structures as well as closely interlinked with peoples’ personal and professional spheres (Aisenbrey and Fasang Reference Aisenbrey and Fasang2010: 421).
These individual trajectories differ amongst each other in terms of timing of transitions and the complexity within each sequence of transitions (Fasang Reference Fasang2012). The most simple and standard retirement trajectory can be thought of as a single transition from employment to retirement at the statutory retirement age. Timing can differ, however, as some people retire early, while others continue working even when entitled to an old-age pension. The complexity of trajectories increases with the number of transitions. Many people do not make a single transition from work into retirement, but experience a series of transitions in and out of work and non-employment multiple times.
Therefore, a trajectory consists of a sequence of different states and transitions. In theory, each individual sequence is unique. However, some sequences are more similar than others. Applying sequence analysis allows the identification of which sequences are more similar and which ones are more dissimilar (Abbott Reference Abbott1995). Sequence analysis is closely related to the theoretical trajectory concept and can be used as a tool to identify typologies from longitudinal categorical data. Sequence analysis is a method within the algorithmic statistical tradition. It allows the detection of patterns in data and the identification of the processes that produce them, without making prior assumptions about the processes that generate the data (Aisenbrey and Fasang Reference Aisenbrey and Fasang2010: 425).
Sequence data
The target population for this study was selected from the Labour Force Survey (in Dutch: Enquête beroepsbevolking – EBB) that is collected on a yearly basis by Statistics Netherlands. Criteria for selection were that the respondent had to be born in 1943, 1944 or 1945 and that he or she was employed or self-employed in the year of turning 56 (i.e. 1999, 2000 and 2001). This yielded a total sample of 2,277 cases.
The selection of this cohort group was based on the availability of municipal register data on monthly income statuses (in Dutch: Personen sociaaleconomische categorie – SECMBUS) for an as broad as possible time bracket. As this data-set was available for the period 1999–2011 at the time of performing the study, it was decided to include the above-mentioned three birth years and follow this particular cohort from the age of 56 to 66. The condition of being in paid employment in the year of turning 56 was set because the study focuses on the transition process from work to retirement. The part of the population that was inactive at 56 was thus excluded from this study. The age of 66, and not 65, was selected for the end of the follow-up period to capture the possibility that people did not stop working immediately once they had reached their statutory retirement age.
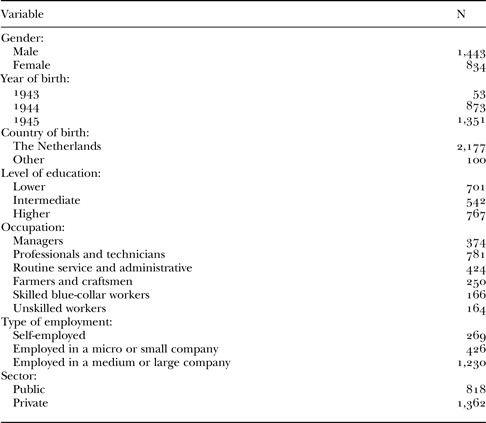
Given that labour market participation among women within this age group was lower at that age than among men, the sample included more men than women (1,443 and 834 cases, respectively). Men and women were analysed together, as the main emphasis of study is on the trajectories of all older workers from work towards retirement. Commonalities and differences between men and women were controlled for in the subsequent analyses.
The register data recorded 11 different main sources of income. In order to reduce this variation, some statuses were merged to reduce their number to six. These are: employment (including self-employment), disability and sickness benefits, unemployment benefits, social assistance schemes, retirement pension and other (including those with no direct source of income). Unfortunately, the data did not provide any distinction between income from VUT, AOW or occupational pensions, nor was it possible to distinguish between part-time and full-time retirement.
Sequence analysis
The first aim of the empirical analysis was to create sequences of the monthly main sources of income from the month of turning 56 until the month of turning 66. Sequences thus consisted of 121 subsequent statuses in total. Optimal matching techniques were used to measure the similarities and distances between sequences. Optimal matching does so by calculating the costs of the minimal amount of operations, in terms of insertions, deletions and substitutions, required to change one sequence into another (Gabadinho et al. Reference Gabadinho, Ritschard, Studer and Müller2010). Substitution costs are used to indicate how similar a status within two sequences is at a specific point in time. In this analysis, transition rates have been used as the cost matrix. This means that substitution costs between two states have been defined by the likelihood that one state at t is followed by the other state at t + 1 (where the cost of substituting one state with the same is always 0). The advantage of this method over setting the substitution costs as constant or setting the values manually is that the data decide how ‘incompatible’ each pair of states is on the basis of the transitions between them. Indel costs assign a weight to whether a similar status occurs in two sequences at all, irrespective of its timing. Indel costs were set at default in the analysis, as the similarity of timing of each of the states and their transitions mattered, not whether a similar state occurred in two sequences in general (Aisenbrey and Fasang Reference Aisenbrey and Fasang2010: 426).
Subsequently, to group together the most similar sequences and separate the dissimilar ones, the Ward method for clustering was used. The optimal number of clusters was decided on by analysing the various solutions against the background of earlier studies and Dutch population statistics, while at the same time comparing the quality of various partitions using the measures that are available in the WeightedCluster library in R (Studer Reference Studer2013). Ultimately, a seven-cluster solution was chosen, which had the optimal scores on the Point Biserial Correlation (0.65) and Average Silhouette Width (0.46) measures. While the latter is not particularly high and entails a risk of a weak and artificial structure (Studer Reference Studer2013), the seven-cluster solution nevertheless was also found most realistic against the background of the various exit pathways in the Netherlands.
Explanatory variables and multinomial logistic regression analysis
As a second step in the empirical analysis, the likelihood of an individual entering a certain trajectory was analysed on the basis of a set of individual-level and socio-economic variables. Each of the explanatory variables were taken from the Labour Force Survey from the year in which the person turned 56, hence at the beginning of the trajectory. This has as a limitation that the analysis cannot account for job changes that resulted in a shift of occupation, sector or company, but it can provide a reasonable estimation of how socio-economic conditions at the beginning of a trajectory affected its continuation.
Type of occupation was divided into seven categories: managers, professionals and technicians, routine administrative and service jobs, craftsmen and farmers, blue-collar workers, and unskilled workers. This division was based on the ten categories in the International Standard Classification of Occupations (ISCO-08), although some categories had to be merged due to their small sizes. Merging was decided on the basis of similarities in sector, required education, level of authority and nature of tasks (routine versus non-routine). Type of employment was divided into three categories: self-employed, employed in a micro or small company (<50 employees), or employed in a medium or large company (⩾50 employees). A division was made between workers in the public and private sector. Division into more sectors (i.e. agriculture, manufacturing, commercial services and non-commercial services) would have resulted in high multicollinearity with the ‘occupation’ variable. Control variables for gender, year of birth, country of birth and education were included as well. A measure for highest attained level of education is divided into three categories: lower (only primary level education), intermediate (secondary education) and higher (tertiary education). Descriptive statistics are provided in Table 1.
Descriptive statistics of the sample, Labour Force Survey data for men and women aged 56–66, 1999–2011

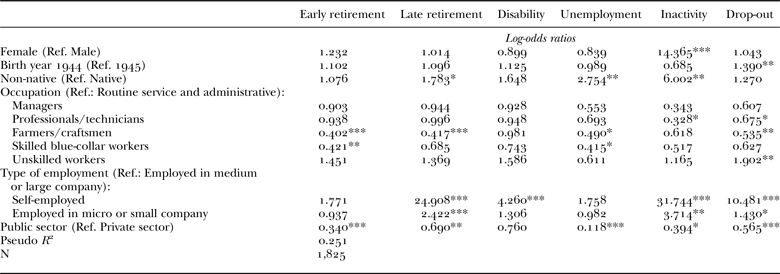
Multinomial logistic regression was applied to analyse the probability of entering a certain trajectory. Two separate models were run. The first included only control variables, including education level. The second model included all the explanatory and control variables, excluding education level. The latter was done because of the strong multicollinearity of education with the occupation categories. In the second model, the category of birth year 1943 was dropped, because of the lack of valid observations. Overall, N was smaller in the multinomial logistic regression models (2,010 and 1,825, respectively) due to missing values in the Labour Force Survey data.
Findings
Work-to-retirement trajectories
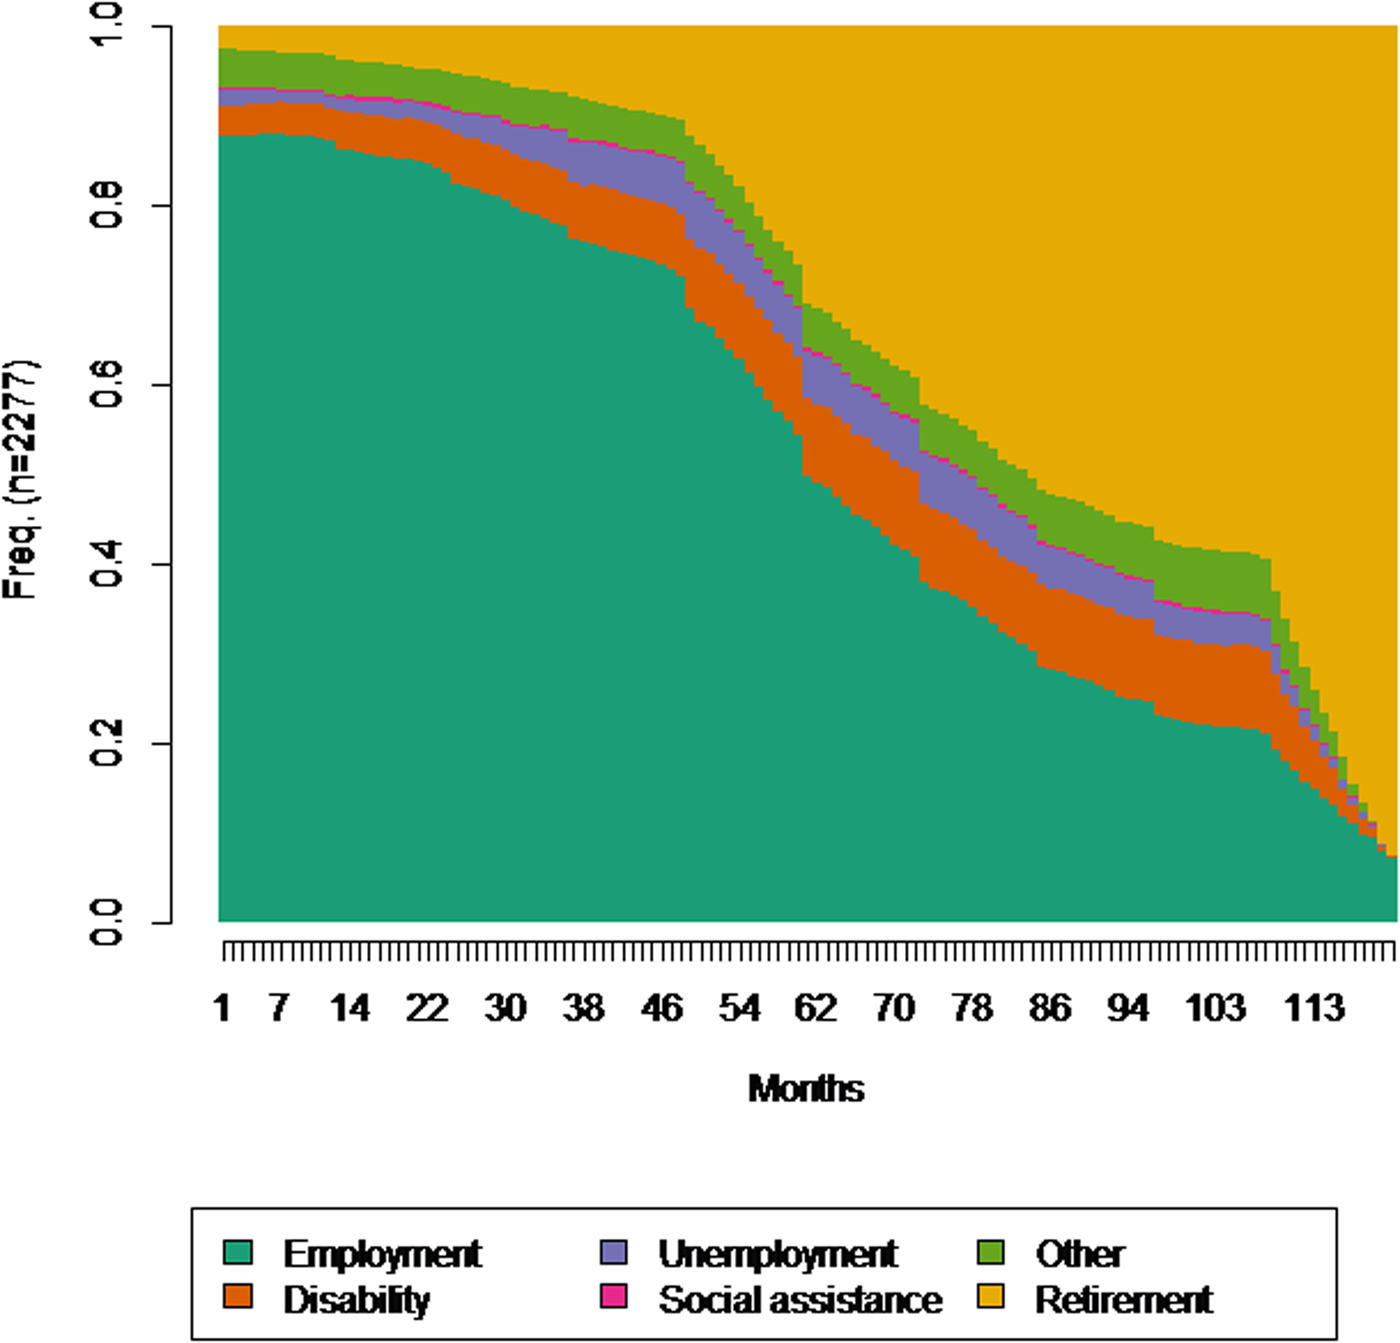
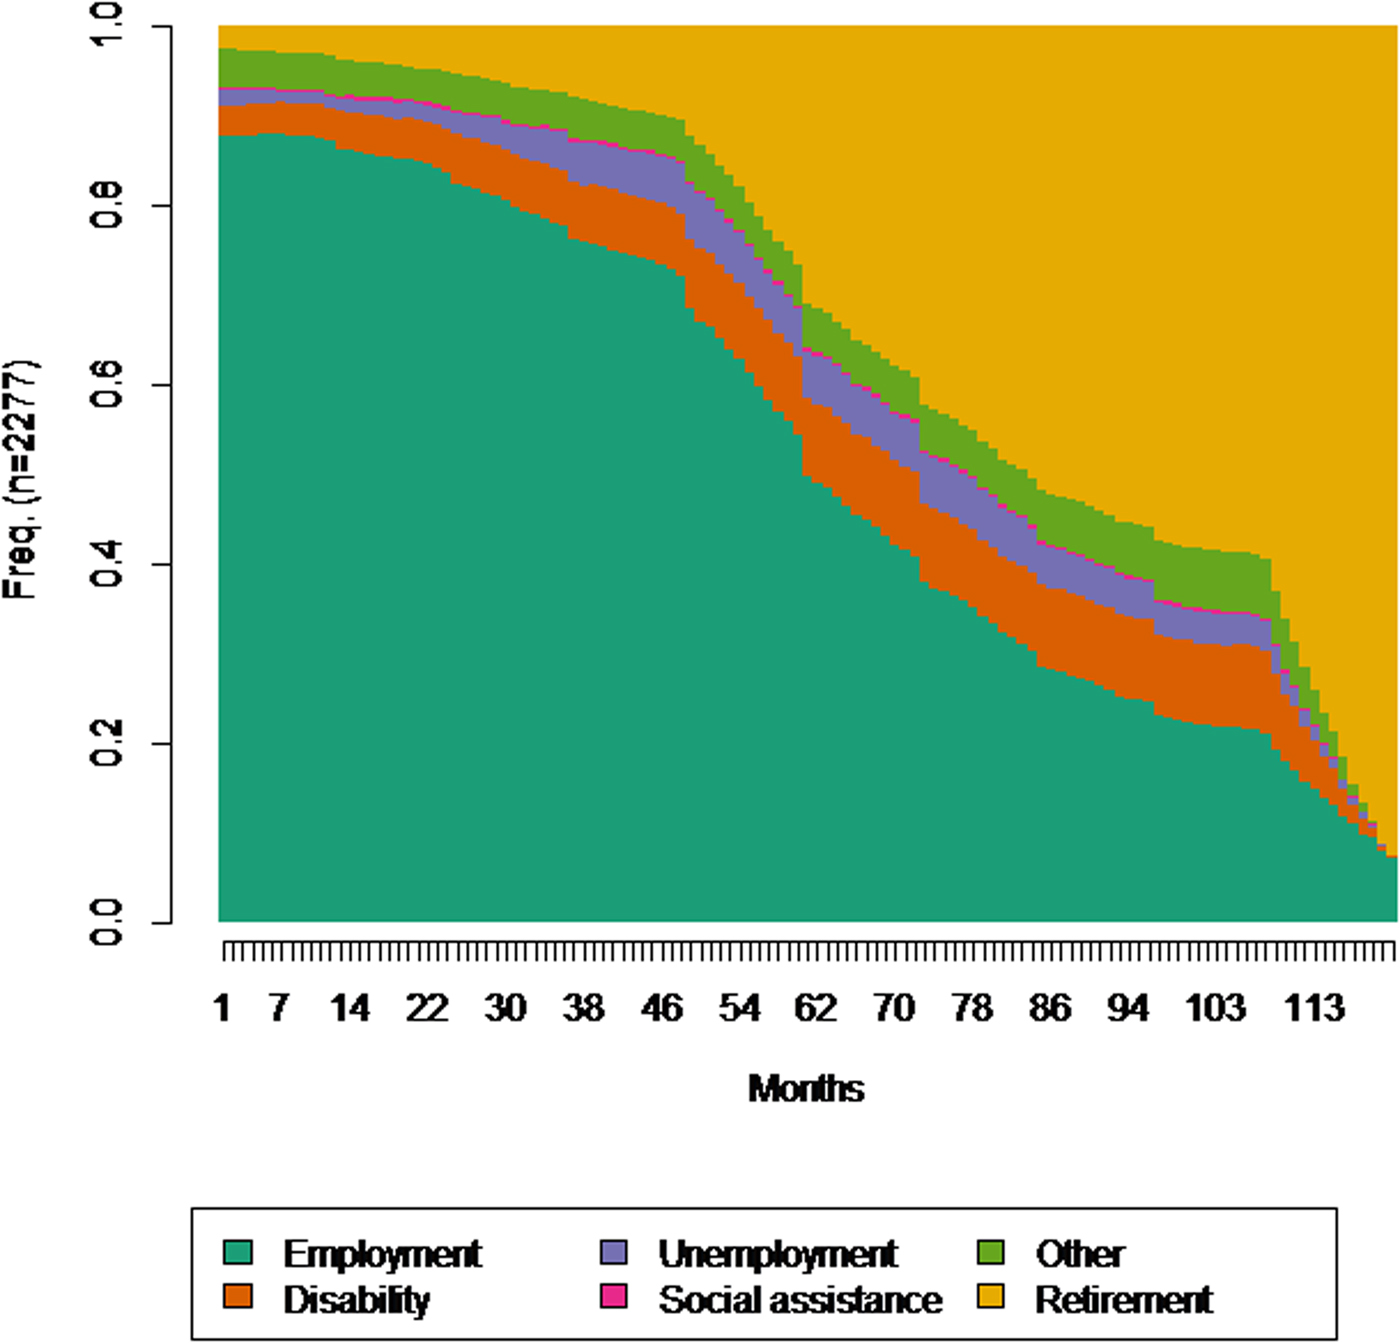
Figure 1 shows the state distribution of the entire target population for the whole follow-up period in months, where 1 is the month of turning 56 and 121 is the month of turning 66. In month 1, 87.7 per cent of the sample were employed or self-employed, 3.2 per cent were receiving disability benefits, 1.8 per cent were unemployed, 0.3 per cent received unemployment benefits, 2.6 per cent received no or another type of income, and only 0.3 per cent received their main income from pension benefits. By the time of turning 66, the largest group of 87.3 per cent received pension benefits and only 6.8 per cent had employment as their main source of income. The other group proportions are zero or close to zero. The employment rate slowly decreased until the age of 60 (month 48), when it started to drop more steeply. The amount of people receiving disability benefits and entering into inactivity still slightly rose until the age of 65 (month 108). After turning 65 the large majority of individuals rapidly transitioned into retirement.
State distribution plot, total target population (t1 = month of turning 56 until t121 = month of turning 66).
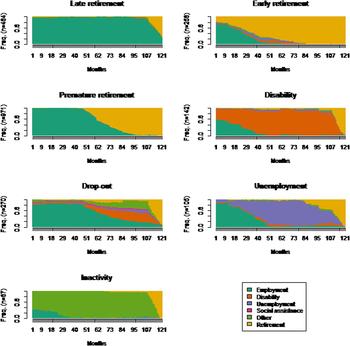
Optimal matching techniques and cluster analysis yielded the seven clusters that are depicted in the state distribution plots of Figure 2. I have named the clusters according to the type of work-to-retirement trajectory they represent. The first trajectory is ‘late retirement’ (N = 464), consisting of those who worked until the age of 66 or retired soon after turning 65. This category worked until the statutory retirement age, after which they took up their old-age pensions. ‘Early retirement’ (N = 258) consists of those individuals who exited the labour market before the age of 60, some of whom experienced a shorter period of disability or unemployment first. This group most likely predominantly used the VUT early retirement schemes for labour market withdrawal. The largest cluster has been named ‘premature retirement’ (N = 971). These workers exited later than the ‘early retirees’ (after 59) and appear to have made a direct transit from work to retirement. They retired earlier than the ‘late retirees’ however, i.e. before the age of 64. This group of workers possibly used VUT schemes or the flexibility of their supplementary pensions to exit the labour market early.
State distribution plots, seven cluster solution (t1 = month of turning 56 until t121 = month of turning 66).

The fourth cluster (N = 142) represents individuals who experienced episodes of disability before entering into an old-age pension around the age of 65. The ‘drop-out’ trajectory (N = 270) represents a heterogeneous group within which a substantial part of the cases had spells of missing states. It includes individuals that died or that disappeared from the data for a longer period of time. This makes it difficult to characterise the cluster exactly, hence some caution is needed in its further analysis. The sixth cluster was entitled ‘unemployment’ (N = 105), in which individuals experienced spells of unemployment, mostly starting before the age of 60 until entering retirement between the ages of 63 and 65. It shows that, even though unemployment benefits might not have served as a major exit pathway, those who became unemployed after 56 did tend to remain in unemployment until entering into early retirement or old-age pensions. The final and smallest cluster was named ‘inactivity’ (N = 67), whose individuals did not receive any direct income between leaving their last job and receiving an old-age pension soon after the age of 65.
Multinomial logistic regression models
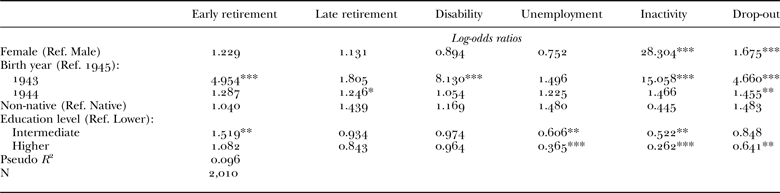
Table 2 shows the results of the first multinomial logistic regression model with individual-level control variables. The premature retirement trajectory was used as the reference category, as it represented the largest group and seemingly the most ‘standard’ retirement pattern. The results indicate that women were much more likely to end up in inactivity and somewhat more likely in the drop-out trajectory. The former is in accordance with the expectation that women have less entitlement to benefits and early retirement pensions than men, whereas they more often rely on their husband's earnings or pensions. However, on the basis of these data it is not possible to know the exact cause of their labour market inactivity. Although the 1943 cohort was a small group within the sample, it was more inclined to exit the labour market early, either through retirement or disability, but also by becoming inactive with no income. Being an immigrant showed no relation with any type of trajectory in this model.
Results of multinomial logistic regression analysis of entering various work-to-retirement trajectories, individual-level variables

Notes: The premature retirement trajectory was used as the reference category. Ref.: reference category.
Significance levels: * p < 0.1, ** p < 0.05, *** p < 0.01.
Conforming to expectations, those who attained intermediate or higher levels of education were less likely to enter the unemployment, inactivity and drop-out trajectories than workers with only lower education. This suggests that the lower skilled were more likely to be pushed into unemployment and experience more unstable work histories that pushed them into inactivity with no entitlement to any types of benefit or pension. Those with intermediate-level education were somewhat more likely to retire early. This might be the effect of those having a vocational education degree being more likely to work in sectors with good coverage of collective agreements. At the same time, they might not have had the types of satisfactory and autonomous jobs that the higher educated more commonly enjoy and that would have motivated them to extend their working lives.
Table 3 shows the results of the second multinomial regression model with more specific socio-economic variables included. In this model, women were still more likely to end up in the inactivity trajectory. Those who were born in 1943 were excluded from the sample, because of the low number of cases. The only significant difference between the remaining two birth years was that those born in 1944 were more likely to drop out. The position of non-native older workers was shown to be more precarious than that of natives: they were more likely to retire late, enter into unemployment or become inactive.
Results of multinomial logistic regression analysis of entering various work-to-retirement trajectories, including socio-economic variables

Notes: The premature retirement trajectory was used as the reference category. Ref.: reference category.
Significance levels: * p < 0.1, ** p < 0.05, *** p < 0.01.
Compared to older workers in routine service or administrative jobs (the reference category), managers and professionals/technicians tended to be less likely to enter any of the trajectories, although most of these differences proved to be insignificant. Professionals and technicians were only less likely to enter into inactivity and drop-out at a significance level of p < 0.1, confirming to some extent that these are rather secure occupations with a good accumulation of entitlements. Farmers and craftsmen were less likely to take any of the other trajectories than ‘premature retirement’. They were less likely to retire early, but also less likely to retire late. Moreover, they were significantly less likely to take the unemployment trajectory (p < 0.1) and the drop-out trajectory (p < 0.05). Blue-collar workers were found to be, perhaps somewhat surprisingly, less likely to retire early and less likely to enter retirement via the ‘unemployment’ trajectory (albeit at the p < 0.1 level). It had been expected that due to the decline of the manufacturing sector, blue-collar workers would retire earlier or exit through unemployment. Unskilled workers were more likely to drop out. Interestingly, there are no significant differences between occupations in regard to exit through disability benefits, even though it was expected that in occupations that involve more physical hard work, disability would have been more common.
Among the different types of employment, the self-employed stand out the most. Those who were self-employed at the start of the trajectory were more likely to retire late, to access disability benefits, to become inactive and to drop out from the sample. As expected, the self-employed worked longer, possibly because of lower entitlements to early retirement schemes. Disability benefits did offer them a way to leave the labour market early, although it is unknown whether the self-employed suffered greater health problems than those who were employed. Lower levels of entitlements could have also led to the high incidence of inactivity among those who were self-employed. Older workers in micro and small companies were more likely to retire late or become inactive in the years before retirement, possibly because of lower coverage of early retirement schemes in these smaller firms. Finally, workers in the public sector were less likely to retire either late or early. At the same time, they were less likely to become unemployed, become inactive or drop out.
Conclusions and discussion
This article investigated how institutional exit pathways combined with socio-economic factors have shaped the individual work-to-retirement trajectories of a cohort of Dutch older workers. Using an innovative approach by applying sequence and cluster analysis, a set of seven distinct trajectories was identified. These trajectories showed that even though there are a large variety of retirement processes among individuals, they can be reduced to a smaller number of typologies that are similar in the timing of transitions and complexity of sequences. The structural influence of exit pathways was visible in shaping the trajectories, especially in the ones related to early and premature retirement, disability and unemployment. These pathways offered a way out, whereas little movement back into the labour market was observed.
The results suggested that in the Dutch context, where social security is mostly earnings-related as well as dependent on work history and sector of employment, not everyone was equally likely to take up each of the exit pathways. Some of the findings were in line with those of previous studies. Workers with lower education were more likely to exit through the unemployment pathway, confirming the expectation that they were more likely to work in ‘declining sectors’ and that their skills were insufficient for finding continuous and secure employment (Henkens and Kalmijn Reference Henkens, Kalmijn, Blossfeld, Buchholz and Hofäcker2006; Visser et al. Reference Visser, Gesthuizen, Kraaykamp and Wolbers2016b ). First-generation immigrants were more likely to become unemployed, which might also be due to their overall lower levels of educational attainment and often more precarious labour market position (Visser et al. Reference Visser, Gesthuizen, Kraaykamp and Wolbers2016b ). There is some evidence for this effect, as no significant results were found for the ‘non-native’ variable in Table 2 when controlling for level of education.
Similar to previous studies, the self-employed were found to be more likely to retire late (Engelhardt Reference Engelhardt2012; Henkens and Kalmijn Reference Henkens, Kalmijn, Blossfeld, Buchholz and Hofäcker2006; Schils Reference Schils2008). This finding could be attributed to the lack of entitlement accumulation for early retirement schemes and old-age pensions, leading to involuntary continuation in the labour market. Workers in the public sector were less likely than private-sector workers to continue work until the age of 65 (Debrand and Sirven Reference Debrand and Sirven2009), although they were also less likely to retire before the age of 60. It is possible that due to the important role of collective agreements in the public sector, workers are able to retire before the statutory retirement age, but that there is little flexibility in their retirement programmes to retire much earlier or later.
Some of the findings were at odds with previous studies and contrary to expectations. Skilled blue-collar workers were found to be less likely to retire early, whereas other studies showed opposite results (Radl Reference Radl2013; Solem et al. Reference Solem, Syse, Furunes, Mykletun, De Lange, Schaufeli and Ilmarinen2016). Moreover, there was some evidence that they were less likely to enter the ‘unemployment’ trajectory, which would be contrary to the ‘declining sector’ hypothesis (Visser et al. Reference Visser, Gesthuizen, Kraaykamp and Wolbers2016b ). It is possible, however, that skilled blue-collar workers, similarly to public-sector workers, work in a sector where the role of collective bargaining is strong, resulting in rather secure jobs but offering little flexibility in retirement decisions. Overall, the results show only few and significantly weak differences between occupations in the take-up of the trajectories. As the possibilities with this data-set were limited, future research could adopt different classifications or use different operationalisations of social class concepts to analyse whether differences can be identified (Radl Reference Radl2013; Visser et al. Reference Visser, Gesthuizen, Kraaykamp and Wolbers2016a ).
A second overall remarkable finding was the lack of significant determinants for take-up of the ‘disability’ trajectory. In previous studies, disability has been found to be more common among older workers with lower education levels and from lower social classes, as well as among immigrants (Haukenes et al. Reference Haukenes, Mykletun, Knudsen, Hansen and Maeland2011; Henkens and Kalmijn Reference Henkens, Kalmijn, Blossfeld, Buchholz and Hofäcker2006; Radl Reference Radl2013; Visser et al. Reference Visser, Gesthuizen, Kraaykamp and Wolbers2016b ). In this study there was no direct evidence for this. The ‘disability’ trajectory was, however, more common among the older of the cohort (born 1943) and among the self-employed. The former is not surprising, as general health improves with each generation, while Dutch reforms have limited access to sickness and disability benefits for the younger cohorts. The latter could suggest that, although it is possible that the self-employed are more likely to have poor health and become disabled, the disability pathway offers a possibility of early exit for the self-employed in the absence of entitlements to early retirement schemes. More research is needed on the extent to which early exit through disability benefits has really been voluntary or involuntary for specific groups and whether this has changed as a result of the reforms in the 2000s.
The distinction between voluntary and involuntary exit is not always straightforward. Following earlier studies, early retirement through VUT and pre-pension schemes has been labelled as a voluntary route, whereas disability and unemployment have been classified as involuntary routes (Radl Reference Radl2013; Schils Reference Schils2008). However, scenarios are possible where early retirement is rather involuntary, e.g. following the down-sizing or reorganisation of a firm (Conen, Henkens and Schippers Reference Conen, Henkens and Schippers2014). Moreover, early retirement packages do not always necessarily provide a sufficient financial basis for withdrawing from the labour market entirely (Dingemans and Henkens Reference Dingemans and Henkens2014; Vickerstaff and Cox Reference Vickerstaff and Cox2005). Alternatively, older workers suffering from chronic illness might happily and voluntarily retire on a disability pension.
The results of this study also did not clearly show whether those in the ‘late retirement’ trajectory were there voluntarily or involuntary, although the over-representation of immigrants and the self-employed suggested that there is a strong involuntary aspect to it. Moreover, the finding of a distinct ‘inactivity’ trajectory raises questions. Do women voluntarily or involuntarily enter inactivity to be with their retired husband or care for an ill relative? Why are the self-employed more likely to enter this trajectory? More research is needed on what constitutes voluntary and involuntary retirement behaviour or whether other categories apply. Higgs et al. (Reference Higgs, Mein, Ferrie, Hyde and Nazroo2003), for example, created seven ideal-types of motivations for early and later retirement on the basis of a qualitative study in the United Kingdom.
While this article has explored the trajectory-like process of retirement by applying sequence analysis on primary sources of income, there are some obvious limitations to this approach. First, because of the broad time-span of ten years that was under investigation, it was only possible to take the sample from one cohort consisting of three birth years. This limited the size of the sample and the possibilities for controlling for cohort effects of health, education and life expectancy. Moreover, it is important to realise that the cohort included in this study was born during the Second World War under German occupation of the Netherlands, which very likely has affected their further lifecourses.
Second, once individuals have been assigned to a certain trajectory, there is little room to account for dynamics within that trajectory. People's situations change: they might switch jobs, face health problems or experience other unforeseen lifecourse events. From a lifecourse perspective, events earlier in life will also have affected retirement trajectories later on (Henretta Reference Henretta and Settersten2003). Marriage, parenthood, divorce and widowhood, as well as career paths and spells of unemployment, sickness and financial distress have all been found to affect retirement mode and timing. This is most obviously affecting the retirement trajectories of women, but certainly not only women (Denaeghel, Mortelmans and Borghgraef Reference Denaeghel, Mortelmans and Borghgraef2011; Fasang, Aisenbrey and Schömann Reference Fasang, Aisenbrey and Schömann2013; Henkens and Van Solinge Reference Henkens and Van Solinge2002; Vickerstaff and Cox Reference Vickerstaff and Cox2005; Visser et al. Reference Visser, Gesthuizen, Kraaykamp and Wolbers2016a ). Moreover, like in the Netherlands in the 2000s, policy contexts are constantly reformed, which may impact entitlement and the freedom of choice at different points in the course of trajectories. More research will needed to take into account the dynamics of the lifecourse as well as changing policy contexts.
Finally, creating sequences of primary sources of income has its limitations. It excludes possibilities where older workers receive income out of multiple sources, e.g. from a part-time job or self-employment activities besides retirement. There are studies showing that different types of gradual and partial retirement are on the increase in the Netherlands (Bloemen, Hochguertel and Zweerink Reference Bloemen, Hochguertel and Zweerink2016). People are more likely to ‘unretire’ or take up bridge jobs after exiting their career jobs (Dingemans and Henkens Reference Dingemans and Henkens2014). These types of patterns did not show up as separate trajectories. This might be due to the fact that they are relatively new and rare phenomena, but can also be the result of the clustering of similar sequences, causing the more rare trajectories to be absorbed by the mainstream of more common trajectories. For analysing such specific, yet increasingly important trajectories, different data and methods are needed.
In spite of these limitations, this study's contribution lies in taking a longitudinal and trajectory-based approach to retirement. It confirms that retirement is not just a matter of choice, but the result of institutional and a wide variety of socio-economic factors. In most industrialised economies with ageing populations, recent reforms have aimed at extending working lives and have included the closing of alternative exit pathways. Whereas the effects of longer working lives are generally considered positively for public finances, there might be some unintended effects as well (Anxo, Ericson and Jolivet Reference Anxo, Ericson and Jolivet2012). It is not unlikely that some of the social divisions that were found in this study will be amplified by such reforms. Especially the retirement position of women, immigrants and the self-employed might further deteriorate, due to their lower levels of entitlements to social security and more limited freedom to choose.
Acknowledgements
The research leading to these results has received funding from the European Union's 7th Framework Programme (FP7/2007-2013) under grant agreement number 262608 (DwB – Data Without Boundaries).