Implications
Increasing intramuscular fat (IMF) by selection is a successful way for improving meat quality. However, this study shows that selection for IMF has important consequences in the fatty acid percentages, some of them negative. These results should be considered when selecting for IMF to improve meat quality.
Introduction
Increasing IMF content of meat by genetic selection is an effective way to improve its tenderness (Zhao et al., Reference Zhao, Chen, Zheng, Wen and Zhang2007 in chickens) and flavor (Schwab et al., Reference Schwab, Baas, Stalder and Nettleton2009 in pigs). However, selection for IMF could produce changes in the fatty acid composition that can influence nutritional, organoleptic and technological properties of meat. Great amounts of monounsaturated (MUFA) and saturated (SFA) fatty acids improve meat flavor (Carrapiso et al., Reference Carrapiso, Bonilla and García2003; Burkett, Reference Burkett2009) but nutritional institutions recommend reducing the intake of SFA (World Health Organization, 2008). Polyunsaturated fatty acids (PUFA) are beneficial from a nutritional point of view, but can lead to undesirable flavors, to a decrease in the melting point of fat, and to a shortened shelf life of the meat (Wood et al., Reference Wood, Enser, Fisher, Nute, Sheard, Richardson, Hughes and Whittington2004).
Three previous selection experiments for IMF have been performed (Sapp et al., Reference Sapp, Bertrand, Pringle and Wilson2002 in cattle, Zhao et al., Reference Zhao, Chen, Zheng, Wen and Zhang2007 in chickens and Schwab et al., Reference Schwab, Baas, Stalder and Nettleton2009 in pigs), but only the experiment in pigs reported correlated responses in the fatty acid composition of meat (Burkett, Reference Burkett2009). We have developed two experimental rabbit lines divergently selected during eight generations for IMF, to study the genetics and metabolism of IMF deposition (Martínez-Álvaro et al., Reference Martínez-Álvaro, Agha, Blasco and Hernández2016a, Reference Martínez-Álvaro, Hernández and Blasco2016b, Reference Martínez-Álvaro, Paucar, Satué, Blasco and Hernández2017a and Reference Martínez-Álvaro, Penalba, Blasco and Hernández2017b). Rabbit is a good genetic model for other livestock species because permits having large samples at reasonable costs. Rabbit has also importance as livestock species in several countries (FAO-STAT, 2014).
The aim of this study is to estimate the correlated responses to selection for IMF on fatty acid composition and their genetic parameters. This is the first time that the genetics of IMF and meat fatty acid composition is studied in rabbits.
Material and methods
Animals
A divergent selection experiment for IMF in rabbits was performed during eight generations. Animals came from a synthetic rabbit line. The base population consisted of 13 males and 83 females, and then, lines selected for high and low IMF had ~8 males and 40 females per generation. Two full sibs (a male and a female) of the first parity of each doe were slaughtered at 9 weeks of age and their IMF content was measured in Longissimus dorsi (LD) muscle. All dams were ranked according to the average of the two phenotypic IMF values obtained from their offspring. The 20% best dams provided all females for the next generation. Each sire was mated with five does, and to reduce inbreeding only one male progeny of the sire, from highest ranked mate, was selected for breeding the next generation. Normally, the first parity was used to collect the IMF data and the second parity to provide the rabbits for next generation, although exceptionally some IMF measurements were made on the second or third parity. More details of this experiment can be found in Martínez-Álvaro et al. (Reference Martínez-Álvaro, Agha, Blasco and Hernández2016a). A total of 2713 rabbits were considered in the pedigree file, from which 1511 were evaluated. A total of 173 rabbits from the eighth generation were used to study the correlated responses to selection on fatty acid composition of LD; 82 from the high-IMF line and 91 from the low-IMF line.
Litters were homogenized at birth up to nine kits per litter. Rabbits were reared collectively from weaning to slaughter, and were fed ad libitum with a commercial diet with an average composition of 15.1% CP, 14.5% crude fiber and 2.48% of fat. Fatty acid composition of the diet (% of total fatty acids) was 0.49% of C14:0, 19.4% of C16:0, 0.68% of C16:1, 2.77% of C18:0, 20.5% C18:1n-9, 48.1% of C18:2n-6, 6.80% of C18:3n-3 and 1.26% of C>20. Animals were slaughtered using electrical stunning and exsanguination. After slaughter, carcasses were chilled for 24 h at 4°C. All experimental procedures involving animals were approved by the Universitat Politècnica de València Research Ethics Committee, according to council directive 2010/63/EU (European Commission Directive, 2010).
Intramuscular fat and fatty acids measurements
After refrigeration, LD was excised, minced, freeze-dried and scanned with near infrared spectroscopy to measure IMF and fatty acid composition, applying the calibration equations previously developed by Zomeño et al. (Reference Zomeño, Juste and Hernández2012) with some modifications. Intramuscular fat and fatty acid contents were obtained in g/100 g of LD muscle on a fresh basis. Fatty acids were expressed as percentage of total fatty acids. Fatty acids studied were the major individual fatty acids C14:0, C16:0, C16:1, C18:0, C18:1n-9, C18:2n-6, C18:3n-3 and C20:4n-6 and the SFA, MUFA, n-3, n-6 and PUFA groups, which included the major fatty acids cited above and all identified minor fatty acids (i.e. C15:0 and C17:0 for SFA, C18:1n-7 for MUFA and C20:2n-6, C20:3n-6, C20:5n-3, C22:4n-6, C22:5n-3 and C22:6n-3 for PUFA).
Statistical analysis
Descriptive statistics and phenotypic correlations between IMF and fatty acid percentages of LD were estimated with data from all generations, after correcting data by line-generation-season, parity order and sex fixed effects. Direct and correlated responses to selection were estimated as the phenotypic differences between high and low-IMF lines at the eight generation of selection. Phenotypic differences between lines were estimated with the model
 $${\bf{y}} {\rm \,{\equals}\,}{\bf{Xb}} {\rm {\plus}}{\bf{Wc}} {\rm {\plus}}{\bf{e}} $$
Data were assumed to be conditionally distributed as
 $${\bf{y}} \left| {{\bf{b,c}} ,\sigma _{e} ^{\,\,2} \sim N\left( {{\bf{Xb}} {\plus}{\bf{Wc,I}} \sigma _{e} ^{\,\,2} } \right)} \right.$$
in which b is the vector with the fixed effects of line (high-IMF and low-IMF), month, sex and parity order; c the vector of common litter random effects, σ e 2 the residual variance, X and W are known incidence matrices and I is an identity matrix. Common litter random effects were assumed to be distributed as
 $${\bf{c}} \,\sim\,N\left( {{\bf 0},{\bf{I}} \sigma _{c} ^{\,\,2} } \right)$$
in which σ c 2 is the common litter variance.
Heritabilities and genetic correlations with IMF were estimated by fitting a bivariate animal model, with the same effects for all traits
 $$\eqalignno{ \left( \matrix{ y_{1} \hfill \cr y_{2} \hfill \cr} \right)&{\equals}\left( {\matrix{ X & 0 \cr 0 & X \cr } } \right)\left( \matrix{ b_{1} \hfill \cr b_{2} \hfill \cr} \right){\plus}\left( {\matrix{ Z & 0 \cr 0 & Z \cr } } \right)\left( \matrix{ u_{1} \hfill \cr u_{2} \hfill \cr} \right)\cr&{\plus}\left( {\matrix{ W & 0 \cr 0 & W \cr } } \right)\left( \matrix{ c_{1} \hfill \cr c_{2} \hfill \cr} \right){\plus}\left( \matrix{ e_{1} \hfill \cr e_{2} \hfill \cr} \right)$$
Data were assumed to be conditionally distributed as
 $$\eqalignno{ \left( \matrix{ {\bf y} _{{\bf 1} } \hfill \cr {\bf y} _{{\bf 2} } \hfill \cr} \right)&\left| {{\bf b}_{{\bf 1}} ,{\bf b}_{{\bf 2}} ,{\bf u}_{{\bf 1}} ,{\bf u}_{{\bf 2}} ,{\bf c}_{{\bf 1}} ,{\bf c}_{{\bf 2}} ,{\bf R}\,\sim\,N \left ( {\left[ {\matrix{ X & 0 \cr 0 & X \cr } } \right]\left[ \matrix{ b_{1} \hfill \cr b_{2} \hfill \cr} \right] \atop{\plus}\left[ {\matrix{ Z & 0 \cr 0 & Z \cr } } \right]\left[ \matrix{ u_{1} \hfill \cr u_{2} \hfill \cr} \right]{\plus}\left[ {\matrix{ W & 0 \cr 0 & W \cr } } \right]\left[ \matrix{ c_{1} \hfill \cr c_{2} \hfill \cr} \right],{\bf R} } \right)} \right.$$
in which b 1 , b 2 are the vectors of fixed effects (month, sex and parity order); u 1 , u 2 are the vectors of additive genetic effects; c 1 , c 2 are the vectors of common litter effects; X, Z and W are known incidence matrices, and R is the residual co (variance) matrix between the two traits.
Sorting data by individuals, additive effects were distributed as
 $${\bf{u}} \,\sim\,N\left( {{\bf 0},{\bf{A}} \,\otimes\,{\bf{G}} _{0} } \right)$$
common litter effects were distributed as
 $${\bf{c}} \,\sim\,N\left( {{\bf 0},\,{\bf{I}} _{{\bf{m}} } \,\otimes\,{\bf{C}} _{0} } \right)$$
and residuals were distributed as
 $${\bf{e}} \,\sim\,N\left( {{\bf 0},{\bf{I}} _{{\bf{n}} } \,\otimes\,{\bf{R}} _{0} } \right)$$
where G 0 , C 0 and R 0 , are 2×2 genetic additive, common litter, and residual (co)variance matrices between the two traits, respectively; A is the relationship matrix; I m is an identity matrix of the same order as the number of levels of common litter effects; and I n is an identity matrix of the same order as the number of individuals. All effects were assumed to be independent between them.
Bayesian inference was used, with bounded flat priors for all unknowns. Marginal posterior distributions were estimated using Gibbs sampling (see Blasco, Reference Blasco2001 and Reference Blasco2017). Descriptive statistics and phenotypic differences between lines were computed with the program Rabbit developed by the Institute for Animal Science and Technology (Valencia, Spain). After some exploratory analyses, results were based on Monte Carlo Markov chains consisting of 60 000 iterations, with a burn-in period of 10 000, and only one of every 10 samples were saved for inferences. Phenotypic correlations and genetic analyses were computed with the software TM (Legarra et al., Reference Legarra, Varona and López de Maturana2008). After some exploratory analyses results were based on Monte Carlo Markov chains consisting of 1 000 000 iterations, with a burn-in period of 200 000; only one of every 100 samples were saved for inferences. In all analyses, convergence was tested using the Z criterion of Geweke and Monte Carlo sampling errors were computed using time-series procedures included in the Rabbit and TM programs. In all cases, Monte Carlo standard errors were small and lack of convergence was not detected by the Geweke test.
The parameters obtained from the marginal posterior distributions of the phenotypic differences between high and low-IMF lines were the median of the difference (D), the highest posterior density region at 95% (HPD95%), and the probability of the difference being greater than zero when D>0 or lower than zero when D<0 (P 0). We considered 1/3 of the phenotypic standard deviation of a trait as a relevant value (r), and we calculated the probability of relevance (probability of the difference being greater than r when D>0 or lower than r when D<0) (P r ). For heritabilities, we estimated the median of each marginal posterior distribution, the HPD95%, and the limit k of the interval [k, 1] with 80% probability, that is the guaranteed value with probability of 80% (k 80%). For genetic and phenotypic correlations, we estimated the median of each marginal posterior distribution, the HPD95%, the probability of being >0 when the median is positive or <0 when the median is negative (P 0), and the guaranteed value with probability of 80%; that is, the limit k of the interval [k, 1] when the median is positive or [−1, k] when the median is negative with 80% probability. A more detailed description of these features can be found in Blasco, (Reference Blasco2017).
Results and discussion
Intramuscular fat composition
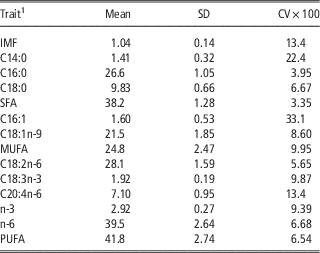
Table 1 shows descriptive statistics of IMF content and fatty acid composition of LD. On average, IMF was 1.04 g/100 g of LD. Percentages of SFA and PUFA were similar (38.2% and 41.8%, respectively), while MUFA percentage was lower (24.8%). Polyunsaturated fatty acids were mainly composed by n-6 (39.5%), whereas n-3 represented a lower percentage (2.92%). Linoleic (C18:2n-6), palmitic (C16:0), and oleic (C18:1n-9) acids were the most abundant fatty acids in rabbit meat, according to the fatty acid composition of the diet. They were followed by stearic (C18:0) and arachidonic acids (C20:4n-6), whereas other fatty acids (C14:0, C16:1 and C18:3n-3) represented minor percentages. These results are in agreement with other studies in rabbits (reviewed by Dalle Zotte, Reference Dalle Zotte2002).
Descriptive statistics of intramuscular fat (g/100 g of muscle) and fatty acid composition of Longissimus dorsi muscle (% of total fatty acids) of rabbits from the whole experiment (n=1511)

1 IMF=intramuscular fat; SFA=saturated fatty acids, C14:0+C15:0+C16:0+C17:0+C18:0; MUFA=monounsaturated fatty acids, C16:1+C18:1n-7+C18:1n-9; n-3=C18:3n-3+C20:5n-3+C22:5n-3+C22:6n-3; n-6=C18:2n-6+C20:2n-6+C20:3n-6+C20:4n-6+C22:4n-6; PUFA=polyunsaturated fatty acids, C18:2n-6+C18:3n-3+C20:2n-6+C20:3n-6+C20:4n-6+C20:5n-3+ C22:4n-6+C22:5n-3+C22:6n-3.
Ratios PUFA/SFA, n-6/n-3 and MUFA/SFA are healthy indicators of meat. In our experiment, PUFA/SFA ratio was 1.09, above the minimum of 0.60 recommended by the World Health Organization (2008). However, the n-6/n-3 ratio was not favorable (13.5), it was higher than the nutritional recommendations for human diets of 5 to 10 (World Health Organization, 2008) due to the high amount of C18:2n-6 in rabbit meat. The ratio MUFA/SFA was 0.65. We did not find a nutritional recommendation range for this ratio, although, in general, it is recommended to replace the intake of SFA by unsaturated fatty acids (World Health Organization, 2008). In comparison with other species, rabbit meat shows greater PUFA, C18:2n-6 and C18:3n-3 percentages and PUFA/SFA ratio than pig, cattle and sheep, and lower n-6/n-3 ratio than pig, cattle and chicken (reviewed by Dalle Zotte, Reference Dalle Zotte2002). However, MUFA/SFA ratio in rabbit meat is lower than in other species (Dalle Zotte, Reference Dalle Zotte2002). Overall, the fatty acid composition of rabbit meat makes it a high quality meat from a nutritional point of view.
Response to selection and correlated responses in fatty acid composition of LD
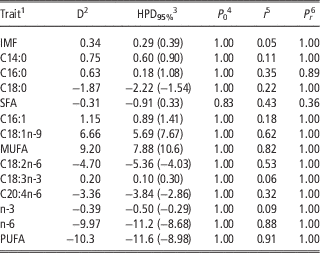
Table 2 shows the direct response to selection for IMF and correlated responses in fatty acid composition of LD estimated as differences between high-IMF and low-IMF lines. Comparisons between lines should be done at the same stage of maturity, and our lines were approximately at the same stage (Pascual et al., Reference Pascual, Calle and Blasco2015). Response to selection for IMF was 0.34 g/100 g of LD, representing 2.4 phenotypic SD of the trait, with a probability of the difference between lines being relevant P r =1.00. Other authors obtained great responses to selection for IMF in cattle (Sapp et al., Reference Sapp, Bertrand, Pringle and Wilson2002), chickens (Zhao et al., Reference Zhao, Chen, Zheng, Wen and Zhang2007) and pigs (Schwab et al., Reference Schwab, Baas, Stalder and Nettleton2009), in line with our results.
Differences between high and low intramuscular fat (IMF) rabbit lines for IMF (g/100 g of muscle) and fatty acid composition of Longissimus dorsi muscle (% of total fatty acids) in the 8th generation (n=173)

1 SFA=saturated fatty acids, C14:0+C15:0+C16:0+C17:0+C18:0; MUFA=monounsaturated fatty acids, C16:1+C18:1n-7+C18:1n-9; n-3=C18:3n-3+C20:5n-3+C22:5n-3+C22:6n-3; n-6=C18:2n-6+C20:2n-6+C20:3n-6+C20:4n-6+C22:4n-6; PUFA=polyunsaturated fatty acids, C18:2n-6+C18:3n-3+C20:2n-6+C20:3n-6+C20:4n-6+C20:5n-3+C22:4n-6+C22:5n-3+C22:6n-3.
2 D=median of the marginal posterior distribution of the difference between high and low-IMF lines.
3 HPD95%=highest posterior density region at 95% of probability.
4 P 0=probability of the difference being greater than zero when D>0 or lower than zero when D<0.
5 r=relevant value, proposed as 1/3 of the standard deviation of the trait.
6 P r =probability of relevance (probability of the difference being greater than r when D>0 or lower than r when D<0).
Selection for IMF led to great modifications in the fatty acid composition of LD (Table 2). The high-IMF line showed greater MUFA and lower PUFA percentages than the low-IMF line. The differences between high-IMF and low-IMF lines for these fatty acid groups were both relevant (P r =1.00) and of similar magnitude. Within PUFA, both n-6 and n-3 were relevantly lower in the high-IMF line (P r =1.00), being the differences between lines greater for n-6 (3.8 phenotypic SD) than for n-3 (1.4 phenotypic SD). We did not observe differences between lines for the SFA percentage. High-IMF line showed relevantly greater amounts of SFA, MUFA, n-6, n-3 and PUFA groups and of all individual fatty acids in absolute terms (g/100 g of LD) respect to the low-IMF line (data not shown), due to its greater amount of IMF. Differences in the fatty acid percentages between lines are the consequence of a greater proportion of triglycerides (stored in adipocytes) respect to phospholipids (located in cells membranes) in the high-IMF than in the low-IMF line. In general, phospholipid fraction shows greater percentages of all individual PUFA whereas triglycerides fraction is richer in all MUFA and SFA. The faster increase of MUFA and SFA respect to PUFA when fatness increases is well documented (reviewed by De Smet et al., Reference De Smet, Raes and Demeyer2004 and Wood et al., Reference Wood, Richardson, Nute, Fisher, Campo, Kasapidou, Sheard and Enser2008 in several farm species).
We have studied the differences between lines on the fatty acid ratios MUFA/SFA, PUFA/SFA and n-6/n-3 in order to evaluate the effect of selection for IMF from a nutritional point of view. On one hand, high-IMF line showed greater MUFA/SFA ratio (0.57) respect to the low-IMF line (0.33), which implies an improvement of meat quality in the high-IMF line. The mean for the MUFA/SFA ratio in the eight generation was 0.45, differing from the mean of the whole selection experiment showed in Table 1. The n-6/n-3 ratio was also more favorable in the high-IMF (11.6) than in the low-IMF line (13.1), due to the greater differences between lines in n-6 than in n-3. In contrast, selection for high-IMF led to a detriment of the PUFA/SFA ratio respect to selection for low IMF, which was 0.98 in the high-IMF line and 1.23 in the low-IMF line. However, in both cases, PUFA/SFA ratio was above the minimum of 0.60 recommended by the World Health Organization (2008).
Modifications in the IMF content and in its fatty acid composition could also affect organoleptic and technological meat quality traits such as flavor, fat consistence and shelf life (Wood et al., Reference Wood, Enser, Fisher, Nute, Sheard, Richardson, Hughes and Whittington2004). However, in a previous study we did not find differences between our rabbit lines in organoleptic properties (Martínez-Álvaro et al., Reference Martínez-Álvaro, Hernández and Blasco2016b).
In general, monounsaturated and polyunsaturated individual fatty acids showed similar patterns as their groups in correlated responses (Table 2), but this was not observed for individual SFA. High-IMF line showed greater percentages of individual SFA C14:0 and C16:0 but lower percentage of C18:0 than low-IMF line, and differences between lines were relevant. Rabbits, and mammals in general, are able to synthetize SFA and MUFA from glucose through lipogenesis de novo, which produces primarily C16:0. In contrast, PUFA are entirely derived from the diet. Previous studies observed that high-IMF line showed greater lipogenic activities than low-IMF line in several tissues such as LD, perirenal fat and liver (Martínez-Álvaro et al., Reference Martínez-Álvaro, Paucar, Satué, Blasco and Hernández2017a and Reference Martínez-Álvaro, Penalba, Blasco and Hernández2017b). These findings explain the greater proportion of C14:0 and C16:0 individual SFA and total MUFA observed in the high-IMF line in comparison with the low-IMF line, and consequently, its lower proportion of PUFA. However, high-IMF line showed lower percentage of C18:0. This is explained because C18:0 percentage is greater in phospholipids than in the triglycerides fraction in rabbits (Otake et al., Reference Otake, Watanabe and Nakazato1971; Cambero et al., Reference Cambero, de la Hoz, Sanz and Ordóñez1991a and Reference Cambero, de la Hoz, Sanz and Ordóñez1991b; Alasnier et al., 1996). This particularity is not observed in other species (Leseigneur-Meyner and Gandemer, Reference Leseigneur-Meyner and Gandemer1991 and Burkett, Reference Burkett2009 in pigs and Wood et al., Reference Wood, Enser, Fisher, Nute, Sheard, Richardson, Hughes and Whittington2004 in a review including pigs, lambs and cattle).
Concerning individual MUFA, high-IMF line had relevantly greater C18:1n-9 and C16:1 percentages (P r =1.00, Table 2). The ratio between C18:1n-9 and C18:0 is a common indicator of the stearoyl-CoA desaturase (SCD) activity (Attie et al., Reference Attie, Krauss, Gray-Keller, Brownlie, Miyazaki, Kastelein, Lusis, Stalenhoef, Stoehr, Hayden and Ntambi2002), enzyme responsible for the synthesis of main MUFA from their SFA forms. This ratio was 1.98 for high-IMF line and 1.09 for low-IMF line, indicating greater SCD activity in the high-IMF line. Within PUFA, high-IMF line showed lower C18:2n-6 and C20:4n-6 percentages than low-IMF line (P r =1.00), but greater percentage of C18:3n-3 (P r =1.00). In rabbits, C18:3n-3 percentage is much greater in triglycerides than in phospholipids (Otake et al Reference Otake, Watanabe and Nakazato1971; Alasnier et al., 1996). In other species such as pig, C18:3n-3 is similar in both fractions (reviewed by De Smet et al., Reference De Smet, Raes and Demeyer2004; Wood et al., Reference Wood, Enser, Fisher, Nute, Sheard, Richardson, Hughes and Whittington2004 and Reference Wood, Richardson, Nute, Fisher, Campo, Kasapidou, Sheard and Enser2008), or it is only slightly greater in triglycerides (Burkett, Reference Burkett2009).
Our results are in close agreement with findings of the selection experiment for IMF in pigs (Burkett, Reference Burkett2009). The line of pigs selected for high-IMF showed more MUFA percentages and lower PUFA percentages respect to a control line, with the exception of C18:3n-3 (Burkett, Reference Burkett2009), and no significant differences for SFA percentage. In a simulation study in pigs, Ros-Freixedes et al. (Reference Ros-Freixedes, Reixach, Bosch, Tor and Estany2012) expected a positive response to selection in C18:1n-9 percentage when selecting by IMF and other traits, including IMF. Some studies compared the fatty acid composition in several genetic rabbit lines differing in their IMF, but they did not show any common pattern (Gašperlin et al., Reference Gašperlin, Polak, Rajar, Skvarèa and Lender2006; Hernández et al., Reference Hernández, Cesari and Blasco2008).
Heritabilities of the traits
For all traits, the differences between the genetic means of the high-IMF and low-IMF lines estimated with the animal model matched with the phenotypic differences between lines (Table 2), which corroborates the model used for the genetic analysis and then, the estimated parameters.
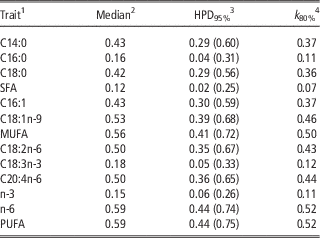
Table 3 shows the heritabilities (h 2) of fatty acid composition of LD. In general, fatty acid composition showed high heritabilities. Percentages of MUFA, n-6 and PUFA groups displayed the greatest h 2 estimates (from 0.56 to 0.59), showing guaranteed values from 0.50 to 0.52 with 80% of probability. Their major fatty acids, C18:1n-9 and C16:1 for MUFA and C18:2n-6 and C20:4n-6 for n-6 and PUFA, also showed great h 2 estimates (from 0.43 to 0.53). However, n-3 group and its major fatty acid C18:3n-3, showed lower estimates (0.15 to 0.18). Percentage of SFA group showed a low h 2 (0.12 with a k 80%=0.07) because of the low h 2 of its main component, C16:0, although other important individual SFA percentages such as C18:0 and C14:0 displayed high heritabilities.
Heritabilities of fatty acid composition of Longissimus dorsi muscle (in % of total fatty acids) in rabbits

1 SFA=saturated fatty acids, C14:0+C15:0+C16:0+C17:0+C18:0; MUFA=monounsaturated fatty acids, C16:1+C18:1n-7+C18:1n-9; n-3=C18:3n-3+C20:5n-3+C22:5n-3+C22:6n-3; n-6=C18:2n-6+C20:2n-6+C20:3n-6+C20:4n-6+C22:4n-6; PUFA=polyunsaturated fatty acids, C18:2n-6+C18:3n-3+C20:2n-6+C20:3n-6+C20:4n-6+C20:5n-3+C22:4n-6+C22:5n-3+C22:6n-3.
2 Median=median of the marginal posterior distribution of the heritability.
3 HPD95%=highest posterior density region at 95% of probability.
4 k 80%=limit of the interval [k, 1] at 80% of probability.
Heritability estimates were high for the major fatty acids (except for C18:3n-3 and C16:0). Even though C18:2n-6 should come from diet, our results show that there is an important genetic control for all these fatty acids accumulation in IMF, whereas this was not observed for C18:3n-3 (Table 3). Several studies report high to moderate h 2 estimates for IMF fatty acid percentages (Burkett, Reference Burkett2009; Sellier et al., Reference Sellier, Maignel and Bidanel2010 and Ibáñez-Escriche et al., Reference Ibáñez-Escriche, Magallón, González, Tejeda and Noguera2016 in pigs and Nogi et al., Reference Nogi, Honda, Mukai, Okagaki and Oyama2011 in cattle), with some exceptions. The h 2 estimate of C18:3n-3 percentage reported by Ibáñez-Escriche et al. (Reference Ibáñez-Escriche, Magallón, González, Tejeda and Noguera2016) was moderate (0.22) and those reported by Sellier et al. (Reference Sellier, Maignel and Bidanel2010) and Nogi et al. (Reference Nogi, Honda, Mukai, Okagaki and Oyama2011) were null. In these three cases, h 2 of C18:3n-3 was lower than h 2 of the other fatty acids, which is in line with our results in rabbits. Only Burkett (Reference Burkett2009) reported a low h 2 for C16:0, near 0.
Correlations between IMF and fatty acid composition
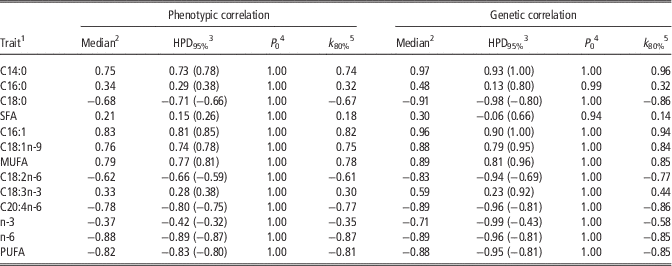
Table 4 shows the phenotypic and genetic correlations (r g) between IMF and fatty acid composition of LD. To our knowledge, there are no previous reports of r g among IMF and fatty acid composition of meat in rabbits. Estimates of r g between IMF and fatty acid percentages of LD were strong and positive for C14:0, C16:1, C18:1n-9 and MUFA (0.88 to 0.97), and strong and negative for C18:0, C18:2n-6, C20:4n-6, n-6 and PUFA (−0.83 to −0.91). Because of the high values of these correlations, 1511 animals were enough to obtain quite accurate estimates (Table 4). Phenotypic correlations between IMF and these fatty acids were of the same order or slightly lower than r g (Table 4). The r g of IMF with n-3 was negative, whereas with C18:3n-3 was positive. The r g of IMF with C16:0 and SFA percentages were low (0.48 and 0.30 respectively) with wide HPD95%, but we can still say that they were positive with high probability (P 0=0.99 and 0.94, respectively). Phenotypic correlations between IMF and percentages of n-3, C18:3n-3, C16 and SFA showed the same sign as their corresponding r g (P 0=1.00) but their medians were lower. Our study reports strong r g between IMF and most of the major fatty acids percentages (except for C16:0 and C18:3n-3), suggesting that, as IMF increases, there is a rapid dilution of PUFA in MUFA and in C14:0. This dilution is due to the difference in fatty acid composition between the muscle phospholipids and triglycerides (De Smet et al., Reference De Smet, Raes and Demeyer2004). In pigs, the genetic correlations of IMF with PUFA and C18:2n-6 percentages were negative and strong (−0.80 and −0.84, respectively) in line with our estimates, and the genetic correlation between IMF and C14:0 was 0.50, lower than ours (Burkett, Reference Burkett2009). Their other genetic correlations were estimated with very low accuracy due to their low amount of data (n=663). In general, our results showed stronger correlations between IMF and fatty acid composition of meat than the correlations reported in other studies in pigs (Suzuki et al., Reference Suzuki, Ishida, Kadowaki, Shibata, Uchida and Nishida2006; Ros-Freixedes et al., Reference Ros-Freixedes, Reixach, Tor and Estany2014) and cattle (Nogi et al., Reference Nogi, Honda, Mukai, Okagaki and Oyama2011; Buchanan et al., Reference Buchanan, Reecy, Garrick, Duan, Beitz and Mateescu2015). A couple of genes (ELOVL6 and SCD) affecting MUFA and SFA content without modifying IMF have been detected in pigs (reviewed by Estany et al., Reference Estany, Ros-Freixedes, Tor and Pena2016). However, the strong genetic correlations between IMF and most fatty acids estimated in rabbits leave few options to change the fatty acid composition of LD without varying IMF.
Phenotypic and genetic correlations between intramuscular fat and fatty acid composition of Longissimus dorsi (in % of total fatty acids) in rabbits

1 SFA=saturated fatty acids, C14:0+C15:0+C16:0+C17:0+C18:0; MUFA=monounsaturated fatty acids, C16:1+C18:1n-7+C18:1n-9; n-3=C18:3n-3+C20:5n-3+C22:5n-3+C22:6n-3; n-6=C18:2n-6+C20:2n-6+C20:3n-6+C20:4n-6+C22:4n-6; PUFA=polyunsaturated fatty acids, C18:2n-6+C18:3n-3+C20:2n-6+C20:3n-6+C20:4n-6+C20:5n-3+C22:4n-6+C22:5n-3+C22:6n-3.
2 Median=median of the marginal posterior distribution of the correlation.
3 HPD95%=highest posterior density region at 95% probability.
4 P 0=probability of the correlation being greater than 0 when the median is positive, or lower than 0 when the median is negative.
5 k 80%=limit of the interval [k, 1] at 80% of probability.
Conclusions
Our study shows substantial changes in the fatty acid composition of LD when selecting for IMF. High-IMF line showed increased MUFA and decreased n-6, n-3 and PUFA percentages in comparison to low-IMF line, and percentages of the main MUFA and PUFA individual fatty acids followed a similar pattern as groups, except for C18:3n-3 that was greater in the high-IMF line. We did not observe differences between lines for the percentage of SFA group, but we found greater C14:0 and C16:0 percentages in the high-IMF and lower percentage of C18:0. Thus, the increase of IMF content by selection could impair nutritional quality of the meat. The high heritabilities estimated for most of the fatty acids, together with the high genetic correlations with IMF, explain the great effect of selection for IMF on the fatty acid composition of meat.
Acknowledgments
This work was supported by project AGL2014-55921-C2-01-P from the Spanish National Research Plan. M. Martínez-Álvaro acknowledges a FPI grant (BES-2012-052655) from the Economy Ministry of Spain. The authors thank Federico Pardo and Marina Morini for their technical assistance.