Implications
Greenhouse gas (GHG) emissions from the dairy industry arise in part from the diets fed to cows. Pastures supplying higher quality forage require less supplemental grain compared with silage. This work demonstrates that where enteric methane emission and milk yield are not appreciably different between pasture based on a predominantly grass perennial forage and total mixed ration (TMR), but a TMR requires more grain per kg milk. This was postulated to result in higher net GHG emission per kg milk beyond the farm gate (consequences of growing grain) as well as on farm (consequences of feeding grain) compared with pasture. The amount of grain fed to increase milk yield is therefore, a major factor determining the GHG emission of a dairy system.
Introduction
Pressing ecological issues for the dairy industry concern the practice of feeding grain and the emission of greenhouse gas (GHG). However, high yielding conventional dairy systems are increasingly dependent on grain, which diverts cropland and food. The Canadian dairy industry emits ∼10 MT CO2 Eq/year, about 9% of the total GHG arising from the agriculture sector estimated at 68 MT CO2 Eq/year (Dyer and Desjardins, Reference Dyer and Desjardins2006). The largest single source of the dairy industry's GHG output (4.7 MT CO2 Eq/year) is the direct emission of enteric methane (EM) from cattle (Verge et al., Reference Verge, Dyer, Desjardins and Worth2007). Interest in EM supersedes that of other GHGs attributed to sectors which provide off-farm inputs (Garnett, Reference Garnett2009). However the contribution of grain use in conventional dairy systems to overall impact of the system on GHG emission must also be recognized.
Production of grain increases use of mineral N fertilizer (MNF), which generates 5.5 kg CO2 Eq/kg N manufactured (Flessa et al., Reference Flessa, Ruser, Dorsch, Kamp, Jiminez, Munch and Beese2002) in addition to the N2O arising from the subsequent use of the fertilizer (O'Brien et al., Reference O'Brien, Shalloo, Patton, Buckley, Grainger and Wallace2012a). Reduction in EM by feeding grain is offset by GHGs produced in growing and transporting the grain (Eckard et al., Reference Eckard, de Klein and Grainger2010) and by loss of soil carbon. Methane from stored cattle manure is also elevated by feeding grain to cows (Hindrichsen et al., Reference Hindrichsen, Wettstein, Machmuller and Kreuzer2006). The level of grain-based concentrate needed to reduce EM emission exceeds 30% of diet dry matter (DM; Martin et al., Reference Martin, Morgavi and Doreau2010), a high level for management intensive grazing (MIG) but low for confinement dairy systems.
Limited research suggests that emission of EM from cows grazing high-quality pasture may not be dissimilar to that of cows fed total mixed ration (TMR) and more grain (Robertson and Waghorn, Reference Robertson and Waghorn2002; Chagunda et al., 2001; de Menez et al., Reference de Menez, Lewis, O'Donavan, O'Neill, Brendan, Clipson and Doyle2011) because of ruminal effects of lower intake of structural carbohydrate (Martin et al., Reference Martin, Morgavi and Doreau2010), more α-linolenic acid and insufficient dietary effective fiber. Lower milk production relative to that of cows fed more grain in confinement elevates EM emission per kg milk of grazing cows (Chagunda et al., Reference Chagunda, Flockhart and Roberts2001), a common gage of dairy impact on climate change; however, all inputs and predicted environmental impacts relative to yield of milk were reduced by MIG such that MIG may be considered a GHG mitigation strategy (Phetteplace et al., Reference Phetteplace, Johnson and Seidl2001).
Emission of GHGs is system related. Lifecycle assessment (Belflower et al., Reference Belflower, Bernard, Gattie, Hancock, Rise and Rotz2012) recently showed that grazing cows in SE USA emitted more GHG per unit of milk compared with confinement. When carbon sequestration by grassland was considered, pasture systems reduced net GHG emissions. The type of feed used in pasture and confinement systems has potential implications on both EM and total GHG emissions (Biswas et al., Reference Biswas, Barton and Carter2008; Arseneault et al., Reference Arseneault, Tyedmers and Fredeen2009; Belflower et al., Reference Belflower, Bernard, Gattie, Hancock, Rise and Rotz2012). This suggests the need for more system-level evaluations of GHG emission per kg milk to fully realize the source of a system's GHG impact and provide solutions for mitigating their emission. We hypothesized that GHG intensity of MIG could be lower than that for cows fed TMR containing lower quality ensiled forage and more grain.
Material and methods
Location and weather
The pasture research center is located at 45.3647° N, 63.2800° W. The grazing season extends from April 15 through to October 15, with outside average monthly rainfall over this period ranging from 75 (April) to 57 mm (July) and daily temperature ranging between 8.8 (April) to 23.5 (August).
Chamber measurement of enteric CH4 emission for different dairy cow diets
Two simple gas monitoring chambers (4.0 m × 3.6 m × 2.5 m) were constructed around tie-stalls (Figure 1), in which methane production was determined as the difference in total methane exiting and entering a chamber under steady-state airflow. The chamber design respected design principles of indirect calorimetry (McLean and Tobin, Reference McLean and Tobin1987), except that they were not insulated. The chambers were constructed of a wooden frame enveloped in clear polyethylene sheeting within a larger convection-ventilated facility with side-wall openings and peaked-roof vents. Fresh air entered chambers through a 0.05 × 0.8 m inlets near the front and right of the cow at 1.2 m height and were located 30 cm from the fresh-air openings of the larger facility. Air exited via a blower to the rear and left of the cow at 2.2 m of height, exhausting upward toward the roof vents of the larger facility. Airflow was maintained at 101 to 111 l/s, and monitored periodically using a hot-wire anemometer (UEI series 4003 Thermo Anemometer, Canada) across a 12.5 cm air tunnel attached to the blower exit. This airflow exceeded minimum ventilation requirements for dairy cattle (Agriculture Canada, 1988). Air conditioners regulated by thermostats were used to maintain chamber air temperatures below 25°C. Double doors with closed-cell foam sealant on door seams enabled entry and exit. Air leaks were detected using a visual smoke-test under slightly positive interior pressure and were sealed using caulking and closed cell foam.
Methane chamber schematic and photograph (2 chambers) during operation.

Volumes and airflows of both chambers were validated using a tracer and single pool kinetics, whereby a measured amount of tracer gas (SF6) was injected into chambers. After mixing for 45 s with the air conditioner fan, chamber air outflow was sampled at time 0 and every 2 min for a period of 30 min. The rate constant (k) was determined from a best-fit determination of the tracer decay curve using the NLIN Procedure of SAS (SAS, 2008). Inflow rate (assumed equal to that of outflow) averaged 107 l/s based on k × chamber volume (V, l), assuming f = k × V, where f is the flow rate.
During collection periods, gas was sampled continuously at the chamber inlet and exhaust outlet into Tedlar gas bags, which were sub-sampled and changed at 6-h intervals starting at 5 AM daily. The sampling system consisted of small sealed diaphragm pumps connected to micro-bore PTFE tubing to control the flow rate and plumbed through PTFE tubing to gas bag inlets. The sampling system was verified for gas-tightness by measuring 0 flow at the sampler outlet when the sample line inlet was blocked. Bags were verified for gas-tightness by loading with calibration gas and measuring over 7 days. Bags were triple-flushed with ultra-high purity N2, evacuated and sealed by closing the stop-cock within 4 h of use in sample collection. Sampling was suspended for ∼30 min during feeding, cleaning and milking twice daily when doors were periodically opened. Methane was monitored for 4 consecutive days for each measurement period, after cows had acclimatized to chambers for 2.5 days.
Methane concentration in collection bags was determined within 3 days of collection on a Bomem MB-155 FTIR spectrometer (Hartmann and Brunn, S. J. Baptiste, Quebec) equipped with a 22 m, folded path gas cell. Samples were desiccated, diluted with pure dry N2, and quantified using a univariate linear calibration in the 3018.9 to 3015 cm−1 absorption band (Quant-Basic software; Galactic Industries). Standard curves (low range for quantifying ambient concentrations, 2 to 15 μl/l, or high-range for quantifying chamber exit concentrations, 15 to 175 μl/l) were developed by quantitatively injecting pure methane into the gas cell using gas-tight syringes via a gas-tight manifold, using dry pure N2. Concentration was corrected for ambient pressure measured using a mercury barometer, and quantitative dilution by partial evacuation (measured using a vacuum gauge, Type332.54, WIKA Instrument Corp., Lawrenceville, GA, USA). Calibration was checked twice before analysis and every 2 h during analysis, and was later verified against NIST traceable calibration gases of 2.54 to 184.5 μl CH4/l, ±1% (Scott-Marrin Inc., Riverside, CA, USA). Five individual standards were prepared in sealed 3 l stainless steel cylinders that had been triple flushed with ultra-high purity N2 and evacunated to <0.002 mm mercury (verified using a mercury McLeod gauge) before adding calibration standard. Cylinders were pressurized to a known pressure with N2 at measured temperatures, assuming ideal gas principles.
Grain intake of cows consuming either fresh pasture forage harvested daily from a sward under MIG (supplemented with concentrate twice daily at milking), or TMR was measured. Pasture forage was harvested from a sward receiving no MNF consisting largely of meadow fescue (Festuca elatior), timothy (Phleum pretense), bluegrass (Poa pratensis) and white clover (Trifolium repens) that was grazed rotationally by 30 lactating Holsteins in 6 to 8 cycles per year with target entry and exit heights of 25 and 7 cm, respectively. Pasture forage was cut twice daily from paddocks deemed ready for grazing using a disc mower and delivered to cows in the chambers on the MIG treatment. Forage used in the TMR was the mid-June first cutting of a timothy/alfalfa (seeded 25%) sward that received an estimated 150 kg N/ha divided among three applications over the course of the season, harvested at the mid bloom stage of growth. Forage was cut, wilted to 35% DM, chopped and ensiled in an upright concrete stave silo.
Measurement of EM emission commenced in October (Fall 2010), using four lactating Holstein cows (average ± s.e.): 44 ± 4 month old, 1.75 calvings, 594 ± 27 kg BW and 247 ± 36 days in milk, and was repeated from June 2 through July 14 (Spring 2002) with a group of six lactating cows: 33 ± 6; month old, 1.3 calvings; 606 ± 108 kg BW and 77 ± 28 days in milk. Then, the third experiment was carried out from August 6 through September 14 (Fall 2002) using a group of eight lactating cows: 44 ± 11 month old; 1.9 calvings, 590 ± 14 kg BW and 144 ± 34 days in milk.
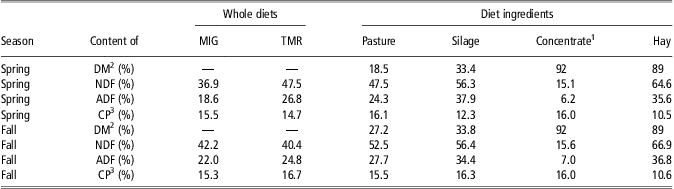
The single concentrate formulation used was based on silage composition and a milk yield of 35 kg/day (Spartan Dairy Ration Balancer, 2.01). Nutritional composition of diets and diet ingredients are shown in Table 1 (the composition of the concentrate is listed in footnote 1). Cows on MIG were fed concentrate twice daily at milking at a daily rate of 0.25 actual milk yield, (w/w, as is basis) to a maximum of 8 kg recalculated weekly and fed in equal portions at 0430 and 1630 h. Silage content of the TMR was adjusted weekly for changes in moisture content. It was mixed twice daily and weighed out to provide 10% to 15% orts. One kilogram of coarse hay per day and a continuous supply of fresh water were available to cows.
Nutritional analysis of diets and diet ingredients used in the trials
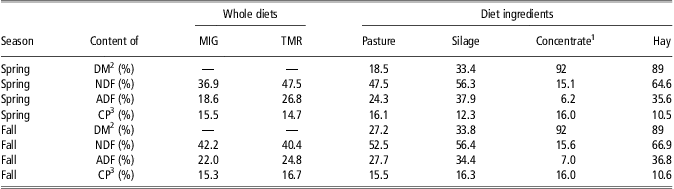
MIG = management intensive grazing; TMR = total mixed ration; DM = dry matter.
1Mixed concentrate comprised average (Fall) 33% fine ground corn, 19% steam flaked corn, 19% ground barley, 5.5% corn gluten meal, 5.5% soybean meal, 5.5% wheat bran, 5.5% beet pulp, 4% mineral–vitamin premix and 2.5% sodium bicarbonate by dry weight.
2DM concentration.
3CP based on N × 6.25
Cows were paired (one cow from pasture and one from confinement where the TMR was fed) and weighed on the days they entered and exited the chambers. Pairs of cows were selected at random for each of nine Latin squares of a cross-over design (Montgomery, Reference Montgomery2009; Table 2) to prevent position effect. Each period consisted of a 14 days adjustment to diets followed by 2 days of adaptation to the chamber, and 4 days of continuous sampling of gas. Initial diets and chambers were assigned randomly to pairs of cows, one MIG and one TMR. Cows were assigned to the alternate diet and chamber for a repeat of the process. Cows were milked twice daily at 0430 and 1630 h into buckets in situ. Milk was weighed and samples proportionate in size to yield were pooled to create a 4 days composite for analysis.
Cross-over experimental design used to measure the effect of feeding MIG pasture (P) or TMR (T) on the responses during two seasons. For each cow, period 1 indicates the first administration of the feed assigned to the cow randomly, and period 2 indicates the time where the other feed was administrated

MIG = management intensive grazing; TMR = total mixed ration.
Intake was determined during each period of gas sampling. Samples of feeds were collected daily and combined by cow and period. Feed ingredients and treatment diets were dried (55°C), ground (0.1 mm) and analyzed in duplicate for CP using the Dumas method on a FP-528 Nitrogen determinator (LECO Corp., St. Joseph, MI, USA); NDF and ADF were determined using an ANKOM 200/220 Fiber Analyzer (ANKOM Technology, Macedon, NY, USA) based on Van Soest and Robertson (Reference Van Soest and Robertson1980). The NDF procedure included heat stable amylase and sodium sulphite. Milk composition was determined using a System 4000 Milkoscan (Foss Electric, Denmark).
Methane production per cow was calculated for each 6-h collection interval over the 4 days of collection period as:
 $$M\, = \,({{C}_o}\,{\rm{ - }}\,{{C}_i})\,\times \,A\,\times \,\frac{{{{M}_C}}}{{{{V}_C}}}\,\times \,\frac{{{\rm{21}}\,{\rm{600}}\,{\rm{s}}}}{{{\rm{6}}\,h}}\,\times \,\frac{{{\rm{1}}\,{\rm{l}}}}{{{\rm{1}}{{{\rm{0}}}^{\rm{6}}} \,{\rm{\mu l}}}}$$
where M is g CH4 production per 6 h, Co and Ci are CH4 concentrations (μl/l) at chamber outlet and inlet, respectively, A is volumetric airflow rate (l/s), MC is the molar mass of CH4 (g/mol) and VC is the molar volume of CH4 (l/mol) adjusted for temperature and pressure at sampling. Daily EM emission was determined as the difference between inflow volume × CH4 concentration and exhaust volume × CH4 concentration.
Concentrations of ammonia and CO2 in chamber air were monitored to ensure they remained below threshold values for animals of 25 and 5000 ppm, respectively.
Comparison of SF6 and chamber method measurement techniques
The EM emission, determined using gas collection chambers, was compared with that using the SF6 technique (Johnson and Johnson, Reference Johnson and Johnson1995) because measurements of EM in the current experiment were taken under simulated grazing in a chamber while in most instances the SF6 technique is used on free roaming cows in grazing studies. For this technique comparison a crossover design was employed using 14 days periods including two days adjustment and 4 days of continuous gas collection. Four cows were used to compare EM emissions under simulated grazing in chamber (feeding harvested pasture) where EM emissions were measured using both the chamber method and the SF6 tracer method, taken simultaneously in chamber on the same cows. Cows crossed over to grazing in a field where EM was monitored using the SF6 tracer method only. The multiparous Holstein cows used were in mid-lactation and were paired according to BW, milk production and days in lactation. Gas collection chambers and pasture treatment were as described previously with the addition of a collection apparatus hung near the air inlet to account for background level of SF6. Pasture (harvested or grazed from the same area) was provided ad libitum.
For the SF6 technique, permeation tubes constructed from swagelok fittings (VCO, with10 ml PTFE and under stainless steel frits) were loaded with an average of 1.49 g SF6 and weighed every 2 days during incubation in a water bath (39°C) for 64 days to determine SF6 emission rate. In comparison, a review of 13 previous dairy cow studies used an average of 2.5 g SF6 per cow with an average release rate ranging from 1.2 to 7.0 mg/day (Williams et al., Reference Williams, Moate, Hannah, Ribauxa, Walesa and Eckard2011). Tubes were inserted into the rumen 1 week before the first collection period to allow for SF6 equilibration in the rumen. During collection periods, cows were fitted with halters comprised of a capillary tube (0.01 mm) connected to a 1.2 l canister that was triple flushed with ultrapure N2 and evacuated (<0.1 mm Hg) immediately before use. Canisters were changed at 12 h intervals (0500 and 1700 h). Concentrations of SF6 and methane were determined in triplicate using gas chromatography (Model CP3800, Varian, Palo Alto, CA, USA) equipped with an electron capture detector at 70°C. Canister vacuum was measured and pressurized to slightly above atmospheric pressure using dry pure N2, measured using a DPG1000B absolute pressure gauge (Omega Engineering, Stamford, CT, USA). Gas from the collection canister was then passed directly through a 0.5 ml sample loop attached to the GC. The setup for analysis also included a 2.0 ml sample loop, a 0.5 m Hayesep N2 backflush column and a 2.0 m Hayesep D separator column. After gas analysis, canisters were flushed with N2 and re-evacuated before reuse. Mixed calibration standards (2.54 to 184.5 μl CH4/l, ±1%, and 0.0196 to 0.825 μl SF6/l, ±5% in N2 were used (NIST traceable, Scott-Marrin Inc., Riverside CA, USA).
Experiments were conducted in accordance with approved operating procedures (Canadian Council on Animal Care, 1993).
Statistical analysis
The ANOVA used to determine system and season effects on EM emission and grain intake is based on the model in Montgomery (Reference Montgomery2009), which consisted of diet, cow and period effects on the responses for Spring and Fall (as well as both combined). The data were analyzed as a set of nine Latin squares (Table 2) with two rows (Periods) and two treatments (Pasture or TMR). The two columns within each of the nine Latin squares correspond to the cows (Montgomery, Reference Montgomery2009). The analysis was conducted using the Mixed Procedure of SAS (SAS, 2008). For each response, the residuals were examined to verify normal distribution and constant variance assumptions of the error terms as described in Montgomery (Reference Montgomery2009). The assumptions were valid for all responses except for Concentrate : milk ratio (as is), where a square root transformation was used. The original concentrate : milk ratios are shown as means in Table 5.
Results and discussion
Diet quality
The DM content of pasture and silage averaged 18.5% and 33.4% in Spring, and 27.2% and 33.8% in Fall, respectively (Table 1). The MIG diet (pasture + supplement) contained more forage DM (62% and 66% pasture in Spring and Fall) compared with the TMR, (48% and 50% silage in Spring and Fall). Pasture forage quality was higher compared with silage in the TMR, particularly in Spring (Table 1). Fiber profiles of pasture and silage were similar to NRC (2001) values of 45.8% NDF and 25.0% ADF for intensively managed pasture, or 54.5% NDF and 34.7% ADF for mid-maturity legume-mix silage); and to those observed in previous research using these forage types and dairy systems (Fredeen et al., Reference Fredeen, Astatkie, Jannasch and Martin2002). In contrast, the pasture forage used in Harper et al. (Reference Harper, Denmead, Freney and Byers1999), an experiment where pasture increased EM emission, came from a sward containing 61% dead grass as well as Holcus lantus, phalaris aquatic, Bromus mollis and Trifolium subterranean and was lower in quality (46.3% ADF) than that used in the present study (24.3% in Spring and 27.7% in Fall ADF). Seasonal differences in both forage composition, and grain content of the treatment diets were noted across season in amount of dietary fiber and its quality (Table 1). The CP contents for MIG and TMR in Spring were 15.5% and 14.7%, respectively. These numbers in Fall were 15.3% and 16.7%, respectively (Table 1).
Intake
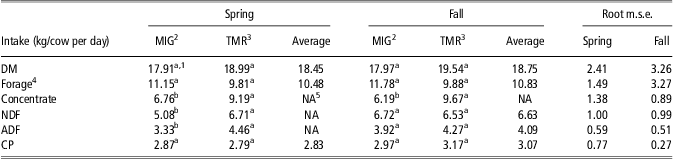
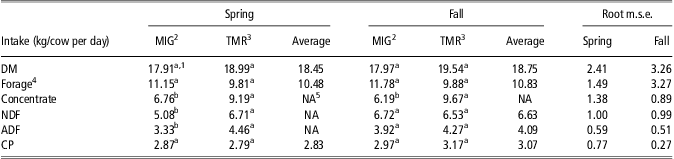
Differences in forage quality did not translate into significant treatment differences in forage intake (Table 3), which averaged 10.5 kg DM/day and 10.8 kg DM/day in Spring and Fall, respectively. The higher pasture quality presumably increased energy intake from forage on pasture. Consequently, concentrate intake across treatments was influenced primarily by three factors: higher forage quality for MIG, and higher dry matter intake (DMI) of TMR and milk yield of individual cows for MIG. Concentrate intake was affected significantly by treatment, averaging 6.76 and 9.19 kg DM/cow per day in Spring (P = 0.039), and 6.19 and 9.67 kg/cow per day in Fall (P = 0.001) for MIG and TMR, respectively (Table 3).
Mean intake for MIG and TMR diets in Fall and Spring seasons. The last two columns show the root m.s.e. obtained from the ANOVA table. Average values are calculated when there is no significant difference between the means of MIG and TMR
MIG = management intensive grazing; TMR = total mixed ration; m.s.e. = mean square error; DM = dry matter; NA = not applicable.
1Within each season, and for each intake variable, means followed by the same letter are not significantly different (P ⩾ 0.5).
2Intake of pasture, concentrate and hay.
3Intake of silage, concentrate and hay.
4DM intake of harvested pasture (MIG) or silage (TMR), plus hay.
5NA because the difference was significant.
Daily ADF intake was higher for TMR than for MIG in Spring (4.46 v. 3.33 kg; P = 0.008), but not in Fall (4.09 kg average; P > 0.1). In Spring, when MIG pasture quality surpassed that of the TMR, NDF intake was 32% higher for TMR (6.71 v. 5.08 kg/cow per day; P < 0.05). The NDF intake was 0.85% and 1.14% of BW for MIG, and 1.12% and 1.07% of BW for TMR in Spring and Fall, respectively, indicating that DMI of cows was constrained, in part by rumen fill, except perhaps for MIG in Spring when NDF digestibility appeared higher based on a lower ADF : NDF ratio.
The CP content of forages was not significantly affected by diet or season (P > 0.1), but the TMR contained significantly more CP in Fall (16.7% v. 15.7%; P = 0.011), because of higher protein in Fall silage. Intake of CP was not significantly affected by season, diet or cow, averaging 2.94 kg/cow per day overall (P > 0.1).
Milk yield and composition
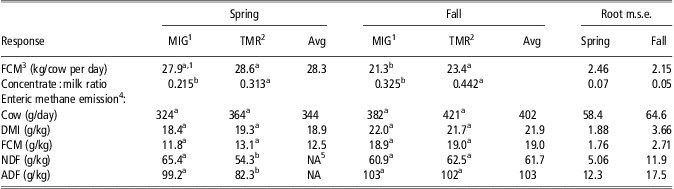
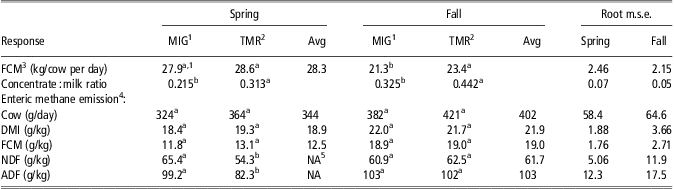
There were no significant treatment or seasonal effects on milk yield, which averaged 23.2 ± 3.5 kg/day overall (P > 0.1) or in its content of either fat, which averaged 4.6% ± 0.1% (P > 0.1), or protein, which averaged 3.1% ± 0.1% (P > 0.1). Correspondingly, the yield of fat corrected milk (FCM; Table 4) was not significantly affected by diet (P > 0.1) in Spring (averaging 28.3 kg/day across treatments), when forage quality of MIG was higher, despite lower concentrate intake compared with TMR. In Fall, when ADF and total fiber intakes were not significantly different between treatments (P > 0.1), higher concentrate intake in TMR increased FCM yield compared with that of MIG.
Comparison of enteric methane measurements measured in chamber, SF6 in chamber, and SF6 on pasture techniques. The last column shows the root m.s.e. obtained from the ANOVA table. Average values are calculated because there was no significant difference between the means of the three methods.

m.s.e. = mean square error; FCM = fat corrected milk.
aMeans followed by the same letter are not significantly different (P ⩾ 0.5).
The concentrate DM intake per kg FCM was significantly affected by treatment (P = 0.001), averaging 0.279 and 0.391 for MIG and TMR (Table 4), although the concentrate :milk ratio in Spring only tended toward significance (P = 0.066), averaging 0.215 and 0.313 for MIG and TMR, respectively.
The comparison of EM measurements in chamber and SF6 techniques in chamber and in the field showed that although the SF6 method tended to underestimate the EM measurement in chambers, the differences among the average measurements obtained from these three methods were not significant (Table 4). We observed no significant difference in EM emission between the chamber (simulated grazing) and the SF6 techniques (grazing in the field), averaging 307 g/day across methods concurring with Muñoz et al. (Reference Muñoz, Yan, Wills, Murray and Gordon2012) who found little difference between methods, estimating rectal CH4 at 3% of the total emission. Grainger et al. (Reference Grainger, Clarke, McGinn, Auldist, Beauchemin, Hannah, Waghorn and Eckard2007) found that the SF6 technique overestimated EM by up to 4%, whereas Pinares-Patino et al. (Reference Pinares-Patino, Waghorn, Machmueller, Vlaming, Molano, Cavanagh and Clark2007) observed that EM measured on grazing cows using the SF6 technique paralleled that of cows fed harvested pasture forage in a chamber. The small variation among studies employing the SF6 method has been attributed to inconsistencies in sampling devices among cows, leakage from the SF6 apparatus (Deighton et al., Reference Deighton, O'Loughlin, Boland and Buckley2011) or over-estimation of SF6 release rate from the permeation tube (Storm et al., Reference Storm, Hellwing, Nielsen and Madsen2012). Establishing CH4 levels in background air is a significant challenge for use of the SF6 method in confined spaces (Williams et al., Reference Williams, Moate, Hannah, Ribauxa, Walesa and Eckard2011), and is a possible issue in this experiment since we used only one background air sampler.
The main advantage of using chambers to determine the EM emission of cows consuming harvested pasture forage indoors (simulated grazing) is the ability to accurately measure pasture DMI and total EM emitted. Animals on pasture may also graze for longer periods with more frequent eating compared with meal fed cows in chambers resulting in a relative depression in EM emission when cows are placed in chambers. The stress of isolation in a chamber and restraint in a stall however, may have also contributed to reduced DMI, milk yield and EM emission of cows confined to chambers. Munger and Kreuzer (Reference Munger and Kreuzer2008) observed a beneficial impact of longer adjustment to chambers. Longer adjustment time was employed in our cross-over experimental design to reduce the effect of chamber experience across cows and treatments.
Despite differences in the amount of concentrate fed, daily emission of EM/cow measured in chamber was similar between MIG and TMR, averaging 373 g (Table 5). O'Neill et al. (2011) observed higher emission of EM in early lactation cows fed corn-based TMR compared with perennial ryegrass (allocated 17 kg DM/cow per day). In their study, daily EM emission was estimated using the SF6 technique over 5 consecutive days; and the TMR increased daily yields of milk (29.5 v. 21.1 kg), protein + fat (2.09 v. 1.54 kg) and energy balance, thereby reducing methane intensity.
Emission of EM/kg DMI was not significantly affected by diet (P > 0.1) averaging 20.85 g. The marginal treatment effect on daily emission of EM (P = 0.066) was not related to intakes of DM, NDF or ADF, which were lower for MIG compared with TMR in Spring. MIG pasture also contained a lower ADF : NDF ratio, indicative of higher quality of cell wall carbohydrate, which may have partly explained the marginal effect. Despite differences in forage quality and diet composition, emission of EM/kg FCM was not affected by treatment (P > 0.1) averaging 16.8 g.
Milk yield was higher in the Spring and EM emission was lower compared with Fall for both treatments but overall, season did not affect EM emission per unit milk (P > 0.1 for both Spring and Fall). Cow (P = 0.001) and period (P = 0.035) effects observed were likely due in part to intake and pasture compositional differences (McCaughey et al., Reference McCaughey, Wittenberg and Corrigan1999; Pinares-Patino et al., Reference Pinares-Patino, Waghorn, Machmueller, Vlaming, Molano, Cavanagh and Clark2007). The average emission of EM (20.85 g kg/DMI) across seasons and treatments is similar to previously reported values (Harper et al., Reference Harper, Denmead, Freney and Byers1999; Grainger et al., Reference Grainger, Clarke, McGinn, Auldist, Beauchemin, Hannah, Waghorn and Eckard2007).
Relative to MIG, more supplemental grain was needed in the TMR in both seasons because of lower quality of silage in the TMR compared with fresh pasture forage. Consequently, more concentrate DM was fed per kg FCM in TMR averaging 0.391 and 0.279 for TMR and MIG, respectively (Table 4; P = 0.001). The concentrate DM : milk ratio was higher for TMR in both seasons (P < 0.05 for both) despite higher FCM yield for TMR only in Fall (P = 0.044) when forage quality was similar between treatments.
Higher concentrate intake per kg milk for TMR did not result in lower EM emission compared with MIG and less concentrate, despite predictions that feeding grain reduces EM emission (Chagunda et al., Reference Chagunda, Flockhart and Roberts2001). This was likely because of the opposing effects of grain and fiber, which were elevated concurrently in TMR compared with MIG, especially in Spring.
Maintaining pasture forage at a vegetative stage of growth, comprised more rapidly degradable cell wall carbohydrate is an important objective of grazing management, and this characteristic of MIG forage may be negatively correlated with EM emission (Boadi et al., Reference Boadi, Benchaar, Chiquette and Masse2004). Although NDF digestibility was not measured, it was likely higher in MIG than in TMR especially in Spring. Higher emissions of EM/kg NDF and per kg ADF for MIG in the Spring (Table 5) are assumed to relate to a higher digestibility of NDF in Spring pasture as indicated by the lower content of ADF relative to NDF. Nevertheless, EM emission per cow was not different because of lower NDF intake with MIG compared with TMR.
Mean FCM, concentrate : milk ratio and for MIG and TMR diets in Fall and Spring. The last two columns show the root m.s.e. obtained from the ANOVA table. Avg values are calculated when there is no significant difference between the means of MIG and TMR
MIG = management intensive grazing; TMR = total mixed ration; Avg = average; FCM = fat corrected milk; DMI = dry matter intake; 5NA = not applicable.
1MIG = pasture, concentrate and hay.
2TMR = silage, concentrate and hay.
3FCM = 4%
4Measured in chamber.
5NA = not applicable because the difference was significant.
a,bMeans followed by the same letter are not significantly different (P ⩾ 0.5).
Along with differences in forage fiber intake and composition, and in amounts of concentrate DM fed to MIG and TMR cows, the meal feeding of concentrate to MIG cows (though less than 3 kg (as fed) per feeding on average), may have also influenced rumen fermentation and methanogenesis. Robertson and Waghorn (Reference Robertson and Waghorn2002) also observed similar amounts of EM emitted from un-supplemented grazing dairy cows under a MIG regimen compared with TMR, except when lower quality, late-season pasture led to slightly higher EM emissions. Over the range of concentrate fed (2 to 7 kg/day) in Lovett et al. (Reference Lovett, Stack, Lovell, Callan, Flynn, Hawkins and O'Mara2005) no effect of concentrate level on EM emission was observed. In addition, Young and Ferris (Reference Young and Ferris2011) observed that concentrate supplementation increased EM emission due in part to increased intake.
Postulated effects on total GHG emission
The higher milk yield associated with feeding concentrate alone reduces EM intensity even though EM emission itself may not be reduced. Consequently, when EM emission is expressed relative to milk yield, improvements in GHG emission can apparently be made by increasing milk yield without reducing EM emission. Higher milk yield however, may increase the emission of other GHGs because of higher grain input (Garnett, Reference Garnett2009). The major GHGs generated on a dairy farm include CO2 from burning fossil fuels and others that are difficult to quantify, which include carbon released during soil tillage and N2O, GHGs that can be estimated from the life cycle impacts of inputs used to produce the milk (Arseneault et al. Reference Arseneault, Tyedmers and Fredeen2009). Thus, where milk yield is increased by means that incur the emission of GHGs other than EM, EM efficiency is a poor index of the total GHG emission of dairy cows (Garnett, Reference Garnett2009).
The diet plays a role in determining the amount and type of GHG emission of a dairy system in addition to its effect on EM. Feeding more grain to compensate for lower quality forage in conventional dairy systems may be expected to increase the CO2 and N2O emissions of the system (Casey and Holden, Reference Casey and Holden2005). Reducing the use of grain and its attendant CO2 and N2O emissions, while maintaining economically sustainable levels of milk production, is contingent upon feeding highest forage quality, which is made possible through, for example, the use of best pasture management strategies. Since the N2O emission from manure may not be much different between confinement and pasture systems (Mosier et al., Reference Mosier, Kroeze, Nevison, Oenema, Seitzinger and Van Cleemput1998), the main system difference in N2O emission is related to mineral nitrogen fertilizer use (Flessa et al., Reference Flessa, Ruser, Dorsch, Kamp, Jiminez, Munch and Beese2002; Snyder et al., Reference Snyder, Bruulsema, Jensen and Fixen2009). Feeding supplemental corn, for example, adds to the total GHG emission through both the use of MNF (Refsgaard et al., Reference Refsgaard, Halberg and Kristensen1998; Flessa et al., Reference Flessa, Ruser, Dorsch, Kamp, Jiminez, Munch and Beese2002), and tillage, where tillage increases emissions of GHGs (Robertson et al., Reference Robertson, Paul and Harwood2000) compared with grazed pasture (Saggar et al., Reference Saggar, Andrew, Tate, Hedley, Rodda and Townsend2004). Perennial forages, which comprise the main type of pasture used in Atlantic Canada, are less reliant on MNF and have a net negative to neutral impact on GHG emissions when C storage is considered (Robertson et al., Reference Robertson, Paul and Harwood2000). These observations suggest that less tillage in MIG systems may lower emission of GHGs relative to confinement systems despite the need for more land and cows per kg milk (Van der Nagel et al., Reference Van der Nagel, Waghorn and Forgie2003). The predicted increase in GHG emissions from confinement systems in which cows are fed more concentrate relative to pasture can range from 6% (Belflower et al., Reference Belflower, Bernard, Gattie, Hancock, Rise and Rotz2012) to 80% (Van der Nagel et al., Reference Van der Nagel, Waghorn and Forgie2003). High grain diets may also lead to greater methane emission from the manure (Hindrichsen et al., Reference Hindrichsen, Wettstein, Machmuller and Kreuzer2006). These studies underline the importance of studying the broader implications of differences in diet among systems on GHG impact in the dairy industry, which include direct (on farm) and indirect (before and after the farm gate) effects (O'Brien et al., Reference O'Brien, Shalloo, Patton, Buckley, Grainger and Wallace2012b).
Conclusion
Yield of FCM and emission of EM per day and per kg milk were only marginally different between mid-late lactation cows fed diets typical of MIG (pasture plus concentrate fed at the rate of 0.25 milk yield), or confinement (TMR containing 49% concentrate) dairy systems in Maritime Canada. Further to this, an MIG diet required less grain relative to TMR because of higher fiber quality of pasture forage compared with silage, particularly in Spring. Recognizing system effects on GHG emission is important for developing appropriate strategies for the dairy industry. Where the main focus of GHG mitigation in the dairy industry is on reduction of EM emission relative to milk yield, increasing milk yield and reducing EM emission are given equal importance as mitigation tools. Using only kg EM kg/milk to guide the dairy industry toward lower total GHG emission ignores the GHGs created by system inputs which are lower in MIG systems compared with confinement. Grain use, in particular, is an input that may be an important distinguishing feature in total GHG emission among dairy systems because of its wide range of use and the CO2 and N2O created in growing, processing and transporting this input. Further research is needed to assess the importance of including other GHG emissions of dairy systems, not simply EM in reducing the impact of dairy systems on the environment.
Acknowledgments
The SF6 and chamber comparison was performed by Sarah Cooper. The FTIR spectrometer used was from the lab of Jeff Hoyle (Environmental Sciences Department, Faculty of Agriculture, Dalhousie University). Funding was provided by the Canadian Climate Change Fund in Agriculture, Dairy Farmers of Canada, NSERC and Agriculture and AgriFood Canada.