



INTRODUCTION
Most species of free-living organisms are utilized as a resource by a number of parasitic species (Dobson, Reference Dobson1985, Reference Dobson, Esch, Kennedy and Aho1990; Esch et al. Reference Esch, Bush and Aho1990; Dobson et al. Reference Dobson, Lafferty, Kuris, Hechinger and Jetz2008). These species form a major component of biodiversity and may have a significant impact on the birth, death and dispersal rates of their hosts. Although the majority of mathematical models for parasites and their hosts have focused on simple one host – one parasite systems (Anderson and May, Reference Anderson and May1991; Grenfell and Dobson, Reference Grenfell and Dobson1995); an increasing number of recent studies of parasite communities have focused on examining the indirect role of host immunity in shaping abundance of different parasite species in individual hosts (Cattadori et al. Reference Cattadori, Boag, Bjørnstad, Cornell and Hudson2005; Cornell et al. Reference Cornell, Bjornstad, Cattadori, Boag and Hudson2008). We extend these ideas and develop a framework that considers host-parasite systems as metacommunities – patches of habitat (hosts) that are occupied by one or more individuals of one or more parasitic species. A large number of ecological communities have this structure: insects on plants, fish on coral reefs, marine organisms in kelp forests.
An important step in the analysis of host-parasite systems has been the extension of classical methods for determining the ability of one parasite to establish in a population of uninfected host (Diekmann et al. Reference Diekmann, Heesterbeek and Metz1990; Anderson and May, Reference Anderson and May1991; De Leo and Dobson, Reference De Leo and Dobson1996) to two or more parasite species (Dobson, Reference Dobson1985; Roberts et al. Reference Roberts, Smith, Grenfell, Dobson and Grenfell1993; Dobson and Roberts, Reference Dobson and Roberts1994). The conditions for coexistence or competitive exclusion in these multi-parasite models are basic to understand how a parasite community is structured (Janovy et al. Reference Janovy, Ferdig and McDowell1990; Gatto and De Leo, Reference Gatto and De Leo1998). Purely mathematical analysis have focused on general results that apply to all possible combinations of demographic parameters, whereas interspecific comparisons for both host and parasite species demonstrate that there are constraints on the combinations of parameter values observed in nature and this constraints are often related to body size (Peters, Reference Peters1983; Skorping et al. Reference Skorping, Read and Keymer1991; Charnov, Reference Charnov1992, Reference Charnov1993; Morand, Reference Morand1996; Morand et al. Reference Morand, Legendre, Gardner and Hugot1996; West and Brown, Reference West and Brown2005). A central assumption of life-history theory is that any observed combination of life-history parameters (birth, death and transmission rates, ages of first reproduction) reflects a combination of traits that have been favoured by natural selection to result in higher fitness in that particular environment than any other possible combination. Although life-history traits may change in time under the pressure exerted by natural selection, the array of possible modifications are bounded by physiological, physical and phylogenetic constraints (Harvey and Keymer, Reference Harvey and Keymer1991). Of the many traits of a species, body size is certainly one of the most influential (Peters, Reference Peters1983) as many physiological, energetic and demographic properties have been shown to scale allometrically with body size (Calder, Reference Calder1984; Schmidt-Nielsen, Reference Schmidt-Nielsen1984). In particular, body size affects metabolic rates, which, in turn, set the pace of life histories and influence the flow of energy and material within and between organisms (Brown et al. Reference Brown, Gillooly, Allen, Savage and West2004). For instance, population density, life expectancy, time to maturation and fecundity have been shown to scale allometrically with body size (Peters, Reference Peters1983; Calder, Reference Calder1984; Schmidt-Nielsen, Reference Schmidt-Nielsen1984). This enables predictions of broader scales ecological patterns and process with the use of scaling laws parameterized with respect to body size: in recent years, several works have evidenced that energetic scaling laws might influence population dynamics of prey-predator systems (Weitz and Levin, Reference Weitz and Levin2006), productivity (Economo et al. Reference Economo, Kerkhoff and Enquist2005; Loeuille and Loreau, Reference Loeuille and Loreau2005), resource supply networks (Banavar et al. Reference Banavar, Damuth, Maritan and Rinaldo2002a ), food web structure (Cohen et al. Reference Cohen, Jonsson and Carpenter2003) and ecosystems (Marquet et al. Reference Marquet, Labra and Maurer2004), stability of ecological community (Brose et al. Reference Brose, Williams and Martinez2006) and abundance, energetic and production of parasitic species (Hechinger et al. Reference Hechinger, Lafferty, Dobson, Brown and Kuris2011; Hechinger, Reference Hechinger2015). Despite some caveats (Tilman et al. Reference Tilman, Lehman, HilleRisLambers, Harpole, Dybzinski, Fargione, Clark and Lehman2004), it has been argued that bioenergetic scaling laws might actually provide a quantitative unifying theory of biological structure and organization (West et al. Reference West, Brown and Enquist1997, Reference West, Brown and Enquist1999; Banavar et al. Reference Banavar, Damuth, Maritan and Rinaldo2002b ; Brown et al. Reference Brown, Gillooly, Allen, Savage and West2004; West and Brown, Reference West and Brown2005; Price et al. Reference Price, Weitz, Savage, Stegen, Clarke, Coomes, Dodds, Etienne, Kerkhoff, McCulloh, Niklas, Olff and Swenson2012).
While the majority of these works provides a static energetic view of the study systems, there are still few (but increasing number of) works linking metabolic scaling to the dynamics of interacting populations of pathogens and their hosts (De Leo and Dobson, Reference De Leo and Dobson1996; Morand and Poulin, Reference Morand and Poulin2002; Bolzoni et al. Reference Bolzoni, Gatto, Dobson and De Leo2008a , Reference Bolzoni, Gatto, Dobson and De Leo b ; Molnar et al. Reference Molnar, Dobson and Kutz2013a , Reference Molnar, Kutz, Hoar and Dobson b ), of host and parasitoids (Cohen et al. Reference Cohen, Jonsson, Mƒuller, Godfray and Savage2005), or of predators and their prey (Yodzis and Innes, Reference Yodzis and Innes1992; Brose et al. Reference Brose, Williams and Martinez2006; Weitz and Levin, Reference Weitz and Levin2006; Otto et al. Reference Otto, Rall and Brose2007). In the present work we incorporated bio-energetic scaling laws into a classical dynamical model of a community of macroparasites species exploiting a self-regulating host population.
There is a significant evidence that parasite body size is an important determinant of life history traits in parasitic nematodes (Skorping et al. Reference Skorping, Read and Keymer1991; Morand, Reference Morand1996; Morand et al. Reference Morand, Legendre, Gardner and Hugot1996). In contrast to their mammalian hosts, fecundity of parasitic nematodes increases with body size (Skorping et al. Reference Skorping, Read and Keymer1991). Furthermore, both the space available for parasite occupation in the host body cavity, or its alimentary canal (Poulin, Reference Poulin1995b ) and the energy available to parasites for growth and reproduction are very much linked to the host body size (Hechinger, Reference Hechinger2013). The energy processed by an organism is strictly related to its metabolic rate, which in turn scales allometrically with body size for the host (Peters, Reference Peters1983; Gillooly et al. Reference Gillooly, Brown, West and Savage2001; Savage et al. Reference Savage, Gillooly, Brown, West and Charnov2004a ; Weibel et al. Reference Weibel, Bacigalupe, Schmitt and Hoppeler2004; Economo et al. Reference Economo, Kerkhoff and Enquist2005; Jetz et al. Reference Jetz, Carbone, Fulford and Brown2005) and the parasite (Hechinger et al. Reference Hechinger, Lafferty, Kuris, Sibly, Brown and Kodric-Brown2012; Hechinger, Reference Hechinger2013). If the energy provided by the host per unit time can be a limiting factor for parasite body size, as suggested by Hechinger (Reference Hechinger2013), a positive association between parasite body size and host body size should be detectable from empirical data, as evidenced by Harvey and Keymer (Reference Harvey and Keymer1991) and Morand et al. (Reference Morand, Legendre, Gardner and Hugot1996). Morand and Poulin (Reference Morand and Poulin2002) used a simple epidemiological model in which demographic parameters were rescaled allometrically with host and parasite body sizes to derive a theoretical explanation of the observed relationship between host and parasite body size. Specifically, by maximizing parasite's fitness as measured by the parasite reproductive number, they predicted that parasite body size scaled with host body size with an allometric coefficient that was in agreement with that derived empirically for oxyuroids, a highly host-specific group of nematodes with direct life cycles. However, Morand and Poulin's (Reference Morand and Poulin2002) modelling analysis presented a number of caveats and limitations: first, parasite induced mortality was not explicitly modelled by Morand and Poulin (Reference Morand and Poulin2002), while according to Anderson and May (Reference Anderson and May1978) and Anderson (Reference Anderson1986) this is the key epidemiological parameter through which parasites affect and possibly regulate their hosts; as a consequence, in Morand and Poulin's (Reference Morand and Poulin2002) model, host population was assumed to be constant. This contrasts with the seminal work by Anderson (Reference Anderson1978) and Anderson and May (Reference Anderson and May1978) that clearly shows that parasites can reduce host abundance with respect to the parasite-free carrying capacity. This in turn will affect the ability of further parasite species to establish in an already infected host. In addition, optimal parasite body size was derived by Morand and Poulin (Reference Morand and Poulin2002) as that maximizing the reproductive number R o – the expected number of adult parasites produced by a typical adult parasite during its entire period of reproductive maturity; Gatto and De Leo (Reference Gatto and De Leo1998) showed that parasite's competitive ability does not necessarily rank with respect to R o. Finally, Morand and Poulin (Reference Morand and Poulin2002) did not investigate the range of parasite body sizes that are potentially able to establish in an uninfected host of a given body size at its carrying capacity, nor how this range may shrink in the case the host is already parasitized by one or more competing parasite species.
Our principal aim in this paper was to address these shortcomings and extend the work by Morand and Poulin (Reference Morand and Poulin2002) to outline a theory that specifically explains how host body size may constrain the life-history traits (and hence the body sizes and abundances) of the community of macroparasites (specifically nematodes) that coexist in a population of a single host species. The questions we wanted to address are: what is the body size range of parasites that are able to invade and establish in a host? Which is the optimal size of a parasite given the size of the target host? How does the host density affect the range of different parasite species that can coexist within the same host population? How does parasite aggregation within the host's population affect this range? To answer these questions, we recast Dobson and Roberts (Reference Dobson and Roberts1994) and Roberts and Dobson (Reference Roberts and Dobson1995) in a form suggested by Gatto and De Leo's (Reference Gatto and De Leo1998) for one host and many macroparasites with density dependence setting the demographic parameters as simple allometric functions of parasite and host body size. The model, which follows the approach pioneered by Anderson and May (Reference Anderson and May1978), allowed us to determine which combination of parasite body sizes can establish and coexist in a host population of any given body size. This leads to predictions of the expected size-abundance distribution for communities of parasitic nematodes living in vertebrate hosts of different body sizes. The expected patterns were shown to conform to those observed in empirical studies. Although the analysis was mainly restricted to intestinal nematodes of vertebrates (particularly mammals), the general techniques we illustrated may be readily extrapolated to predict the structure of other parasite communities, or of ‘meta-communities’ that colonize patches of habitat whose size and birth and death rates can be readily characterized by underlying scaling rules and whose life expectancy may be affected by parasitism (e.g. insects on plants). Moreover, the scaling relationships between parasite and host birth, death and metabolic rates which ultimately determine parasite community structure should also provide insights into how these processes determine coexistence in other organisms which exhibit some form of metacommunity structure.
This work is structured into three main sections. In the first one, we presented the general macroparasitic model for mammalian hosts, we set the basic demographics parameters of the model as functions of host and intestinal nematodes body sizes and we identified the range of feasible body sizes of a pioneering species as a function of host body size by using the threshold conditions for the parasite to invade and establish into a population of an uninfected host. In the second section, following Gatto and De Leo (Reference Gatto and De Leo1998) we found the body size of the dominant parasite species, that is, the species of parasite that cannot be outcompeted by any other parasite, and then identified the range of body sizes of the parasite community able to coexist with the dominant species. In the third section, we derived the allometric coefficient of the scaling relationship between parasite body size and the parasite induced mortality rate of the host so that the theoretical prediction of the model matches the empirical observations by Morand and Poulin (Reference Morand and Poulin2002) and, finally, we discussed the results.
THE FEASIBLE BODY SIZE FOR ONE PARASITE SPECIES
Before tackling the problem of the structure of parasite communities, we must first consider a simpler problem. Suppose there is an uninfected host population at carrying capacity with a certain body size. What is the feasible body size for a parasite species to successfully invade and establish in the population of uninfected hosts? The solution of this problem for one single parasite species is central to the problem of multiple parasite infection. It provides a crucial first filter, as parasites with unfeasible body sizes cannot enter the competition to be part of the parasite community harboured by a host population. To establish whether a species can be successful we use the classical invasion criterion (R o > 1) for macroparasite models together with an allometric scaling of the demographic parameters for both the parasites and the host.
THE HOST-MACROPARASITE MODEL
The population dynamics of the host and one macroparasite species is given by the following equations (Anderson, Reference Anderson1978; Anderson and May, Reference Anderson and May1978; May and Anderson Reference May and Anderson1978):
 $$\displaystyle{{{\rm d}H} \over {{\rm d}t}} = rH\left( {\displaystyle{{{\rm 1} - H} \over K}} \right) - \alpha P$$
 $$\displaystyle{{{\rm d}P} \over {{\rm d}t}} = \displaystyle{{s\lambda PH} \over {H_{\rm o} + H}} - (\mu + \alpha + b)\;P - \left( {\displaystyle{{\alpha (P^{\rm 2} /H)(k + {\rm 1})} \over k}} \right)$$
where H and P are the number of hosts and parasites, respectively, r and K are the intrinsic rate of increase and the carrying capacity of the host population, α is the parasite-induced host mortality, λ is the fertility of parasites in the patency stage, s is the proportion of parasites that survive from prepatency to the adult reproductive stage, Ho is a semi-saturation constant that equals γ/β with γ being the mortality of parasite larvae and β the contact rate, μ is the mortality of parasites in the patency stage, b is the baseline host mortality and k is the parameter that quantifies the degree of parasite aggregation in the host population. Equation (1) is a slight generalization of Anderson and May's (Reference Anderson and May1978) model because we explicitly accounted for: (i) density dependence of host fertility a [i.e. a = b + r (1 − H/K)]; (ii) the fraction s of worms surviving through the prepatency period and reaching maturity (Morand, Reference Morand1996) which, following Morand and Poulin (Reference Morand and Poulin2002) and under considerations of slow-fast dynamics (Diekmann and Kretzschmar, Reference Diekmann and Kretzschmar1991), was set to σ/(σ + μ + α + b), with σ being the rate at which pre-reproductive worms are recruited into the adult stage.
A parasite species can establish in the host if its reproductive number (the expected number of adult parasites produced by a typical adult parasite during its entire period of reproductive maturity) is greater than unity (Anderson, Reference Anderson1978), namely if:
 $$R_{\rm o} = \displaystyle{{s\lambda K} \over {H_{\rm o} + K}}\displaystyle{1 \over {\mu + \alpha + b}} \gt 1.$$
In an equivalent way, we can recast equation (1) in terms of the mean parasite abundance M = P/H as:
 $$\displaystyle{{{\rm d}H} \over {{\rm d}t}} = rH\displaystyle{{{\rm 1} - H} \over K}{\rm} - \alpha MH$$
 $$\eqalign{& \displaystyle{{{\rm d}M} \over {{\rm d}t}}\left[ {\displaystyle{{s\lambda H} \over {H_{\rm o} + H)}} -\! (\mu + \alpha + b) \!-\! r\left( {\displaystyle{{{\rm 1} - H} \over K}} \right) \!-\! \left( {\displaystyle{\alpha \over k}} \right)M} \right]M \cr & \qquad \qquad \qquad \qquad = \left[ {\Gamma (H) - \left( {\displaystyle{\alpha \over k}} \right)M} \right]M}$$
The function Γ(H) = sλH/(H o + H) − (μ + α + b) − r (1 − H/K) can be interpreted as the rate of invasion of parasites, namely the rate of parasite increase in a population of H hosts when the parasite is initially rare (M ≅ 0). Thus, the establishment condition R o > 1 with the host at its carrying capacity can also be stated as:
 $${\it \Gamma} (K){\rm} = \displaystyle{{s\lambda K} \over {H_{\rm o} + K}} - (\mu + \alpha + b) \gt 0.$$
Essentially, the rate of parasite invasion in a host population at carrying capacity must be positive.
Both R o and Γ(K) increase with the population density of the host at the parasite-free equilibrium (K) and with the rate of demographic increase of the parasites (Λ = sλ), which is the product of fertility in the patency stage and survival from pre-patency to patency stage. In contrast, R 0 and Γ(K) decrease with the mortality of parasites in the patency stage (μ), the parasite-induced host mortality (α), and the baseline host mortality (b), and the semi-saturation constant (H o) – here we note in passing that H/(H + H o) is the proportion of parasite egg stages that successfully infect a host.
Under the above threshold conditions the hosts will eventually settle to an equilibrium
 $\bar H$
which is the unique positive solution of the following equation (obtained by setting dH/dt and dM/dt to zero):
 $${\it \Gamma} (H) - \displaystyle{r \over k}\displaystyle{{{\rm 1} - H} \over K} = 0.$$
THE ALLOMETRIC SCALING OF DEMOGRAPHIC PARAMETERS FOR PARASITE AND HOST
We want to link now the parameters of the above model to body size. When one considers vertebrate hosts, empirical evidence shows that the nutritional requirements of species with large body size constrain them to live at lower population densities and have long life expectancies and low reproductive rates (Peters, Reference Peters1983; Calder, Reference Calder1984; Schmidt-Nielsen, Reference Schmidt-Nielsen1984). Conversely, small host species are characterized by high population densities, short life expectancies and high birth rates. Parasitic nematodes also vary enormously in size and this leads to systematic changes in development rates, longevity and reproductive patterns. In general, the time between infection and the commencement of egg-laying, the pre-patent period, increases with body size (Skorping et al. Reference Skorping, Read and Keymer1991; Morand, Reference Morand1996), as do reproductive life span (though less clearly) and rate of egg production. The major pattern that emerges from a study by Skorping et al. (Reference Skorping, Read and Keymer1991) is a continuum from small nematodes with short developmental periods, low fecundity and short reproductive period (such as trichostrongyles), to larger species (like ascarid nematodes) with long developmental periods, high fecundity and long reproductive lifespan. Egg size does not seem to be associated with any other life-history trait, although a correlation between fecundity and the thickness of the eggshell and the protection it gives to the larvae cannot be ruled out (Poulin, Reference Poulin1995b ).
The result of this accumulated body of knowledge is that nearly all of the model's parameters (with the exception of the degree of aggregation of the parasite in the host population, the semi-saturation constant and the damage caused to the host by the parasite) may be estimated from published allometric relationships for hosts and parasites (Peters, Reference Peters1983; Skorping et al. Reference Skorping, Read and Keymer1991; Charnov, Reference Charnov1992, Reference Charnov1993; Morand, Reference Morand1996; Morand et al. Reference Morand, Legendre, Gardner and Hugot1996; Brown et al. Reference Brown, Gillooly, Allen, Savage and West2004; Hechinger et al. Reference Hechinger, Lafferty, Kuris, Sibly, Brown and Kodric-Brown2012). Accordingly, we recast model parameters as empirically estimated functions of either host or parasite body size, as shown in Table 1.
Summary of main model parameters and their allometric relationship with body size, along with unit of measure, the corresponding reference and the formula used to compute them. W [kg] is host body size and Ω [mm3] is parasite body size. Data for prepatent and patent period were extracted from Fig. 3 of Skorping et al. (Reference Skorping, Read and Keymer1991) and analysed with Ranged Major Axis Regression on the log-log transformed data with LMODEL2 in R: slope = 1·498, confidence interval [0·839, 2·405]; intercept = 0·142, confidence interval [−2·706, 2·211]; n = 24, r = 0·66, P < 0·001

A specific consideration is required for per-capita, per-worm, parasite-induced mortality α, as there is no empirical measure of the parasite damage to the host as a function of either host and/or parasite body size. In the case of microparasites, Cable et al. (Reference Cable, Enquist and Moses2007) have shown that interspecific variations in host metabolic rate, as indexed by host body size, influence variations in the timing of pathogenesis of viruses and bacteria: by using epidemiological data spanning 11 host species affected by anthrax and 21 by rabies, they have demonstrated that disease induced mortality scales allometrically with host metabolic rate. As for macroparasites, it is unlikely that parasite growth and reproduction within the host come without a cost: parasites sequester energy from their hosts and this may negatively impact host life expectancy. In addition, host's premature death because of parasite infection concomitantly affects the parasite life expectancy and reproductive ability. Therefore, following Hechinger's (Reference Hechinger2013) work on the metabolic theory of ecology for parasites in their host, we assumed that parasite induced mortality is proportional to the relative amount of energy that each parasite sequesters from its host (Bailey, Reference Bailey1975; Booth et al. Reference Booth, Clayton and Block1993). We acutely realize that this assumption ignores the energetics of the host's immune response to parasitic infection; partly this reflects the very limited studies of the energetic of immunity, mainly it allows us the mathematical convenience of pursuing the logic of our arguments on the simplest body-size energetic assumptions. Whence we assume that the energy processed by the host and the energy absorbed by the parasite are functions of host and parasite body size respectively, the parasite induced mortality α has been set proportional to the ratio between the metabolic rate of the parasite and that of the host, namely:
 $$\alpha ({\rm \Omega}, \;W) = \varepsilon \;\displaystyle{{{\rm \Omega} ^q} \over {W^{0 \cdot {\rm 75}}}} $$
where ε is a proportionality coefficient, W 0·75 indicates the canonical scaling low for metabolic rate of a free living host (West et al. Reference West, Brown and Enquist1997; Dodds et al. Reference Dodds, Rothman and Weitz2001; Banavar et al. Reference Banavar, Damuth, Maritan and Rinaldo2002a ; White and Seymour, Reference White and Seymour2003; Kozlowksi and Konarzewski, Reference Kozlowksi and Konarzewski2004; Savage et al. Reference Savage, Gillooly, WoodruÆ, West, Allen, Enquist and Brown2004b ), and q is the allometric parameter of the scaling law between parasite body size and its effect on parasite induced host mortality rate α. It has been argued (Hechinger et al. Reference Hechinger, Lafferty, Kuris, Sibly, Brown and Kodric-Brown2012) that the allometric coefficient for parasite metabolic rate should not be different from ¾, the typical scaling exponent derived empirically for a wide range of multicellular species. Yet, other factors (such as host immune response, or space limitation – Hechinger, Reference Hechinger2013) not necessarily scaling with parasite metabolic rate, might affect parasite induced mortality. Therefore, rather than assuming a-priori a ¾ value of the allometric coefficient q, we derived it numerically (along with the value of the scaling coefficient ε) so that expected relationship between host body size and parasite body size produced by our theoretical model matches the relationship empirically determined by using Morand and Poulin's (Reference Morand and Poulin2002) data.
As for the scaling of the semi-saturation constant H o = γ/β, the mortality of parasite larvae γ and the contact rate β are not clearly related to body size (Skorping et al. Reference Skorping, Read and Keymer1991), although egg and larvae size provide excellent indications of free-living survival and developments rates (Molnar et al. Reference Molnar, Dobson and Kutz2013a , Reference Molnar, Kutz, Hoar and Dobson b ). Therefore, for any host body size W, we have set the parameter H o to a constant suitably chosen so as to produce values of R 0 ⩽ 10 for the different Ω's (which vary between 1 and 10 000 mm3, according to Skorping et al. Reference Skorping, Read and Keymer1991 and Morand and Poulin, Reference Morand and Poulin2002).
Finally, we know of no allometric relationship for the aggregation parameter k, nor would we expect one (Poulin and Morand, Reference Poulin and Morand2000). In a comprehensive survey Shaw et al. (Reference Shaw, Grenfell and Dobson1998) have shown that while k can be fairly variable among parasitic helminth species, its value is usually constrained between 0·01 and 1. Large values of k mean that parasites are more randomly distributed in their host species, small values of k imply that parasites are highly aggregated in their distribution, with a few hosts harbouring the majority of parasite population, while most of the hosts harbour few or no parasites. We have undertaken initial calculations with k set to a common value of 0·1. This figure represents a realistic modal value for the clumping parameter according to the extensive review on estimates of k provided by Shaw et al. (Reference Shaw, Grenfell and Dobson1998). We have then explored how the distribution of body sizes in the parasite community changes for different levels of aggregation for k values ranging between 0·01 and 1.
CALCULATING THE RANGE OF PARASITE FEASIBLE BODY SIZES
Given a host of size W, a parasite can invade the host if its body size Ω is such that its reproductive number R 0 is greater than unity (or equivalently its instantaneous per-capita growth rate Γ(K) is positive). This may be evaluated by substituting the known allometric relationships into the expression for R 0 and Γ(K) and checking whether the inequality R 0 > 1 (or Γ(K) > 0) is satisfied. It can be proved that the general shape of Γ(K) as a function of parasite size Ω is that of a unimodal function. Figure 1 shows the shape of Γ(K) for a 100 kg host obtained by using the estimates of ε and q that will be detailed in the next section and the clumping k = 0·1.To stress the dependence of Γ upon the parasite and the host body size, we will use from now on the notation Γ(H; Ω,W). For any given host body size W, there is a corresponding range of parasite species with body size [Ω−, Ω+] that are able to invade the host, namely Γ(K; Ω,W) > 0 for Ω− < Ω < Ω+, and Γ(K; Ω−,W) = Γ(K; Ω+,W) = 0. Parasites with size exceeding the upper bound Ω+ cannot establish in the population, because they will kill their host (and, consequently, die with it) before producing enough adult parasites to replace themselves (R o < 1) during the period of their reproductive maturity. Parasite species having a size smaller than the lower bound Ω− cannot establish either, as their lifetime reproductive output, which is a function of parasite body size, is too small to replace themselves. Any parasite species having size between Ω− and Ω+ can invade and establish in a population of uninfected hosts at their carrying capacity K, as their per capita population growth rate is positive within this range.
The instantaneous per capita population growth rate Γ(H) as a function of parasite body size for a host of 100 kg (k = 0·1, q = 0·698, ε = 3·33). The thick line represents Γ(H), namely the population growth rate when the host population attains the expected carrying capacity K w according to the allometric relationship for herbivore density and body size. The other thin lines correspond to the population growth rate Γ(H) when actual host density is only 80, 60, 40 and 20% of the expected carrying capacity K w, Ω−, and Ω+ define the lower and upper bound of body sizes of a pioneer species capable of invading an uninfected host population at its carrying capacity K w.

When we analysed the value of Ω− and Ω+ over a range of host body size W, we found that the lower bound Ω− increases allometrically with host body size (Fig. 2). As host density decreases with host body size, small parasites that would be able to establish in a high density host population might not be able to do so when the host population is sparser at higher host body sizes. The upper bound Ω+ also increases allometrically with host body size, as the energetic impact of a parasite of body size Ω on a host with a small body size is larger than on a host with a larger body size.
The relationship between host body size and parasite body size. The open squares represent the data derived from Morand et al. (Reference Morand, Legendre, Gardner and Hugot1996). The thick grey line represents the body size of the parasite dominant species for any host body size. The lower and upper dashed lines delimit the range of parasite size Ω− and Ω+ able to invade and establish in a population of uninfected hosts at carrying capacity as predicted by our theoretical model. The upper and lower black lines delimit the range of body sizes Ω1 and Ω2 of parasites that can invade and coexist with the dominant species. (A) Clumping parameter k = 0·01; (B) k = 0·1; (C) k = 1.

THE RANGE OF VIABLE BODY SIZES IN A PARASITE COMMUNITY
When a parasite species belongs to a community of parasites co-occurring in a host of a given size, the lower and upper bounds derived in the previous section do not represent the ultimate constraint to its body size. Those bounds simply set a limit for a single parasite species to establish in an uninfected host population. As the presence of any other parasite species will lead to some reduction in host abundance, the predicted body size range for the establishment of a single parasite species exceeds the range of body sizes when more than one species of parasite coexist in the host population. This can be intuitively understood by again considering Fig. 1, in which we specify the invasion condition for host densities proportionately lower than carrying capacity.
The issue of optimal life histories has received a lot of attention in physiological ecology (e.g. Schmidt-Nielsen, Reference Schmidt-Nielsen1984; Stearns, Reference Stearns1992; Charnov, Reference Charnov1993). Different criteria can be used depending on the conditions under which natural selection is operating. Here we use the criterion of non-invasibility of a host-parasite complex at the coexistence equilibrium by a parasite with different body size. This criterion is a K-selection principle and should hold under the assumptions that (1) the populations of hosts are not subject to large fluctuations in their numbers due to intrinsic demographic instability or changing environmental conditions; and (2) the free-living stages of parasites are exposed to an environment that might be very harsh but rather stable from year to year (the internal stages are obviously developing in a very stable environment). The first assumption is likely to be met by a large number of vertebrates, whereas the second assumption may not be met by many parasite species and this is a limitation of our theory. We suspect that variability in host abundance may allow more parasite species to coexist at lower average abundance as fluctuating environmental conditions may also allow different species to coexist (Vance, Reference Vance1985).
The mathematical characterization of the criterion requires us to establish under which conditions a parasite species is eventually outcompeted by other parasites. To do this, we can generalize equation (1) to the case of one host and many parasites (Dobson, Reference Dobson1985; Dobson and Roberts, Reference Roberts and Dobson1995; Roberts and Dobson, Reference Roberts and Dobson1995; Gatto and De Leo, Reference Gatto and De Leo1998) and then find the resulting stable equilibrium for the multi-parasite community. Under the assumption of pure exploitation competition (no synergism or antagonism between the parasite species) a community of n-parasite species in one host population may be described by the following set of equations:
 $$\displaystyle{{{\rm d}H} \over {{\rm d}t}} = rH\displaystyle{{{\rm 1} - H} \over K}{\rm} - \sum\limits_i {\alpha _i \;P_i} $$
 $$\displaystyle{{{\rm d}P_j} \over {{\rm d}t}} = P_{\,j} {H} \displaystyle{{s_{\,j} \lambda_{\,j} H} \over {H_{{\rm o} {\,j}} + H}} - (\mu_{\,j} + \alpha_{\,j} + b) - \sum\limits_{i} {\alpha _{i} \;P_{i} - \displaystyle{{\alpha _{\,j} P_{\,j}} \over {k_{\,j} H}}} $$
where j = 1,…, n is an index specifying the parasite species. In terms of the mean parasite abundances M j = P j /H, we can also utilize the following equivalent system:
 $$\displaystyle{{{\rm d}H} \over {{\rm d}t}} = \left[ {r\displaystyle{{1 - H} \over K} - \sum\limits_i {\sum\limits_i {\alpha _i \;M_i}}} \right]H$$
 $$\displaystyle{{{\rm d}M_j} \over {{\rm d}t}} = \displaystyle{{s_{\,j} \lambda _{\,j} H} \over {H_{{\rm o} {\,j}} + H}} - (\mu _{\,j} + \alpha _{\,j} + b) - r\displaystyle{{1 - H} \over K} - \left( {\displaystyle{{\alpha _{\,j}} \over {k_{\,j}}} \;M_{\,j}} \right)M_{\,j} $$
Let us now suppose that each parasite species has a characteristic body size Ω j and the host a body size W. Then, we can synthetically rewrite equation (6) as
 $$\displaystyle{{{\rm d}H} \over {{\rm d}t}} = \left[ {r\displaystyle{{1 - H} \over K} - \sum\limits_i {\sum\limits_i {\alpha _i \;M_i}}} \right]H$$
 $$\displaystyle{{{\rm d}M_j} \over {{\rm d}t}} = \left( {\Gamma (H;\;\Omega _j, \;W) - \displaystyle{{\alpha _j} \over {k_j}} M_j} \right)M_j $$
where Γ(H; Ω j , W) is the rate of invasion of parasite species j of body size Ω j , namely the rate of increase of j in a population of H hosts of body size W, when the species is initially rare (Mj ≈ 0).
We recall that:
 $$\eqalign{& \Gamma (H;\;\Omega, \;W) = s(\Omega, \;W)\;\lambda (\Omega )\displaystyle{H \over {H_{\rm o} + H}} - (\mu (\Omega ) \cr & \quad + \alpha (\Omega, \;W) + b(W)) - r(W) \left( {\displaystyle{{{\rm 1} - H} \over K}(W)} \right)}$$
where s, λ, μ, α, b, r and K are given by the corresponding allometric relationships. As we said in the previous section, parasite j can spread in a parasite-free host population if Γ(H; Ω j , W) is positive, i.e. R oj > 1. Of course, from now on we assume that all the species we consider satisfy this assumption, otherwise they would go extinct even without any interspecific competition. This implies that any parasite we will consider has a body size between Ω− and Ω+.
We have to find now a stable community of parasite species coexisting in the same host population. It has been shown by Roberts and Dobson (Reference Roberts and Dobson1995) and Gatto and De Leo (Reference Gatto and De Leo1998) that the community of parasite species coexisting at the stable equilibrium is obtained by ranking the species according to the minimum host density H* for parasite invasion, that is the threshold density of the host above which a parasite species can grow when rare. In fact, as Γ(H; Ω
j
, W) is an increasing functions of H such that Γ(0; Ω
j
, W) = − (μ
j
+ α
j
+ b + r) < 0 and Γ(K; Ω
j
, W) > 0, there exists a unique H
j
*, with 0 < H
j
* < K, such that Γ(H
j
*; Ω
j
, W) = 0. It follows that Γ(H; Ω
j
, W) is negative for H < H
j
*, and positive for H > H
j
*. Note that the host density
 $\bar H_j $
at the disease equilibrium when only parasite j is present is larger than H
j
* and set by equation (3). Species can be ranked by competitive ability in terms of their H
j
*, the minimum size of the host population at which they can establish: the lower H
j
*, the higher their competitive ability (Roberts and Dobson, Reference Roberts and Dobson1995; Gatto and De Leo, Reference Gatto and De Leo1998).
We can therefore define the dominant species – and the corresponding parasite body size Ωd – as the one characterized by the lowest H* at the Ωd solution of the optimization problem:
 $$\mathop {{\rm min}}\limits_{\Omega \gt 0} \,H^{\ast}\left( {\Omega ,\displaystyle{W \over {\varepsilon ,q,k}}} \right)$$
Here we point out that the resulting Ωd = Ωd(W/ε, q, k) depends on the host body size W, but also on the values of ε, q, k, which are yet to be chosen. Unlike the case of many predators competing for the same prey, the dominant parasite species does not necessarily competitively exclude parasite species with a different body size, largely because aggregation in the distribution of each parasite species across the host population permits coexistence (Dobson, Reference Dobson1985; Roberts and Dobson, Reference Roberts and Dobson1995). Parasite species invade the dominant species because their rate of increase at the host density
 $\bar H_{\rm d} $
set by the dominant species is positive. To find the parasite species that can invade the dominant parasite, it is convenient to introduce a continuous spectrum of body sizes by using approximations very similar to those used in niche theory (MacArthur and Levins, Reference MacArthur and Levins1967; MacArthur, Reference MacArthur1970; Roughgarden, Reference Roughgarden1979). Accordingly, instead of considering a finite number of parasite species and a discrete distribution of body sizes, we assume a continuous distribution of parasite body size Ω. Here we introduce the concept of per-capita ‘parasite mean density M(Ω)′: it implies that a host carries an abundance M(Ω) dΩ of parasites of sizes ranging between Ω and Ω + dΩ. M(Ω) satisfies equation (6·2) with j replaced by Ω, whereas the term Σ
i
αi M
i
in equation (6·1) must be replaced by
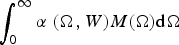 $\int_0^\infty {\alpha \;(\Omega, W)M(\Omega ){\rm d}\Omega} $
, with α(Ω,W) the allometric relationship between parasite induced mortality and parasite and host body sizes. We can therefore define the host density
 $\bar H$
at disease equilibrium (see equation (3)) as a function of Ω and W. It is simply the root of the equation:
 $$\Gamma \left( {\displaystyle{H \over {\Omega, \;W}}} \right) - r(W)\displaystyle{{\left[ {({\rm 1} - H/K)(W)} \right]} \over k} = 0$$
which is the equilibrium density of the host population of body size W when infected by a single parasite species of body size Ω. Note that in general
 $\bar H$
> H* (the threshold host density for parasite invasion).
Let
 $\bar H_{\rm d} $
be the host density at equilibrium when only the dominant species is present. According to equation (3)
 $$\Gamma \left( {\displaystyle{{{{\bar H}_{\rm d}}} \over {{\Omega _{\rm d}},\;W}}} \right) - \displaystyle{{r(W)} \over k}\displaystyle{{{\rm 1} - {{\bar H}_{\rm d}}} \over {K(W)}} = 0$$
In general, for any given W, Γ(
 $\bar H_{\rm d} $
/Ω, W) is unimodal with respect to Ω. Therefore, the equation Γ(
 $\bar H_{\rm d} $
/Ω, W) = 0 defines the upper and lower bound of an interval [Ω1, Ω2] inside which Γ(
 $\bar H_{\rm d} $
/Ω, W) > 0. By necessity, the body size of any species coexisting with the dominant species must lie inside [Ω1, Ω2]. In fact, these species must exhibit a positive per capita growth rate in order to be able to invade a host population already parasitized by the dominant species. As we will illustrate below (Fig. 3), the net effect of this is to shrink the range of parasite body sizes that can coexist as a community below the range of those that could establish in the host in the absence of other parasite species; the community niche of the parasites, is narrower than the fundamental niche attainable if only single species dynamics are considered.
COMPARING THEORETICAL PREDICTION WITH EMPIRICAL DATA
Our theoretical model provides an expected relationship between host body size and parasite body size whose slopes depends, given all the other parameters, upon the unknown parameters ε and q of the relationship (4). The goal was thus to numerically set up the value of ε and q so that to tightly reproduce the relationship empirically estimated by Morand and Poulin (Reference Morand and Poulin2002) on Oxyuridae. As Morand and Poulin (Reference Morand and Poulin2002) provided the allometric coefficient but not the intercept of the relationship between host body size and parasite body size, we digitized the data of Fig. 3 in their paper and estimated slope and intercept by using Ranged Major-Axis (RMA) regression with LMODEL2 Package in R 3·01 on the log-log transformed data of host body mass (kg) and parasite body volume (mm3). The resulting slope was 0·746, with confidence interval [0·484, 1·107] and intercept −1·761, with confidence interval [−3·017, −0·848], (P < 0·001, n = 41).
We then used our theoretical model on the bioenergetic scaling of a single host-multi parasites system to derive the expected relationship between the body size W of the target host and that of the dominant parasite species Ωd = Ωd(W/ε, q, k) (i.e. the parasite species characterized by the lowest H*, the host density at the disease equilibrium) and set ε and q of the scaling law (4) so that the relationship predicted by the model through equation (9) matched that empirically estimated on Morand and Poulin's (Reference Morand and Poulin2002) data, namely q = 0·698 and ε = 3·33 Using these estimated value of q and ε, we derived the allometric relationships for Ω− and Ω+, which identify the range of pioneer species, that is the range of parasites that can invade and established in a population of an uninfected host at its carrying capacity for any given host body size W (Fig. 2). Similarly, we computed the range [Ω1, Ω2] of body sizes of parasites coexisting with the dominant species inside the host. As shown in Fig. 2, also the upper and lower bounds Ω1 and Ω2 scale allometrically with host body size.
The influence of host density on parasite body size
Host density plays a crucial role in determining the ability of a parasite to invade its host. If host density at its carrying capacity is lower than that expected from its ‘predicted’ allometric relationship between host density and host body size (Peters, Reference Peters1983), the range of feasible parasite body sizes decreases. As shown in Fig. 1 for a host of a 100 kg, if the host population attains its expected carrying capacity (K w = 1·4 individuals/km2, Peters, Reference Peters1983), any parasite having a body size between 10 and 2000 mm3 can invade and establish an uninfected host population (as Γ(1·4; Ω,100) > 0), but if host density is only 20% of the expected K, the range of feasible parasite body sizes shrinks to [100, 1000] mm3. Of course, the converse of this also applies, if hosts are maintained at unusually high population densities, as occurs with domestic livestock, or in recently fragmented natural habitats. Then, a wider range of parasite species may be able to establish in the host population.
In the next section we will show that the determination of the influence of host density on parasite body size is also important when assessing whether a parasite species can invade a host already parasitized by another species.
The size of the parasite community
Figure 3 illustrates the population density H* of a host of 100 kg as a function of parasite body size and the value Ωd (body size of the dominant species) for which H* is minimum. As shown in the figure, the interval [Ω1, Ω2] for a parasite community that already includes the dominant parasite species can be substantially smaller than the range of invasion [Ω−, Ω+] for pioneer species. While the feasible body sizes [Ω−, Ω+] of a pioneer species are not affected by the degree of parasite aggregation within the host population, the clumping parameter k plays an important role in allowing coexistence when more than one species is present within the same host population. In fact the actual value of
 $\bar H_{\rm d} $
(the host population density at the equilibrium when infected by the dominant parasite species) increases with the degree of aggregation of the dominant parasite species, because it must satisfy the equation Γ(
 $\bar H_{\rm d} $
/Ωd,W) − r(W)/k· (1 −
 $\bar H_{\rm d} $
/K
w) = 0. As a consequence, the range [Ω1, Ω2] of feasible body sizes for the parasite community decreases when parasites are less aggregated in their distribution (larger values of the clumping parameter k). This implies that when the degree of aggregation is high (low values of k), more parasite species are likely to coexist within the same host population, which is consistent with theoretical arguments by Dobson and Roberts (Reference Dobson and Roberts1994) and Gatto and De Leo (Reference Gatto and De Leo1998). This is clearly illustrated in Fig. 2a–c for the three different values of the clumping parameter. As increasing aggregation of the dominant parasite species implies a higher population density of the host at the diseased equilibrium, it is apparent that the smaller is k, the larger is the range of parasite sizes that can coexist with the dominant species.
The top line is the host population density H* at equilibrium – represented as a proportion of the expected parasite-free carrying capacity of a host of 100 kg – when the population is invaded by a parasite species of size Ω (k = 0·1, q = 0·698, ε = 3·33). Ω− and Ω+ are as in Fig. 1 and identify the range of parasite body sizes that can successfully invade and establish in a population of uninfected host at carrying capacity. Obviously, H* = K (and P = 0) for Ω < Ω− and Ω > Ω+. The dominant species – here represented by a dotted circle – is that characterized by the lowest threshold density H* for the invasion of the host population. Any other parasite coexisting with the dominant species needs to have size between Ω1 and Ω2, as only in this range the population growth rate at invasion Γ(H/W, Ω), represented at the bottom line, is positive.

In conclusion the results presented in this paper have blended together a mathematical model for the population dynamics of parasitic helminth communities with known empirical body-size scaling relationships for the parasites and their hosts. This allowed us to predict from first principles the body sizes of the community of parasitic nematodes that can coexist in a mammalian host of any given size. We then compared how the parasite community of hosts might change following evolutionary changes in parasite (or host) body size (Morand and Poulin, Reference Morand and Poulin1998). The work presented here provides a functional explanation for the empirical observations documented by Morand et al. (Reference Morand, Legendre, Gardner and Hugot1996) that clearly show an empirical relationship between host and parasite body size. In contrast to Morand and Poulin (Reference Morand and Poulin2002), our model assumed explicitly that parasites have an impact on host life expectancy and, ultimately, on its dynamics, as expressed by parasite induced mortality which was set as a function of the ration between parasite metabolic rate and host metabolic rate. Our model correctly predicts upper and lower boundaries for parasites able to invade and establish in a population of uninfected hosts. Further simulations run by keeping parasite induced mortality α constant regardless of parasite body size Ω (in contrast to a function of the ratio between parasite metabolic rate and host metabolic rate as in equation (4)) produced an unrealistically high upper bound for parasite size, as fecundity and longevity increased with parasite body size without any strong negative feedback on host life expectancy and, ultimately, on parasite life expectancy either.
As herbivores usually attain higher population densities than carnivores of the same size (Peters, Reference Peters1983; Owen-Smith, Reference Owen-Smith1988; Silva and Downing, Reference Silva and Downing1995), our model predicts that the former should harbour a more diverse community of directly transmitted parasites. Although there may well be a number of other confounding factors operating when we compare field data that might be used to falsify this conjecture; carnivores might not only harbour their own specific parasites, but also the subset of complex life cycle parasites that might be transmitted to them while feeding on their herbivore prey. Such complexities await both further modelling and further empirical analysis, but the underlying energetic assumptions of our model should also apply to parasites with complex life cycles; all that is lacking are the scaling laws for cestodes and trematodes, and data on the energetics of immunity to these parasites. Our analysis shows that our prediction of an allometric slope close to 3/4 on the basis of theoretical considerations is strongly consistent with empirical data. As a consequence, our hypothesis that the energetic determinant of parasite pathogenicity constrains the size of the parasites able to invade a host cannot be rejected on the basis of empirical observations.
Interestingly, our theoretical prediction on the bio-energetic scaling of a single host-multi parasite system resonates with the predator-prey theory for food webs described by Brose et al. (Reference Brose, Williams and Martinez2006) and by Hechinger et al. (Reference Hechinger, Lafferty, Dobson, Brown and Kuris2011) on the allometric scaling of parasites and predator body sizes in complex food webs. In the case of a single host-multi parasite system, increasing the ratio between parasite and host body size above a minimum threshold also allows a parasite species to steadily invade it host. On the other hand, the host body size provides a finite environment in which the intestinal nematode can grow. As a consequence, this also sets an upper constraint to the parasite body size. This is because parasites with very large body size relative to their host, even though they exhibit high fertility once they reach the reproductive phase, might not be able to successfully infect at least another uninfected host before the animal that harbours the primary infection dies. This can occur either because the duration of the pre-patency period increases with parasite body size thus delaying reproduction, or because larger parasites can seriously harm their host thus reducing its life expectancy (and when a host dies, its parasites usually die with it). With respect to the complex prey-predator food webs analysed by Brose et al. (Reference Brose, Williams and Martinez2006), the parasite body size in our simple host-multi parasite system is readily bounded between a minimum and a maximum value that also scale allometrically with host body size; this expands their more restricted conditions for predator-prey interactions that ultimately preclude the presence of host-parasite relationships! The recent work by Lafferty et al. (Reference Lafferty, DeLeo, Briggs, Dobson, Gross and Kuris2015) provides a framework that could be melded with the analysis described here and provides a direct way of comparing the relative roles of predators and parasites in food webs.
The allometric coefficient q relating the parasite body size to damage to the host is very close to the canonical 3/4 usually considered valid for most taxonomic groups (Savage et al. Reference Savage, Gillooly, WoodruÆ, West, Allen, Enquist and Brown2004b ), a scaling that is frequently observed, thus supporting the hypothesis that metabolic requirements for macroparasite might not be different from those of the majority of multicellular organism (Hechinger et al. Reference Hechinger, Lafferty, Kuris, Sibly, Brown and Kodric-Brown2012; Hechinger, Reference Hechinger2013).
The primary determinant of the coupling between host and parasite body sizes is provided by the relationship between the fertility and virulence of the parasite. We have attempted to model this based on a relatively simple energetic argument as a number of experimental studies have provided evidence that parasitic helminths have a significant impact on the energy budgets of their hosts (Booth et al. Reference Booth, Clayton and Block1993; Hudson and Dobson, Reference Hudson, Dobson, Grenfell and Dobson1994). Plainly this ignores any immune response that the host mounts to control the parasite. This is likely to be energetically costly to both the host and the parasite (Berding et al. Reference Berding, Keymer, Murray and Slater1986). Moreover, the cost to the host is unlikely to scale in a simple way with parasite abundance (Wakelin, Reference Wakelin1984).
In terms of optimal strategies, it is trivial to acknowledge that macroparasites should evolve to maximize their reproductive rate (i.e. their fitness). This can best be accomplished by an increase of overall egg production during parasite life span. Increase in overall eggs output can be achieved either by living for longer, or by producing eggs more quickly. This typically occurs for parasite species with large body size, as both data by Morand (Reference Morand1996) and Skorping et al. (Reference Skorping, Read and Keymer1991) show that larger parasite live longer and produce more eggs. Parasite fitness indeed increases only if an increase in their life span and in per capita eggs production would come without a cost for the host. However, an increase in parasite egg production (driven by an increase in body size) leads to an increase in the energy sequestered by the parasite from its host, and therefore to an incremental increase in host mortality. As in the most classical trade-offs in ecology and evolutionary biology (Stearns, Reference Stearns1992; Charnov, Reference Charnov1993), host exploitation by the parasite will eventually reduce parasite life expectancy and consequently the opportunity for the parasite to produce infective stages that will infect another uninfected host. Negative interactions between the rate of parasite reproduction and host pathology are also predicted by theoretical analysis and observations in microparasites (Fenner, Reference Fenner1983; May and Anderson, Reference May and Anderson1983; Dwyer et al. Reference Dwyer, Levin and Buttel1990; Osnas and Dobson, Reference Osnas and Dobson2010, Reference Osnas and Dobson2012) and macroparasites (Poulin, Reference Poulin1995a , Morand and Poulin, Reference Morand and Poulin1998).
The results described above may have more general significance. Many communities of organisms are structured as meta-communities, with a relatively long living host species providing resources for a community of ‘guest’ species. Most insect communities on plants are structured this way, as are most fish and invertebrate communities on corals. Fairly simple modifications to the framework described in this paper would allow us to examine the dynamics of these communities. Although we will consistently be confounded by the fact that the observed degree of aggregation of a consumer in the resource (host) population will reflect a complex interaction between differences in hosts susceptibility, genetic variation within the consumer and resource populations and variability in consumer virulence and hosts' immunological and tolerance susceptibilities. Nevertheless, we feel that many of the main results described above will apply to other types of ecological community; certainly it is trivial to acknowledge that membership and relative abundance of the insect community inhabiting a plant population will reflect the birth, death and movement rates of those insect species. But the analysis outlined above suggests there will be allometric constraints on the life history of the insects (or fish) that can utilize any plant (or coral) species. Coexistence of those insect (or fish) species that can establish will be dependent upon their statistical distribution across the plant population; as occurs with parasitic helminths. We thus hope the results presented above for macroparasites can lead other ecologists to examine how allometric scaling of birth and death rates can interact with the more subtle forces that determine aggregation to determine the relationships between body size and abundance of species in all types of ecological communities.
FINANCIAL SUPPORT
This work was supported in part by the National Center for Ecological Analysis and Synthesis (a centre funded by NSF grant No. DEB-0072909, the University of California at Santa Barbara, Seasonality and Infectious Diseases Group) (A. D. and G. D. L.), by MUR project Internazionalizzazione del Sistema Universitario II O4 CE 4968 and by a Grant on Complexity to APD from the McDonnell Foundation. G. D. L. was partially supported by a grant from the Woods Institute's Environmental Venture Projects at Stanford University and from NSF CNH 1414102.



