I. INTRODUCTION
Gold and silver nanoparticles embedded in dielectric matrices (metal/dielectric composite materials) have a wide variety of beautiful colors associated with the localized surface plasmon resonance (LSPR) absorption and are of scientific and technological interest. The composite materials have been widely studied as resonant-type third-order optical nonlinear materials for potential use in photonic devices.Reference Ricard, Roussignol and Flytzanis1 It is known that the third-order optical nonlinearities of the composite materials are influenced by the kind and size of the embedded metal particles, the dielectric constant (refractive index), and the thermal conductivity of the dielectric matrices. Various kinds of materials such as SiO2, Al2O3, and TiO2 have been investigated for the dielectric matrices. Especially, TiO2 with high refractive index seems to be a desirable dielectric for the matrices. The metal/dielectric composite materials have been prepared by various methods such as melt quenching,Reference Uchida, Kaneko, Omi, Hata, Tanji, Asahara, Ikushima, Tokizaki and Nakamura2 sol–gel,Reference Matsuoka, Mizutani, Kaneko, Nasu, Kamiya, Kadono, Sakaguchi and Miya3 ion implantation,Reference Arnold and Borders4 sputtering,Reference Tanahashi, Yoshida, Manabe, Tohda, Sasaki, Tokizaki and Nakamura5, Reference Tanahashi, Manabe, Tohda, Sasaki and Nakamura6 and deposition–precipitation.Reference Cui, Hua, Wei, Li, Gao and Shi7 Among these methods, multitarget sputtering seems to be suitable for the fabrication of various types of metal/dielectric composite thin films. A wide variety of composite thin films with a high concentration of metal nanoparticles is easily prepared by the appropriate choice of metal and dielectric matrix for the sputtering. The dielectric matrix with a high melting point is also easily prepared by this method.
The value of the third-order nonlinear susceptibility, χ(3), of the composite materials depends on the pulse duration of the laser used in the evaluation. The contribution of the heat accumulation to the value of χ(3) becomes large with increase in the pulse duration of the laser used in χ(3) measurements. The χ(3) has been mainly obtained by using the Z-scan and degenerated four-wave mixing method. The Z-scan method is a sensitive and simple method for the determination of the values and sign of the imaginary and the real parts of χ(3). Only few studies have been conducted on the femtosecond third-order optical nonlinear properties of Au nanoparticles embedded in TiO2 dielectric matrix thin films (Au/TiO2 films) by the Z-scan.
In this study, we report on the preparation, characterization, and third-order nonlinear optical properties of the Au/TiO2 films evaluated by the Z-scan and the pump-probe method in the femtosecond time region.
II. EXPERIMENTAL
Au/TiO2 films were prepared by the multitarget sputtering system. The Au (99.9%) and TiO2 (99.9%) targets of 3 inches in diameter were independently manipulated. The Au and TiO2 were deposited alternatively onto synthetic quartz (SiO2) glass (0.5 mm in thickness) or GaAs (0.35 mm in thickness) substrates. The substrates were not intentionally heated. The concentration of Au in the films was controlled by adjusting the deposition time. The radio frequency powers applied for Au and TiO2 were 25 and 200 W, respectively. The sputtering was carried out in the gas mixture of 50% Ar and 50% O2 (total gas pressure of 2.0 Pa). The heat treatment of the as-deposited films was carried out at 600, 700, 800, 900, and 1000 °C in air to control the size of the Au particles. The typical heat treatment time was 1 h.
X-ray diffraction (XRD) measurements were performed to investigate the crystallinity of the films and the mean diameter, d, (crystallite size) of Au particles in the films. The mean diameter was estimated using Scherrer’s equation. The nature of the chemical bond of the films was investigated by x-ray photoelectron spectroscopy (XPS) using a Mg Kα x-ray source. The morphology of the films and the diameter of the Au particles were examined directly by cross-sectional transmission electron microscopy (TEM) and the electron diffraction in the TEM. The composition of the films on GaAs substrate was determined by wavelength dispersive electron probe microanalysis.
Optical absorption spectra of the Au/TiO2 films were obtained by a double beam spectrophotometer at room temperature. The nonlinear refraction and absorption coefficients of the films were measured using the standard Z-scan technique with the optical parametric amplifier (OPA) pumped by the Ti:sapphire regenerative amplifier. The typical pulse energy and the pulse duration were 1 μJ and less than 150 fsec, respectively. In the Z-scan measurement, we used fused silica as the standard material. The value of χ(3) for fused silica was evaluated to be 1.3 × 10⁻¹⁴ esu from fitting with the data in Refs. 8 and 9. In the femtosecond pump-probe experiment, the OPA pumped by the Ti:sapphire regenerative amplifier was used. The wavelengths of the pump and probe laser beams were near the LSPR peak of the films. The typical pulse energy and the pulse duration were 1 μJ and less than 200 fsec, respectively.
III. RESULTS AND DISCUSSION
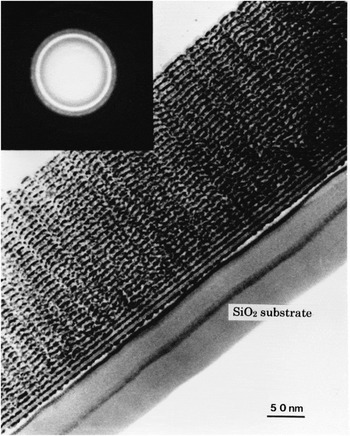
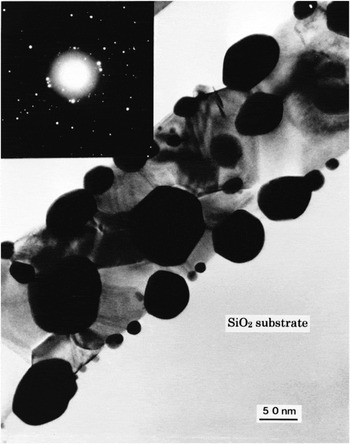
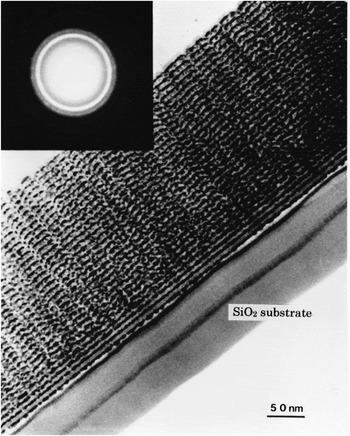
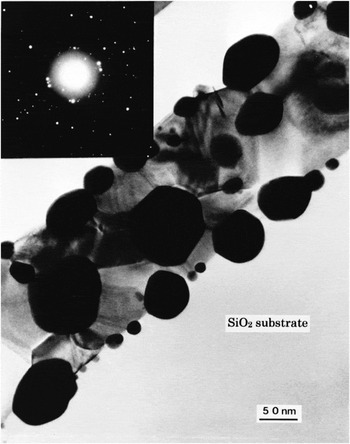
Figures 1 and 2, respectively, show the cross-sectional TEM images of the as-deposited Au/TiO2 film and the film heat-treated at 1000 °C for 1 h together with the electron diffraction pattern of a selected area. The film was prepared by alternate deposition of Au and TiO2 30 times. The concentration of Au in the film was 29.6 at% (Au/Au+Ti). The thickness of the as-deposited and heat-treated Au/TiO2 film shown in Figs. 1 and 2 were 250 and 190 nm, respectively. In Fig. 1, 30-layer structure is clearly seen and the Au particles are clearly recognized as dark contrast spots with diameters ranging from 2 to 6 nm in the layer. After the heat treatment, the film became thinner and the Au particles became larger. It is noteworthy that the particles grew and penetrated into the synthetic quartz (SiO2) glass substrate. It seems that the nanometer-sized Au particles were grown catalytically in the presence of TiO2. The electron diffraction pattern of the selected area of the as-deposited and the heat-treated film show diffraction rings attributed to the Au metal. The broad diffraction rings shown in Fig. 1 indicate that the size of Au particles is small in the as-deposited film. On the other hand, in Fig. 2, the spotty diffraction rings that could be indexed as the reflections of the Au metal indicate the larger crystallite size. Thus, the size of the Au particles in the films could be controlled by the heat treatment in air.
Cross-sectional TEM image of the as-deposited Au/TiO2 film (29.6 at% of Au) together with the electron diffraction pattern of a selected area.
Cross-sectional TEM image of the Au/TiO2 film (29.6 at% of Au) heat-treated at 1000 °C for 1 h together with the electron diffraction pattern of a selected area.
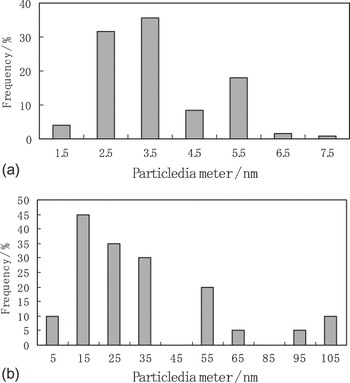
Figures 3(a) and 3(b) show the particle size distribution obtained from the analysis of the TEM micrographs shown in Figs. 1 and 2, respectively. A part of the micrograph field including 200 (Fig. 1) and 32 (Fig. 2) particles were randomly selected to analyze the size. On the one hand, the mean diameter of Au particles in the as-deposited film was estimated to be 3.6 nm. On the other hand, the mean diameter of Au particles in the heat-treated film was estimated to be 29.6 nm. The mean diameter of the Au particles in the heat-treated film was one order of magnitude larger than that in the as-deposited film.
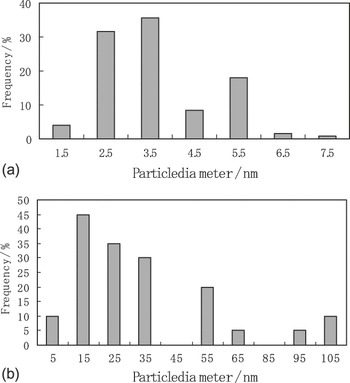
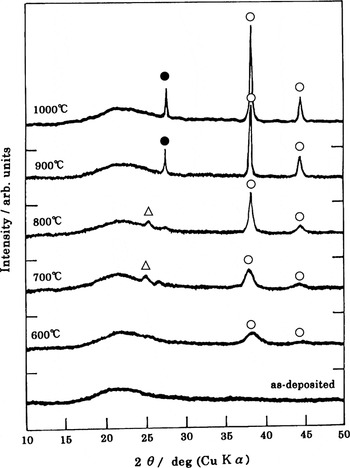
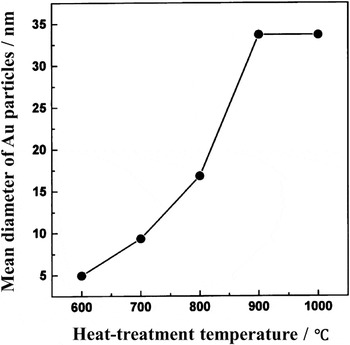
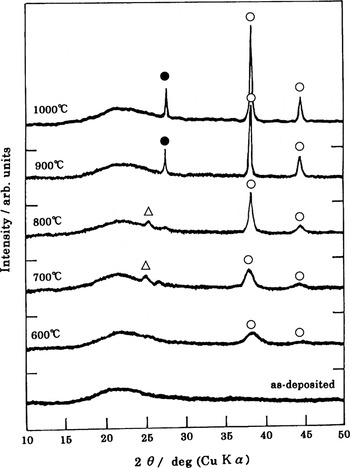
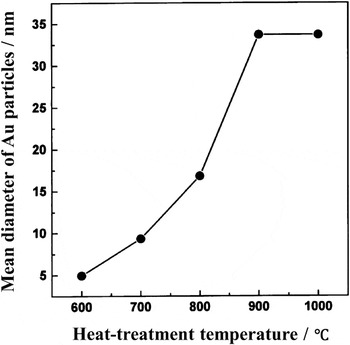
Figure 4 shows the XRD patterns of the as-deposited Au/TiO2 film and the film heat-treated at 600, 700, 800, 900, and 1000 °C in air for 1 h. The TEM images of the as-deposited film and the film heat treated at 1000 °C are shown in Figs. 1 and 2, respectively. In Fig. 4, the as-deposited film shows only a halo pattern of amorphous SiO2 glass substrate in a range of 2θ of 18°–25°. On increasing the heat treatment temperature, the intensity of the peaks at 38.1° and 44.3° increases, which are, respectively, assigned as (111) and (200) reflection lines of cubic Au. The crystal structure of the TiO2 matrix changed from anatase to rutile at the heat treatment temperature above 900 °C. Beside the case of the as-deposited Au/TiO2 film, the mean diameter (crystallite size) of Au particles in the films shown in Fig. 4 was estimated from the broadening of the (111) line. Figure 5 shows the relation between the mean diameter of Au particles in the films shown in Fig. 4 and the heat treatment temperature. The mean diameter of the Au particles increases from 4.9 nm at 600 °C to 33.7 nm at 900 °C and it becomes constant. It is noteworthy that the Au particles grow in the film even at the temperature of 600 °C. These results indicated that the size of Au particles could be controlled by changing the heat treatment under the melting point of bulk Au (1064.4 °C).
X-ray diffraction (XRD) patterns (●, Au; Δ, anatase; ●, rutile) of the as-deposited Au/TiO2 film and the film heat-treated at 600, 700, 800, 900, and 1000 °C in air for 1 h.
Relation between the mean diameter of Au particle from the XRD shown in Fig. 4 and the heat-treatment temperature of the films.
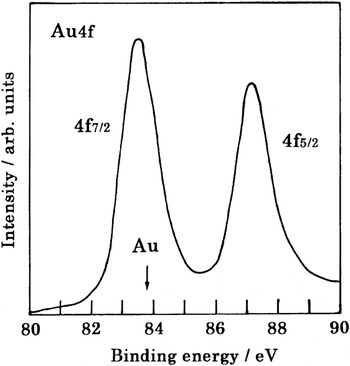
XPS experiments were performed to elucidate the chemical state of the Au particles in the Au/TiO2 film (shown in Fig. 1). Figure 6 shows the Au 4f electron spectrum of the film. The spin doublet of Au 4f, i.e., Au 4f5/2 and Au 4f7/2, is clearly observed. The binding energy of the experimental peak position of the 4f7/2 was almost the same as that of the standard Au metal as indicated by an arrow in Fig. 6. Thus, the Au particles in the film were likely to be metallic Au. The electron spectrum of the Ti 2p and O 1s for the Au/TiO2 film exhibited the TiO2 structure. These results confirm that Au metal and TiO2 are successfully formed by the multitarget sputtering method.
Au 4f electron spectrum of the as-deposited Au/TiO2 film shown in Fig. 1.

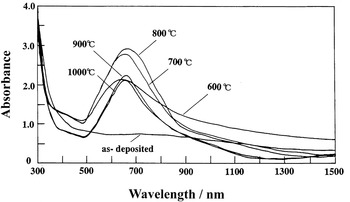
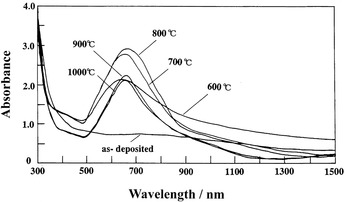
Figure 7 shows the optical absorption spectra of the Au/TiO2 films, and Fig. 4 shows the XRD spectra of the Au/TiO2 films. In Fig. 7, the absorption peaks due to the LSPR of the Au particles are observed at the wavelength of 658–668 nm. The LSPR peak of the Au/TiO2 films was shifted to more than 130 nm longer wavelength in comparison with that of the already reported Au/SiO2 films.Reference Tanahashi, Manabe, Tohda, Sasaki and Nakamura6 This is because the refractive index of TiO2 is larger than that of SiO2. The redshift is explained in the literatureReference Kreibig and von Fragstein10 by using the following equation:  , where
 is the real part of the complex dielectric constant
 of the particles,
 is the imaginary part, n is the refractive index of the matrices, and ω sp is the LSPR peak frequency. In the case of the as-deposited film, the absorption band of the LSPR was weak. On the other hand, on increasing the heat treatment temperature from 600 to 800 °C, the LSPR absorbance increased and the LSPR peak position shifted to longer wavelength slightly, indicating that the Au particles became large.Reference Kreibig11 When the heat treatment temperatures of the films was 900 and 1000 °C, the absorbance of the films decreased compared with that of the films heat treated at 700 and 800 °C. As mentioned earlier, the crystal structure of the TiO2 matrix changed from anatase to rutile and the thickness of the film decreased at the heat treatment temperature above 900 °C. It seems that the crystal structure of TiO2 matrix influenced the optical absorption spectra of the films. In Fig. 7, the broad background absorption, especially in the shorter wavelength (around 500 nm) region of the peak, is due to the band-to-band transition of the Au particles.
Optical absorption spectra of the as-deposited Au/TiO2 film and the film heat-treated at 600, 700, 800, 900, and 1000 °C (shown in Fig.4) in air for 1 h.
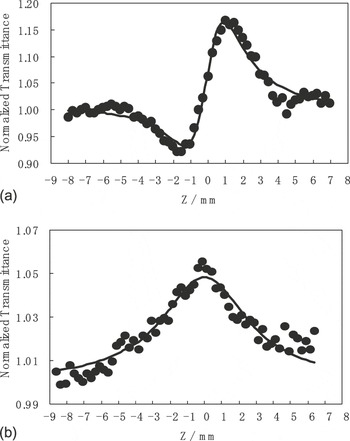
The Z-scan technique is described in detail in Refs. Reference Sheik, Said, Wei, Hagan and Van Stryland12 and Reference Cheung and Gayen13. By a theoretical fit of the experimental data for both the closed-aperture and open-aperture transmittance, the values of Re [χ(3)] and Im [χ(3)] can be obtained. In this Z-scan experimental condition, the Rayleigh range of the beam was about 1.0 mm, which is greater than the thickness of either the Au/TiO2 films or SiO2 substrate. Figures 8(a) and 8(b), respectively, show the typical close- and open-aperture Z-scan normalized transmittance of the Au/TiO2 film heat treated at 800 °C for 1 h (shown in Figs. 4 and 7). In Figs. 8(a) and 8(b), the normalized transmittance is defined as the ratio of the transmittance of the beam through the aperture in the nonlinear regime to that in the linear regime. In the film, the average diameter of the Au particles was estimated to be 16.8 nm from XRD and the peak position of the LSPR was 668 nm. In the measurement shown in Figs. 8(a) and 8(b), the wavelength of the laser beam was 584 nm, which was more than 80 nm shorter than that of LSPR peak of the film. In Fig. 8(a), the curve is characterized by a prefocal valley followed by a postfocal peak, indicating that the Re [χ(3)] of the film is positive. On the other hand, in Fig. 8(b), the enhanced transmission peak at the focus is indicative of the absorption saturation. The values of Re [χ(3)] and Im [χ(3)] were calculated to be 9.1 × 10⁻⁸ and −1.8 × 10⁻⁸ esu, respectively. Because of the absorption saturation, the sign of Im [χ(3)] was negative. These values were normalized by the absorption coefficient, α, (1.88 × 105 cm−1) of the film at the corresponding wavelength of χ(3) measurement. The values of the figure of merit (FOM), Re [χ(3)]/α and |Im [χ(3)]|/α, of the film were calculated to be 4.8 × 10⁻¹³ and 9.5 × 10⁻¹⁴ esu·cm, respectively. When the wavelength of the laser beam (660 nm) was close to that of the LSPR peak (668 nm), the values of Re [χ(3)] and Im [χ(3)] were 2.5 × 10⁻⁷ esu (FOM, 9.7 × 10⁻¹³ esu·cm) and −3.6 × 10⁻⁷ esu (FOM, 1.4 × 10⁻¹² esu·cm), respectively. The FOM of 1.4 × 10⁻¹² esu·cm for the Au/TiO2 film was one order of magnitude larger than that of 2.2 × 10⁻¹³ esu·cm for the Au/SiO2 film already reported.Reference Tanahashi, Manabe, Tohda, Sasaki and Nakamura6 This is mainly due to the local field enhancement. In this Z-scan experiment, the FOM value of Im [χ(3)] at 793 nm was calculated to be 3.2 × 10⁻¹³ esu·cm and the Re [χ(3)] could not be measured correctly because the signal due to the Re[χ(3)] was too small. The sign of Im [χ(3)] at 793 nm was also negative. In the case of Ag nanocrystal–glass composites, the dispersion curves of Re [χ(3)] and Im [χ(3)] around the LSPR was reported in the literature.Reference Hamanaka, Nakamura, Hayashi and Omi14 In accordance with the results,Reference Hamanaka, Nakamura, Hayashi and Omi14 the |Im [χ(3)]|/α of the Au/TiO2 film was resonantly increased near the LSPR peak position of the film and the sign of Im [χ(3)] was negative around the LSPR.
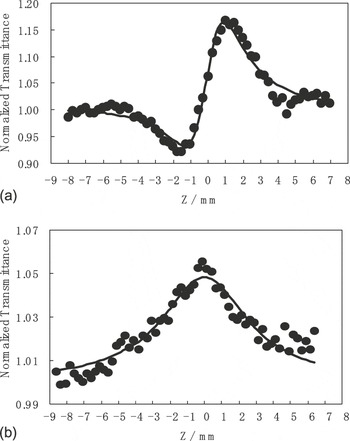
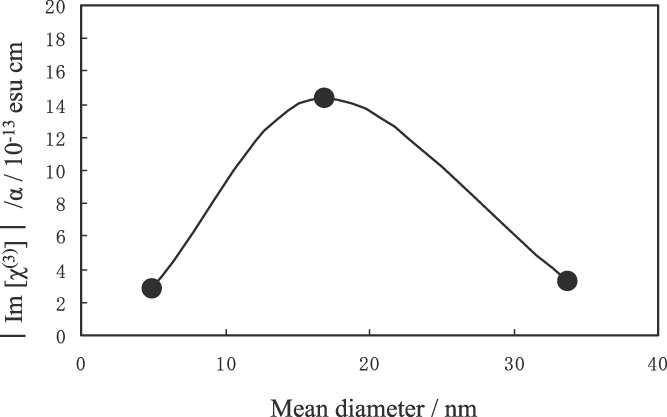
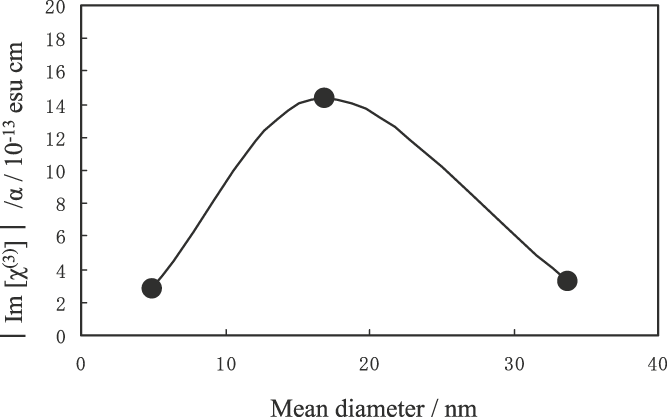
Figure 9 shows the relation between the |Im [χ(3)]|/α and the average particle diameter of Au particles in the Au/TiO2 films shown in Fig. 5. For the measurement, the laser beam (660 nm) was close to the LSPR peak positions (658–668 nm) of the films. In Fig. 9, the film with the average Au particle diameter of 16.8 nm shows larger |Im [χ(3)]|/α than the film with the average Au particle diameter of 4.9 nm. This is probably because the local field factor increases with increase in the diameter of the Au particles in the range of 3–30 nm.Reference Tanahashi, Manabe, Tohda, Sasaki and Nakamura6 However, the film with the Au particles of larger average diameter (33.7 nm) shows smaller |Im [χ(3)]|/α. This is probably because the size distribution of the Au particles with larger diameter of the film is large.
Relation between the absolute values of the Im [χ(3)]/α and the mean particle diameter of Au particles in the Au/TiO2 films shown in Fig. 5.
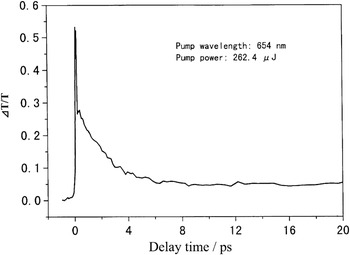
The differential transmission ΔT/T of the pump-probe delays for the Au/TiO2 film with average Au particle diameter of 33.7 nm is shown in Fig. 10. In this pump-probe experiment, the wavelength of the laser (the input power of 262.4 μJ·cm−2) was adjusted to the LSPR peak position (654 nm) of the film. In Fig. 10, the temporal behavior is decomposed into two decay components, the decay times of the fast and slow components were estimated to be 2.1 ps and more than 100 ps, respectively. The origin of the fast decay time is associated with the thermal equilibrium process between the electrons and lattice in the Au nanoparticles. On the other hand, the slow decay time comes from the cooling process by a thermal diffusion from the Au nanoparticles to the TiO2 matrix.Reference Inouye, Tanaka, Tanahashi and Hirao15
Time evolution of ΔT/T of the pump-probe delays for the Au/TiO2 film with the mean Au particle diameter of 33.7 nm.

IV. CONCLUSIONS
Au/TiO2 films with high Au particle concentrations up to 41 at% were prepared by a multitarget sputtering method. The mean diameter of Au particles in the film could be controlled in the range between 3.6 and 33.7 nm by the heat treatment in air. The Au particles grow in the film even at 600 °C, which is more than 460 °C lower than the melting point of bulk Au (1064.4 °C). The optical absorption peak due to the LSPR of Au particles was clearly observed at the wavelength of 658–668 nm. The refractive index of TiO2 is larger than that of SiO2; therefore, the LSPR peak of the Au/TiO2 films was shifted to more than 130 nm longer wavelength in comparison with that of the Au/SiO2 films. The |Im [χ(3)]| of the Au/TiO2 films exhibited a peak around the LSPR absorption peak. Owing to the absorption saturation, the value of Im [χ(3)] was negative. The FOM, |Im [χ(3)]|/α, of the film was calculated to be 1.4 × 10⁻¹² esu·cm, which was larger than that of the Au/SiO2 film. This is mainly due to the local field enhancement. The response time of the film measured from the decay of the differential transmission of the pump-probe experiment was 2.1 ps at the LSPR peak.
ACKNOWLEDGMENTS
A part of this work was performed at the central research laboratories of Matsushita Electric Ind. Co. Ltd. (Panasonic Corporation) under the management of Japan Chemical Innovation Institute as a part of the Industrial Science and Technology Frontier Program supported by the New Energy and Industrial Technology Development Organization. The authors thank Dr. Hideyuki Inouye for the pump-probe experiments of our samples.