


This paper investigates geographical drivers of policy agendas, focusing in particular on how jurisdiction size shapes them. Countries are divided into local jurisdictions with locally elected representatives who are responsible for important tasks within their jurisdictions (Gerring and Veenendaal Reference Gerring and Veenendaal2020). These jurisdictions vary in terms of population size and geographical area. For example, the least populous municipality of Denmark, Læsø, has fewer than 2,000 inhabitants, whereas more than 600,000 citizens live in Copenhagen, Denmark’s most populace municipality. In Norway, the municipality of Kautokeino covers almost 10,000 km2 above the Arctic Circle, whereas the municipality of the capital, Oslo, only covers roughly 450 km2. The question is how these structural aspects of local jurisdictions impact the local policy agendas.
We are not the first to claim that jurisdiction size matters for how a democracy works. This idea is a classic in political science (Almond and Verba Reference Almond and Verba1963; Aristotle 1948; Dahl and Tufte Reference Dahl and Tufte1973) and is supported by empirical studies (Denters et al. Reference Denters, Goldsmith, Ladner, Mouritzen and Rose2014; Finifter and Abramson Reference Finifter and Abramson1975; Hansen Reference Hansen2015; Lassen and Serritzlew Reference Lassen and Serritzlew2011; Oliver et al. Reference Oliver, Ha and Callen2012; Tavares Reference Tavares2018; Vetter Reference Vetter2002). The main takeaway from this debate is that jurisdiction size is a central feature of a political system, with important implications for how the system works. As argued by Newton (Reference Newton1982, p. 200), “large authorities are not just bigger versions of small ones. They develop their own distinctive characteristics, which create qualitative variations between units of different sizes.”
The question we focus on in this paper is how jurisdiction size matters for the policy agenda, defined as the list of issues to which political decision-makers devote their attention. A central insight from the relatively large literature on policy agendas is that the list of potential issues that could be part of a policy agenda always exceeds the list of issues actually attended to and addressed by elected representatives (Baumgartner and Jones Reference Baumgartner and Jones1993; Cobb and Elder Reference Cobb and Elder1972; Green-Pedersen and Walgrave Reference Green-Pedersen and Walgrave2014; Kingdon Reference Kingdon1984). This limitation directs attention to the factors that influence the issue content of policy agendas, and many agenda-setting studies have addressed this question, although mainly at the level of national politics and often within one or a few political systems (see, e.g., Boda and Sebők Reference Boda and Sebők2021; Bonafont et al. Reference Bonafont, Baumgartner and Palau2015; Bulut and Yildirim Reference Bulut and Yildirim2020; John et al. Reference John, Bertelli, Jennings and Bevan2013). These studies have taught us much about the interplay between changes in politics, economics, societal problems, media agendas, and policy agendas, but they have revealed little about the importance of slow-moving factors such as institutional structures. Such factors, which may differ across political systems but rarely change over time, are difficult to study at the national level of politics, and this is why we turn to the local level of politics in this paper. Certainly, there are differences between local and national politics, but as reflected in the increased scholarly interest in local policy agendas (see Eissler et al. Reference Eissler, Mortensen and Russell2025), the fundamental argument regarding the importance of policy agendas also applies to the local level of government.
The local level of government makes it possible to address the question of how jurisdiction size shapes the policy agenda. Furthermore, the large number of comparable local-level political units invites a large-N and multivariate testing strategy that would be difficult to apply at the national level of politics (John Reference John2006). In addition, the local level of government offers the possibility to study not only how the content of the policy agenda varies across political systems, but also the more fundamental question of why the size of policy agendas varies across political systems (Mortensen and Seeberg Reference Mortensen and Seeberg2016).
Empirically, we use data on local council agendas from Denmark and Norway. The research design is well-suited to trace policy agenda effects of both geographical aspects of jurisdiction size: population and area. Focusing on local council agenda data from Denmark and Norway, we have collected and content-coded council agendas from all 98 Danish municipalities from 2007 to 2016 and from 428 Norwegian municipalities from 2009 to 2018. The data on local policy agendas have been collected according to the same coding schemes, and the countries share a history and political culture, as well as comparable local government structures in terms of both tasks and governance.
A recent study of Danish local governments provided empirical support for the idea that population size affects the local policy agenda (Mortensen et al. Reference Mortensen, Loftis and Seeberg2022). We advance this research in two ways. First, we expand the understanding of jurisdiction size to not only be a matter of population but also of geographical size. Second, we include the comparative case of Norway, which offers crucial variation in geographical size across municipalities.
Jurisdiction size and the policy agenda
The question of the relationship between jurisdiction size and democracy has been debated since Aristotle. Conventional wisdom is that, on the one hand, larger size makes it harder for individual citizens to participate and exert influence (Verba and Nie Reference Verba and Nie1972). In larger jurisdictions, politics tends to be more complex, which makes participation more difficult and reduces internal political efficacy. On the other hand, larger jurisdictions allow for more capable political systems that can address more and larger problems with solutions requiring greater resources and capacity (Dahl and Tufte Reference Dahl and Tufte1973; Treisman Reference Treisman2007).
Several empirical studies show that jurisdiction size, measured as population, is associated with different aspects of democracy. A larger jurisdiction is associated with lower internal political efficacy (Lassen and Serritzlew Reference Lassen and Serritzlew2011), a tendency toward lower turnout (Bhatti and Hansen Reference Bhatti and Hansen2019), and greater complexity, less cohesion, and less participation (Gerring and Veenendaal Reference Gerring and Veenendaal2020). In very large jurisdictions, it is close to a mathematical certainty that an individual vote will not matter (Downs Reference Downs1957), and it requires substantial skills and resources to affect policy. At the same time, larger jurisdictions may tackle more tasks and problems. Very small jurisdictions may allow for high participation and greater individual influence on politics, but the range of issues is likely quite limited (Oliver et al. Reference Oliver, Ha and Callen2012). For example, the median population of the more than 35,000 French communes is below 500 citizens, and it would stand to reason that it should be relatively easy for each citizen to make their voice heard, but – alas – this would only appear to be the case on very mundane issues, such as construction and maintenance of minor roads and refuse disposal (Hunt and Chandler Reference Hunt and Chandler1993, p. 56).
At first glance, one might expect local policy agendas to be largely similar regardless of jurisdiction size. In unitary states with a high degree of decentralized governance (e.g., the UK and the Nordic countries), most local government tasks and responsibilities are mandated by law (Loughlin et al. Reference Loughlin, Hendriks and Lidström2011). Consequently, all local governments must provide essentially the same basket of services to their citizens. Thus, at least in principle, the “system capacity” of local governments is largely uniform across jurisdictions, irrespective of size. This logic may also extend to the effect of jurisdictional size on policy agendas: since primary education, for example, is mandatory for all local governments, school-related issues will regularly or occasionally require political attention (e.g., through strategic decisions or in response to politically salient events) regardless of jurisdiction size.
However, there are strong reasons to expect that jurisdiction size matters for local policy agendas. A larger population implies a need for more local government institutions (e.g., schools, childcare centers, eldercare facilities), which in turn generates more cases requiring political attention; for example, more schools to renovate, build, or close. It has also been argued that larger local units have more capacity to provide more specialized services (Newton Reference Newton1982; Oliver et al. Reference Oliver, Ha and Callen2012). Furthermore, the policy agendas of local governments do not consist solely of issues generated by mandatory services. An important role for elected politicians is to identify emerging problems and introduce them onto the policy agenda, for instance by monitoring indicators, reacting to focusing events, or receiving systemic feedback (Kingdon Reference Kingdon1984; Kristensen et al. Reference Kristensen, Green-Pedersen, Mortensen and Seeberg2023).
In combination, this leads to the expectation of larger policy agendas in larger jurisdictions than in smaller jurisdictions. Furthermore, this applies regardless of whether jurisdiction size is measured in terms of population or area. Spatially extensive jurisdictions also require, simply due to distance, more (typically smaller) local government institutions. The sheer geographical size of a local jurisdiction may in itself generate demands for “more politics,” and this will be reflected in an expanded policy agenda. Thus, whereas jurisdiction size in the literature has typically been understood as population size alone, the geographical division into local jurisdictions affects both population size and area, and we contend that both may shape local policy agendas. On some dimensions, as argued below, we expect the two structural factors to produce similar but independent effects on the agenda; on other dimensions, we expect different effects. When it comes to the sheer size of local policy agendas, we expect similar effects, as summarized in Hypothesis 1:
Hypothesis 1: Larger jurisdictions tend to have larger policy agendas.
Jurisdiction size is also likely to affect the diversity of the policy agenda. Again, this applies both to population size and area. Larger populations have the potential to include more distinct groups with different demands on the political system. In this sense, jurisdictions with larger population tend to be more internally heterogeneous (Gerring and Veenendaal Reference Gerring and Veenendaal2020). This may again result in a more crowded policy agenda, where many different issues are addressed by local councils. Furthermore, in larger jurisdictions, a larger pool of political candidates compete for relatively fewer seats, making competition for office very intense and elected politicians more focused on re-election and agenda control (Oliver et al. Reference Oliver, Ha and Callen2012). This may contribute to a more complex and crowded local policy agenda (see Mortensen et al. Reference Mortensen, Loftis and Seeberg2022, p. 46). Furthermore, spatially large jurisdictions may also be more heterogeneous due to differences between urban and rural areas, varying land use patterns, economic activities, environmental conditions, or cultural identities within the jurisdiction (Newton Reference Newton1982). This leads to the expectation that population size and area size are associated with greater diversity in local policy agendas, as summarized in the following hypothesis:
Hypothesis 2: Larger jurisdictions tend to have more diversified policy agendas.
Jurisdiction size may also affect the salience of specific policy issues on the agenda. Citizens in large municipalities may have different needs and demands than citizens in smaller municipalities (Oliver et al. Reference Oliver, Ha and Callen2012). This may show up as relatively more attention to issues of housing and planning, transportation, education, and culture in municipalities with larger populations. Large-area municipalities are often more rural, whereas small-area municipalities tend to be more densely populated and thus have a higher share of urban areas. Distinctive features of cities render their politics substantively different from those in rural municipalities – as evidenced by, for example, urban regeneration programs targeting disadvantaged inner-city districts and zoning policies (Heinelt et al. Reference Heinelt, Sweeting and Getimis2006; Judge et al. Reference Judge, Stoker and Wolman1995). Furthermore, we may see divergent agenda effects of population and area size. In large-area jurisdictions, issues of public land use, environment, energy, and agriculture may take up relatively more agenda space than they do in small, densely populated municipalities. On the other hand, social welfare issues and issues of crime may play a smaller role in large-area municipalities. The local policy agendas also offer a new way of identifying economies-of-scale effects, which has been a prominent issue in the literature on jurisdiction size effects (e.g., Blom-Hansen et al. Reference Blom-Hansen, Houlberg and Serritzlew2014). If there are economies of scale in the economic costs of running a political system, then local councils may spend relatively less time on economic and administrative issues compared to smaller municipalities.
The main implication of this discussion is that the saliency of issues is likely to vary with the size of the municipality. It is less clear exactly how issue saliency is affected by population and area size. However, we take a cautious step further and summarize our expectations in the following two directional hypotheses:
Hypothesis 3: Issues of housing, transportation, education, and culture will generally take up more space on the policy agenda in more populous jurisdictions, whereas issues of economics and government operations will take up less space.
Hypothesis 4: In large-area jurisdictions, issues of public land, environment, energy, and agriculture will take up more space on the local policy agenda, whereas issues of crime and social welfare will take up less space on the local policy agenda.
The next section describes how we examine the hypotheses empirically.
Data and research design
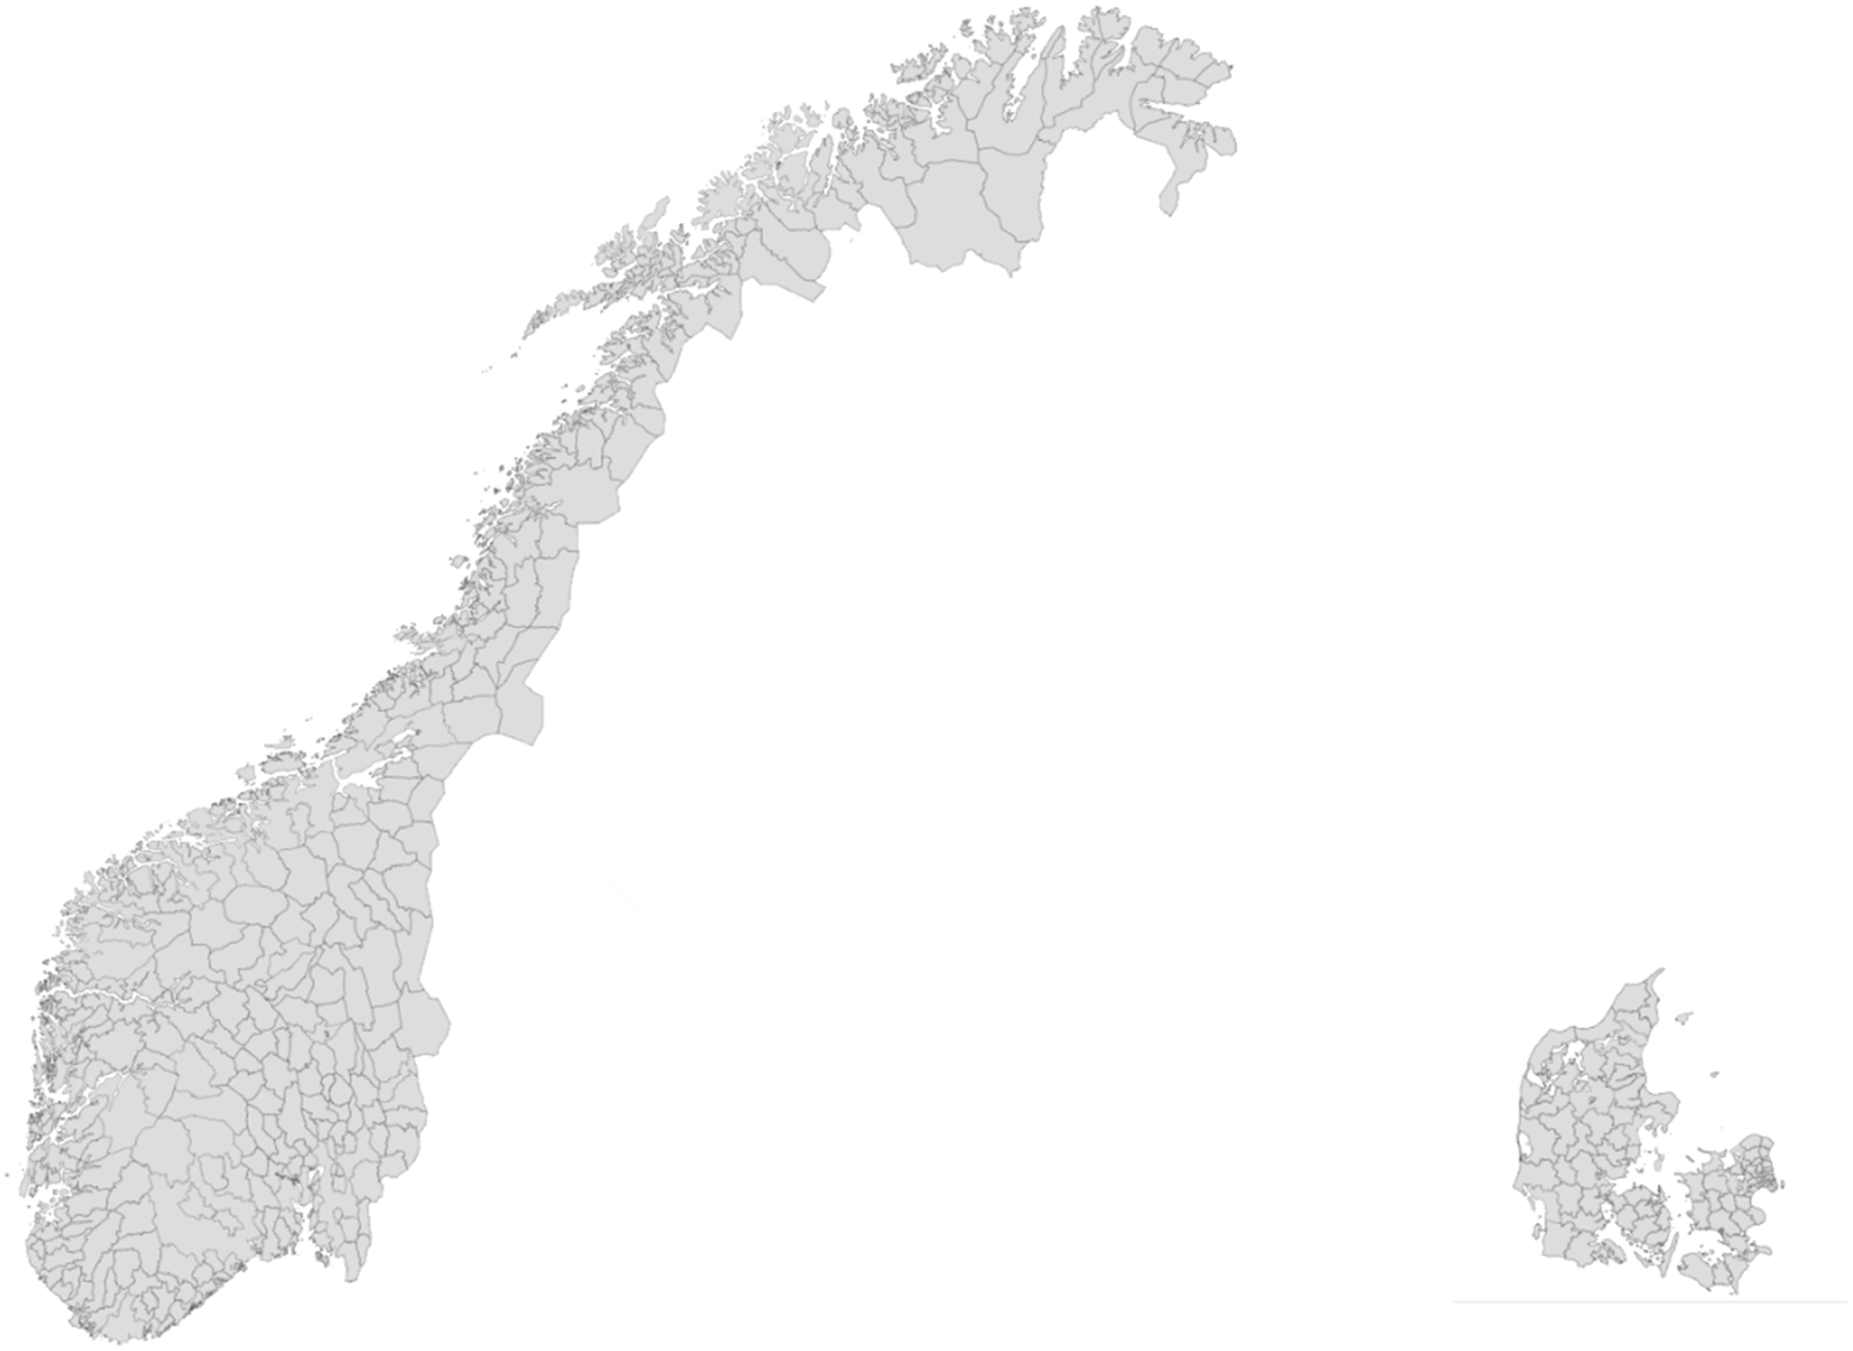
We examine the four hypotheses using large-N datasets from Denmark and Norway, two Nordic countries characterized by comprehensive, universal welfare states and similar political systems. The two countries are comparable in population size, with Denmark having approximately 6 million inhabitants and Norway around 5.5 million. They also have very comparable local government systems. However, the two countries differ substantially in geography. Figure 1 shows maps of municipalities in Norway (left) and Denmark (right). Norway covers about nine times the area that Denmark does, which is reflected in the larger geographical size of Norwegian municipalities. Furthermore, Denmark has far fewer municipalities than Norway (98 vs. 428), which is reflected in the larger population size of Danish municipalities.
Municipalities in Denmark and Norway.
Note: Same-scale maps of the 428 Norwegian municipalities (left) and 98 Danish municipalities (right). Maps produced by the authors in Microsoft Excel using Bing/Statistics Denmark/Statistics Norway, 2026.

Analyzing local policy agendas from these two countries allows us to address the main challenge of identifying cases with sufficient variation in jurisdiction size. By focusing on local government in Denmark and Norway, we obtain substantial variation in size in terms of both population and area. In both countries, detailed data on local policy agendas has been collected using identical coding schemes. Thus, they constitute highly comparable cases for a study of how jurisdiction structure affects the policy agenda. Before turning to the dependent variable, local policy agendas, we briefly introduce local government in Denmark and Norway.
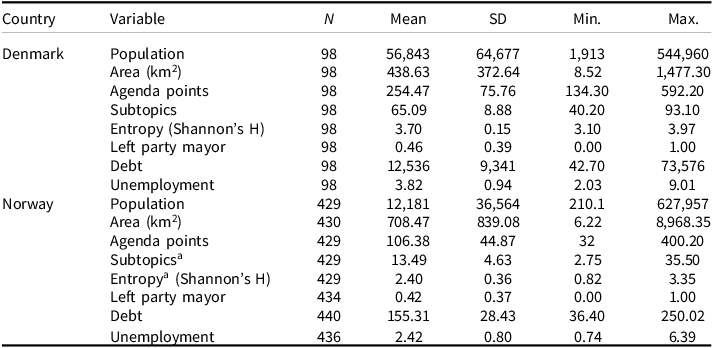
Denmark has three tiers of government. At the local level, it is divided into 98 municipalities, with populations ranging from about 2,000 to 600,000 (see Table 2). Most municipalities have between 20,000 and 100,000 citizens, and the average population size during the sample period is 56,834. Every four years, municipal councils are elected. The councils organize their work through standing committees, which are responsible for day-to-day administration (Baekgaard Reference Baekgaard2011). The mayor serves as the council chair and is elected by the council for the entire four-year electoral period. The mayor is also the formal head of the municipal administration. The municipalities are responsible for a broad range of welfare services, including elementary schools, childcare, eldercare, and local infrastructure. Local governments in Denmark account for about half of total public expenditure (see Pedersen et al. Reference Pedersen, Mortensen and Skytte2025). This spending is financed primarily through local taxes, which are formally set by the municipalities but subject to tight state regulation, together with block grants from the state.
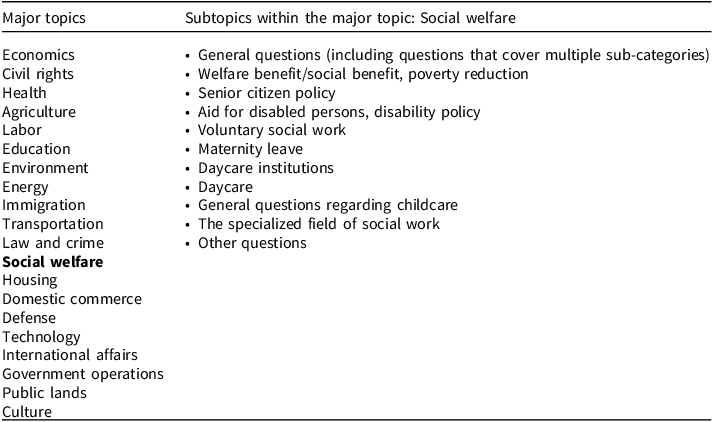
Overview of major topics

Table 1. Long description
A table with two columns and sixteen rows. The first column lists major topics, and the second column lists subtopics within the major topic of social welfare. Major topics include Economics, Civil rights, Health, Agriculture, Labor, Education, Environment, Energy, Immigration, Transportation, Law and crime, Social welfare, Housing, Domestic commerce, Defense, Technology, International affairs, Government operations, Public lands, and Culture. Subtopics within social welfare include General questions, Welfare benefit/social benefit, poverty reduction, Senior citizen policy, Aid for disabled persons, disability policy, Voluntary social work, Maternity leave, Daycare institutions, Daycare, General questions regarding childcare, The specialized field of social work, and Other questions.
Summary statistics, Danish and Norwegian municipalities over sample period
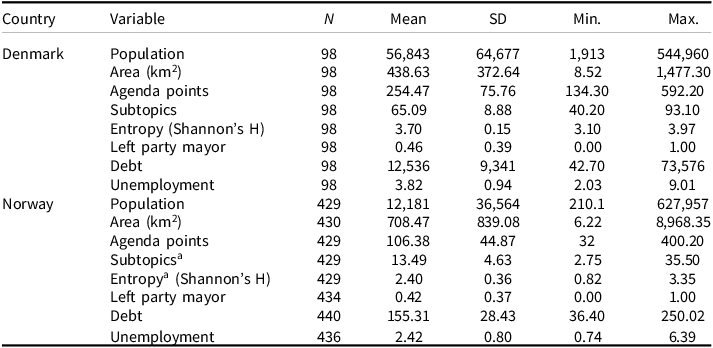
Table 2. Long description
A table comparing various variables between Danish and Norwegian municipalities. The table has 12 rows and 8 columns. The columns are labeled Country, Variable, N, Mean, SD, Min., and Max. The row labels include Population, Area (km^2), Agenda points, Subtopics, Entropy (Shannon’s H), Left party mayor, Debt, and Unemployment. For Denmark, the variables are measured across 98 municipalities with values such as a mean population of 56,843 and a mean area of 438.63 km^2. For Norway, the variables are measured across 429 to 436 municipalities with values such as a mean population of 12,181 and a mean area of 708.47 km^2. The table provides detailed statistics including mean, standard deviation, minimum, and maximum values for each variable.
a These two numbers are calculated based on the random sample of 67,500 agenda items sampled across all the Norwegian municipalities. This means that the numbers are not directly comparable with the corresponding numbers from the Danish municipalities, but the measures are comparable across Norwegian municipalities (see main text for further explanation). SD = standard deviation.
Norway also has three tiers of government. In 2016, just prior to a structural reform implemented after our data series ends, the number of local governments was 428. The mean population size during the sample period was 12,181 (see Table 2). Norwegian municipal councils are elected every four years. Except for the two largest cities by population, municipalities are organized according to the alderman principle, with a political executive consisting of councilors from across the political spectrum (Saglie and Segaard Reference Saglie and Segaard2022). The mayor is elected by the council and holds few formal powers beyond chairing meetings of the council and the executive. The municipal administration is headed by a chief officer who is hired by, and accountable to, the council (Jacobsen Reference Jacobsen2020).
Although local governments in both Denmark and Norway have some leeway to take on tasks on their own initiative, the bulk of their responsibilities consists of legally mandated welfare services, including childcare and primary education, primary health care, care services, and social services, as well as spatial planning and technical services. Local taxes and government grants in roughly equal proportions comprise the bulk of local government revenues (Fiva et al. Reference Fiva, Hagen and Sørensen2021).
There is no strong institutionalized regulation governing the preparation of council meeting agendas. Based on informal conversations with local government actors in both Norway and Denmark, our impression is that council meeting agendas are usually prepared by the mayor and the city manager, taking input from committee chairs and council members (see also Mortensen et al. Reference Mortensen, Loftis and Seeberg2022, p. 22).
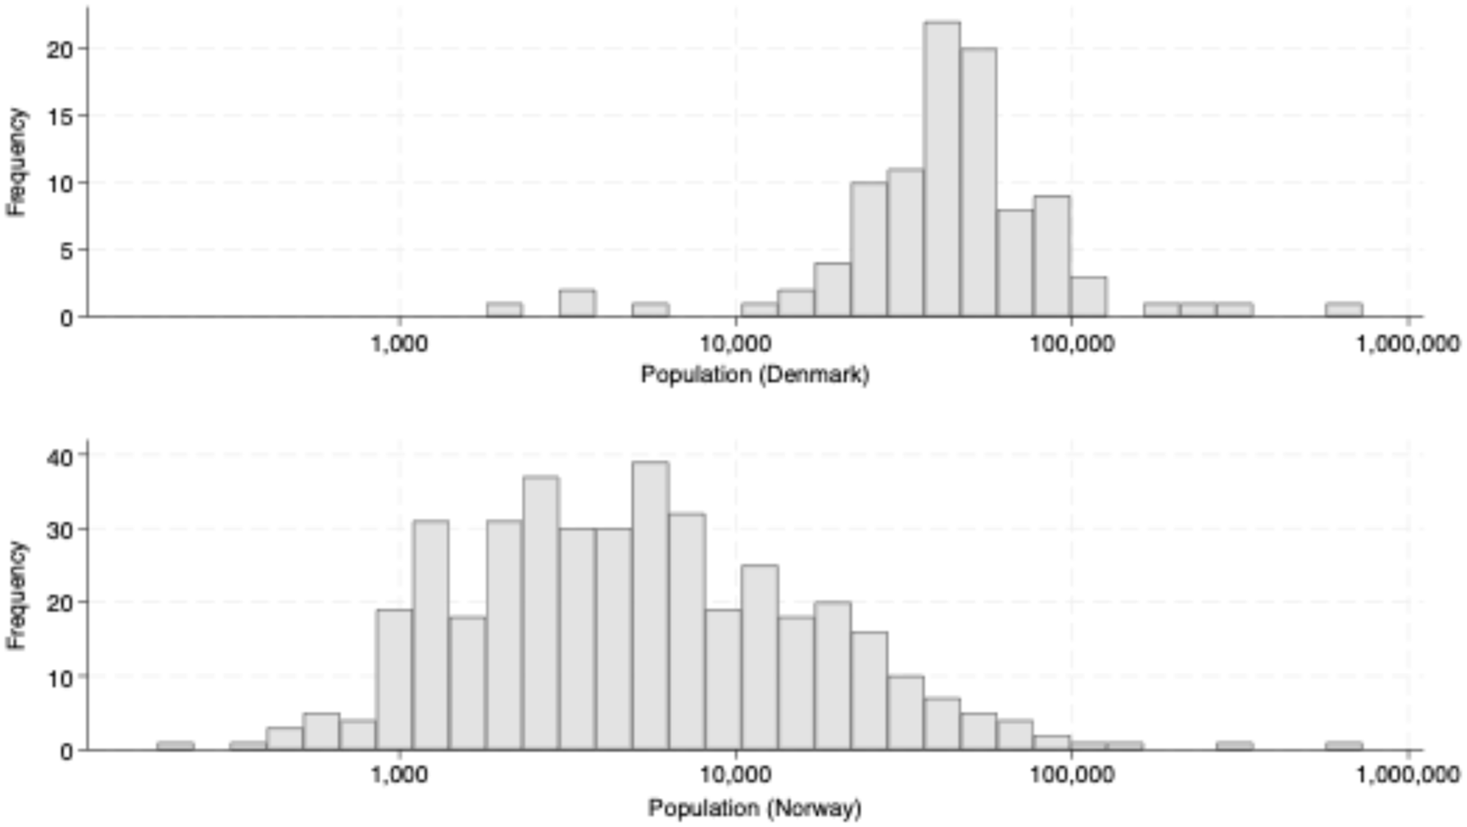
Figure 2 shows the distribution of municipal population size (logged) in Denmark and Norway. Despite the reform in 2016, the typical Norwegian municipality remains considerably smaller than the typical Danish municipality in terms of population size. Norwegian municipalities range from 200 to 673,469 inhabitants, and the smallest half of the municipalities have populations below 5,100 inhabitants.Footnote 1
Population of Danish and Norwegian municipalities (logged).
Note: Population size (log scale), measured using 2016 data for both countries.
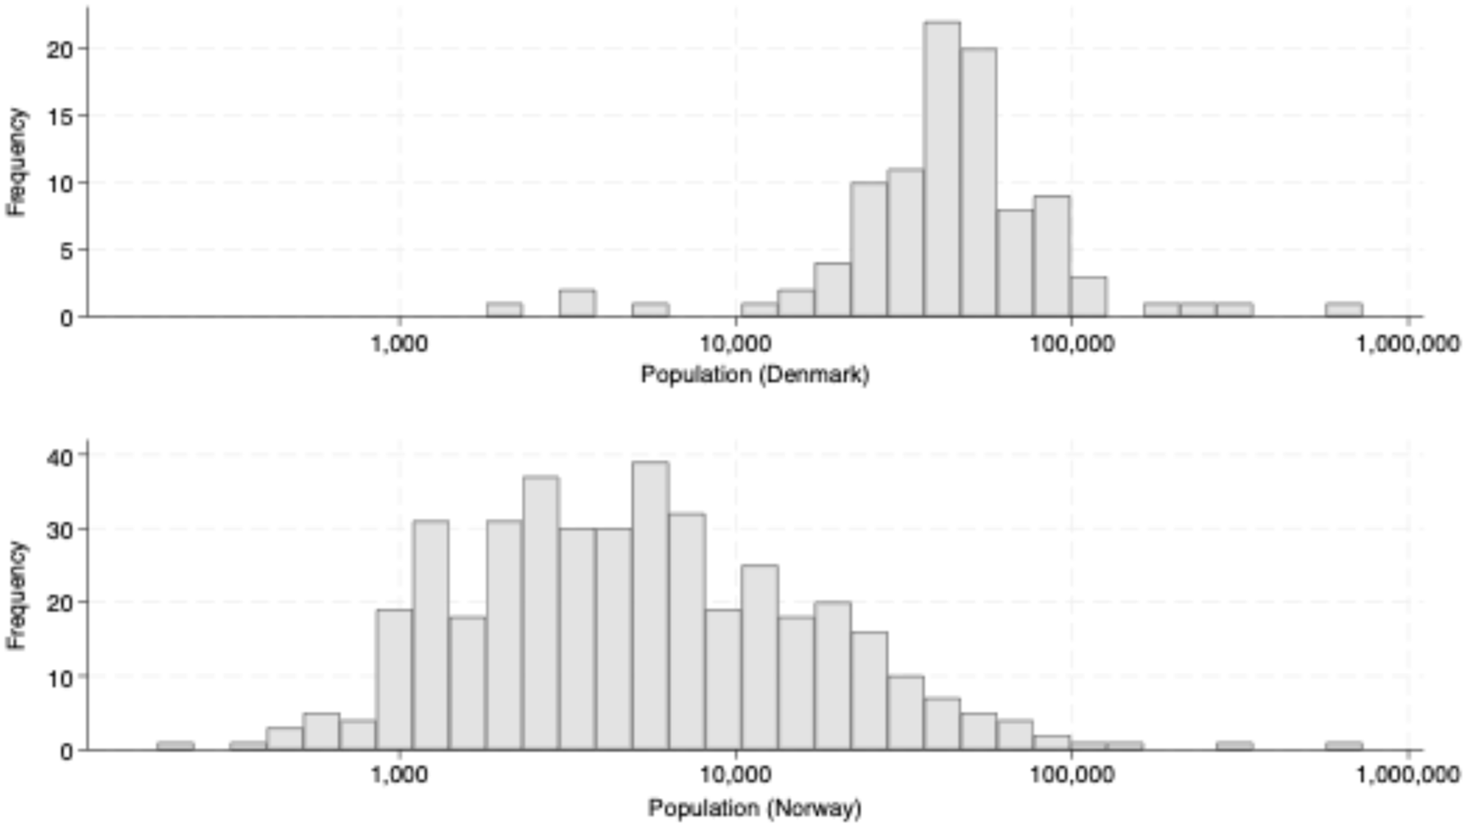
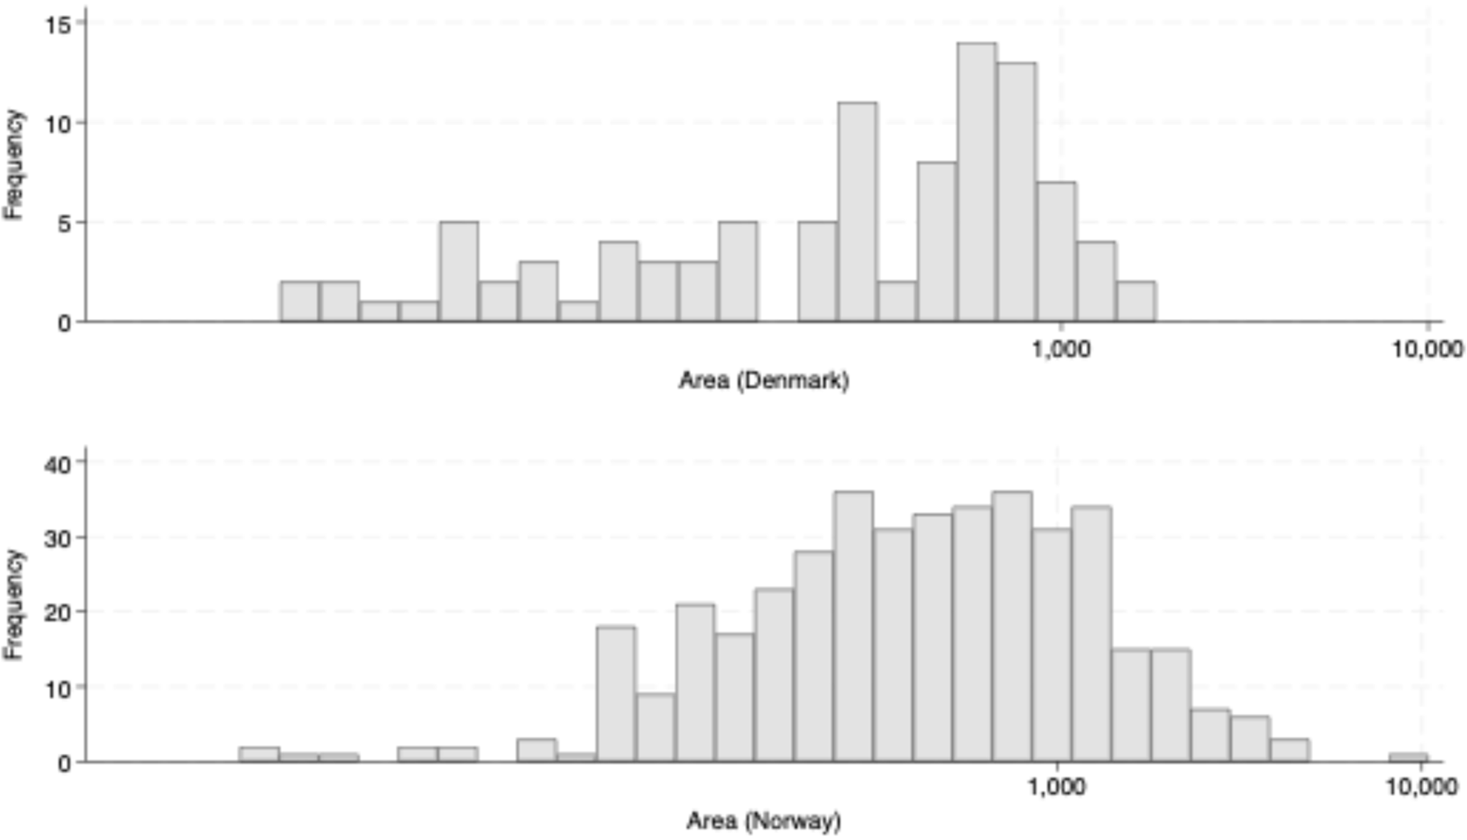
Figure 3 shows the distribution of municipal area in Denmark and Norway. Norwegian municipalities are much larger on average (just over 700 km2 compared to Denmark’s 439 km2), and Norway also displays greater variation in municipal area, with a maximum of 8,969 km2 (the Arctic municipality mentioned in the introduction). Moreover, 29 Norwegian municipalities are larger than the largest municipality in Denmark (1,489 km2).
Area of Danish and Norwegian municipalities (logged).
Note: Area size in km2 (log scale), measured using 2016 data for both countries.

Acquiring and coding local policy agendas
We measure policy agendas using the standard issue-coding scheme from the Comparative Agendas Project (CAP) in both Denmark and Norway. Each agenda item is categorized according to 20 major topics and approximately 200 subtopics. Table 1 provides an overview of the major topics and examples of the subtopics within one of the major categories (social welfare).
In Denmark, local council agendas were collected for every council meeting during the period 2007–2016, and in Norway from 2009 to 2018. For both countries, most council meeting agendas were retrieved online, and when information was not available online, data was collected by contacting municipalities directly to request the missing material. For the Danish data, the coding was conducted using a combination of supervised machine learning and trained student coders with systematic accuracy checks. A final review by the student coders verified that the computer-generated predictions achieved an accuracy rate of over 80 percent at the subtopic level (see Mortensen et al. Reference Mortensen, Loftis and Seeberg2022, p. 30). The coding procedure for the Danish data is described in detail in Mortensen et al. (Reference Mortensen, Loftis and Seeberg2022, chapter 2) and in Loftis and Mortensen (Reference Loftis and Mortensen2020).
The full Norwegian dataset contains 405,246 agenda items drawn from the agendas of all local councils during the period 2009–2018. The data was collected by a team of student assistants coordinated and supervised by the project PIs. The original intention was to use hand-coded agenda items in a supervised machine-learning procedure similar to that used for the Danish data. However, for the Norwegian council meeting agendas, the computer-generated coding of subtopics never reached a satisfactory level of accuracy. As a result of the extensive coding and correction efforts, the Norwegian dataset currently contains 67,500 randomly sampled, hand-coded agenda items with intercoder agreement around 80 percent at the subtopic level. As the next section explains, subtopic coding is relevant only for two of our four agenda measures (diversity and complexity), meaning that we can use the full Norwegian dataset for analyses focusing on the sheer number of agenda items as well as analyses of how the agenda shares of major topics vary with jurisdiction size.
Measuring dimensions of local policy agendas
To examine the four hypotheses, we construct measures of the size, diversity, and issue content of local policy agendas. We measure agenda size as the number of agenda items addressed by a municipal council during a given year. This measure simply indicates whether some councils process more items in their council meetings over the course of a year and allows us to assess whether this is systematically related to jurisdiction size.
This simple count measure, however, does not tell us whether councils with greater overall attention capacity process a larger number of issues or instead examine a smaller number of issues in greater depth by debating many items related to the same issue. Thus, to examine Hypothesis 2 we supplement the item count with two measures of agenda diversity. One is constructed as the number of subtopics addressed by a municipal council during each year. Our “subtopics” measure is, thus, the total number of subtopics appearing at least once on the council agenda in a given municipality during a given year.
However, this agenda diversity measure does not inform us about how attention is distributed across issues, and therefore we supplement with a measure of agenda complexity. We use an entropy measure, Shannon’s H, as an indicator of agenda complexity (Boydstun et al. Reference Boydstun, Bevan and Thomas2014). High values indicate that attention is distributed relatively evenly across subtopics, whereas low values indicate the concentration of attention on a smaller number of subtopics. Some agendas may cover many issues while concentrating attention on only a few, whereas other councils may allocate attention relatively evenly across issues.
Finally, to examine Hypotheses 3 and 4, we use the coding of major topics. More specifically, we calculate attention to each major issue (see Table 1) as the share of the total agenda items.
Estimation strategy
In observational studies, reverse causality and spurious correlations are often major concerns. We argue that these issues do not pose a fundamental threat when studying the effects of population and area size on local policy agendas. First, it is highly unlikely that the size and content of local policy agendas affect municipal jurisdiction size. In both countries, these institutional boundaries are determined at the central-government level, and there were no major amalgamation reforms during the period under investigation. Some local councils may lobby for amalgamation with a neighboring municipality, for example, which might be reflected in a few items on a local council agenda, but it would not be visible in the large numbers of agenda items analyzed in this study. Furthermore, local councils may attempt to attract new residents, and such strategies may also be reflected in local policy agendas, but year-to-year changes in local population size are marginal. Thus, reverse causality is not a major concern when studying the effects of population and area size on the size, diversity, and issue content of local policy agendas.
Nevertheless, throughout the analysis we control for indicators of municipal-level political and economic characteristics. While there is no strong reason to suspect such characteristics to consistently affect local policy agendas (Blom-Hansen et al. Reference Blom-Hansen, Monkerud and Sørensen2006; Mortensen et al. Reference Mortensen, Loftis and Seeberg2022), they have been included in previous studies of local policy agendas (for an overview, see Eissler et al. Reference Eissler, Mortensen and Russell2025). Our indicator of local party politics measures whether the mayor belongs to a left-wing party. In Denmark, the left-wing parties are the Social Democrats, the Socialist People’s Party, the Social Liberals, and the Red-Green Alliance. The indicator variable takes the value 1 if the mayor belongs to one of these parties and 0 otherwise (source: Kjær and Opstrup Reference Kjær and Opstrup2018). In Norway, the mayoral-partisanship dummy variable takes the value 1 if the mayor represents the Labour Party, the Socialist Left Party, or the Red Party, or a local/other list classified as left-wing, and 0 otherwise (source: Fiva et al., Reference Fiva, Halse and Natvik2023). As indicators of local economic conditions, we include two measures: municipal debt and the local unemployment level. In Denmark, these measures are obtained from the central database www.noegletal.dk. In Norway, the two economic indicators are retrieved from www.ssb.no.
Given the fundamental character of jurisdiction size, the control variables may function as intermediate variables that risk suppressing the effects of population and area size. For example, if left-wing mayors are more common in larger municipalities, this may contribute to explaining why policy agendas differ between larger and smaller municipalities, but it may also blur estimation of the direct effect of jurisdiction size. To address this concern, we use stepwise regression in which different sets of variables are introduced sequentially.
Because our measure of population size varies very little over time and our measure of geographic size does not vary at all, we collapse all measures to their means over the observation period. This also avoids inflating statistical significance by artificially increasing the sample size. Accordingly, our main analyses apply cross-sectional models using the average number of agenda items, subtopics, and entropy values for each municipality, along with the control variables, across the entire period. In the appendix, we show that the main results can largely be reproduced while retaining the panel-data structure (municipality–year) of the data (Tables A1–A8). The appendix also contains a set of diagnostic tests (Tables A9 and A10). These do not raise concerns beyond those addressed in the estimation of the main models reported below. Finally, differences in the sample sizes and the fact that the local government systems in Denmark and Norway are comparable without being identical lead us to conduct separate regression analyses for the two countries. Table 2 presents summary statistics for the variables used in the analysis.
Empirical findings
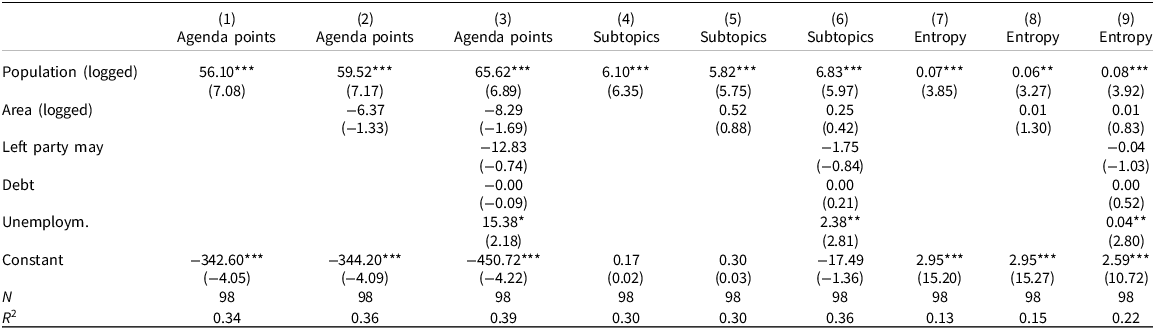
Table 3 shows the relationship between jurisdiction size (in terms of population and area) and the local policy agenda (in terms of agenda items, subtopics, and entropy) for Denmark, and Table 4 presents the corresponding results for Norway. Both tables report results from three models for each dependent variable. For example, column (1) of Table 3 (“Agenda items”) shows the effect of population size on the number of agenda items in a bivariate model. In Denmark, the effect is positive and statistically significant. In column (2), we add area as an independent variable, but area has no statistically significant effect on agenda size. Adding the political and economic control variables in column (3) does not affect the coefficients of primary interest, namely those for population and area size. The same stepwise introduction of variables is followed in columns (4–6) and (7–9) of Table 3. The results reported in Table 3 are highly consistent across the three dependent variables and across model specifications. Population size has a positive and clearly statistically significant effect on agenda size, diversity, and entropy, whereas area shows no statistically significant effect on any of these three dimensions of local policy agendas.
Local policy agendas in Denmark
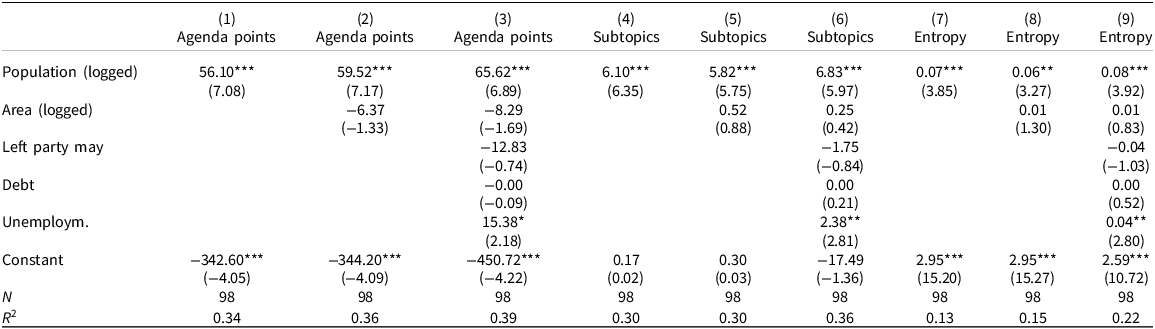
Table 3. Long description
A table with 9 columns and 6 rows, including a header row. The columns are labeled as follows: (1) Agenda points, (2) Agenda points, (3) Agenda points, (4) Subtopics, (5) Subtopics, (6) Subtopics, (7) Entropy, (8) Entropy, (9) Entropy. The rows are labeled as follows: Population (logged), Area (logged), Left party may, Debt, Unemploym., Constant. Row 1: Population (logged), 56.10***, 59.52***, 65.62***, 6.10***, 5.82***, 6.83***, 0.07***, 0.06**, 0.08***. Row 2: Area (logged), -6.37, -8.29, -1.69, 0.52, 0.25, -1.75, 0.01, 0.01, -0.04. Row 3: Left party may, -12.83, -0.74, -0.84. Row 4: Debt, -0.00, 0.00, 0.00. Row 5: Unemploym., 15.38*, 2.38*, 2.81. Row 6: Constant, -342.60***, -344.20***, -450.72***, 0.17, 0.30, -17.49, 2.95***, 2.95***, 2.59***. The table also includes values for N and R^2 at the bottom.
Note: t statistics in parentheses; *p < 0.05, **p < 0.01, ***p < 0.001.
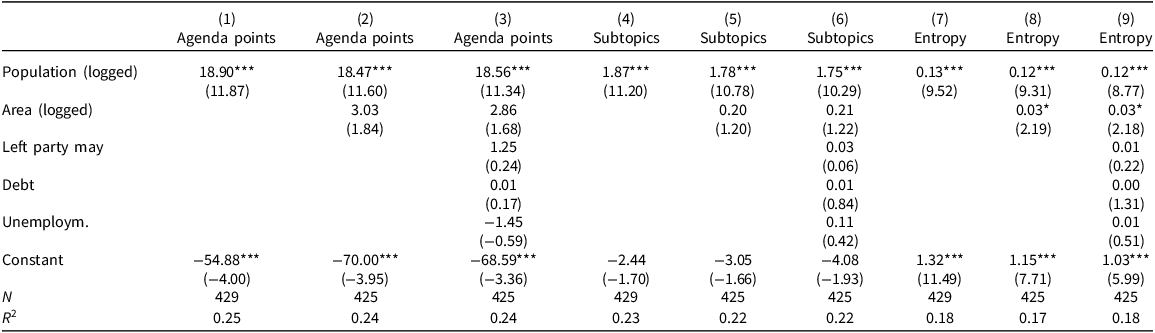
Local policy agendas in Norway
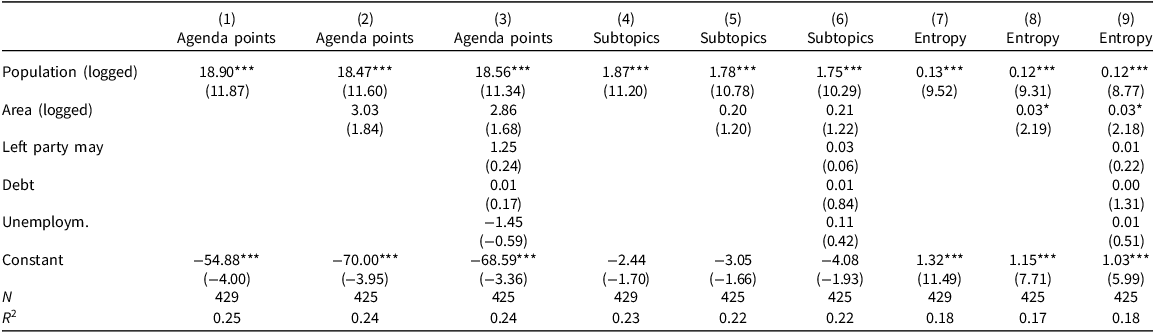
Table 4. Long description
The table presents data on the relationship between jurisdiction size (population and area) and local policy agenda (agenda points, subtopics, and entropy) in Norway. It includes nine columns and several rows with specific values. Column headers are labeled as (1) Agenda points, (2) Agenda points, (3) Agenda points, (4) Subtopics, (5) Subtopics, (6) Subtopics, (7) Entropy, (8) Entropy, and (9) Entropy. Row labels include Population (logged), Area (logged), Left party may, Debt, Unemploym., and Constant. Each cell contains numerical values and statistical significance indicators. The table shows how different factors influence the local policy agenda, with population size having a significant effect while area does not.
Note: t statistics in parentheses; *p < 0.05, **p < 0.01, ***p < 0.001.
Table 4 presents the corresponding results for Norway. As in Denmark, population size is consistently associated with larger and more diverse local policy agendas, as well as greater complexity, measured by entropy. In addition, for the measure of agenda complexity (entropy), area size appears to have a weak statistically significant effect, although no systematic effect of area can be identified for the other dimensions of local policy agendas. This indicates that spatially larger municipalities in Norway tend to have more diverse agendas, with a larger number of subtopics and attention distributed more evenly across subtopics (higher entropy).
Taken together, the results in Tables 3 and 4 indicate that jurisdiction size, when operationalized in terms of population size, is important for the size, diversity, and complexity of local policy agendas in ways consistent with Hypotheses 1 and 2. Population size has a clear and similar effect across the two countries: in larger municipalities, policy agendas are longer and more complex. By contrast, jurisdiction size understood in geographic terms does not have a strong effect on the size, diversity, or complexity of local policy agendas. For the geographically small Danish municipalities, we find no systematic effects of area size, and in Norway, with its geographically extensive municipalities, we find only a weak effect on the measure of agenda complexity.
These conclusions also hold when estimating the effects using panel-data models with municipality-year observations (see Tables A1–A8 in the appendix). In the first set of tests, we estimate random-effects models with standard errors clustered at the municipal level (Tables A1–A2). Given the time-invariant character of our jurisdiction size variables, we estimate random (“between”) effects models instead of municipality fixed (“within”) effects models. However, we estimate panel models with dummies for years in Tables A3–A4. Furthermore, in Tables A5–A6, we show the results for random-effects models with standard errors clustered at the municipal level with a lagged dependent variable. Across all these models, with some nuances explained in the appendix, population size has a clear positive and statistically significant effect on agenda size, diversity, and complexity. For Denmark, the effect of geographic size remains statistically insignificant except for one model specification, where it turns statistically significant for the number of agenda items. In Norway, the effect of area on agenda diversity and complexity is statistically insignificant, whereas the area coefficient for agenda size sometimes becomes positive. Thus, while we cannot rule out the possibility that area affects the structure of local policy agendas, the effect appears weak or non-systematic.
In addition, we reran the main analyses replacing our entropy measure (Shannon’s H) with an alternative concentration measure, the Herfindahl–Hirschman Index (HHI). Unlike Shannon’s H, the HHI measures concentration, meaning that a high HHI indicates a policy agenda focused on a small number of issues. Consequently, Hypothesis 2 implies that jurisdiction size should have a negative effect on the HHI of local policy agendas. As shown in Tables A7 and A8 in the appendix, replacing Shannon’s H with the HHI measure of agenda concentration does not alter the conclusions. We also examined the functional form of the relationship (Tables A11 and A12). This examination suggests that the findings in Tables 3 and 4 are not driven by the log-linear functional form.
Finally, we explored whether area and population size might have multiplicative effects on the agenda measures, in the sense that their combined effect exceeds the sum of their individual effects. We examined this possibility by adding an interaction term to all models reported in Tables 3 and 4 (population size × area size), but the analyses showed no evidence of interaction effects (results not shown).
To sum up, the more systematic effects of population size are noteworthy. They suggest that population size has a stronger bearing on the political agenda than the municipality’s geographical size does. Thereby the findings corroborate the rather one-sided focus on population size in the literature on jurisdiction size. However, as shown in the second part of the analysis, the saliency of individual issues does vary systematically with area size, not just population size.
The issue content of local policy agendas
To evaluate Hypotheses 3 and 4, we analyze the issue content of local policy agendas. In other words, we shift the level of analysis to the major policy-topic categories (cf. Table 1). In line with the hypotheses, we focus on the share of local policy agendas devoted to each of the 20 major topics, estimating one model for each topic and country. Because major-topic attention shares sum to 100 within each municipality, the dependent variables are linearly dependent across models. To account for this, we estimate the models using seemingly unrelated regressions (SUR) and omit one category (“International Affairs”), which serves as the residual reference category. The coefficients shown in the coefficient plots in Figures 4–7 should therefore be interpreted as the effect of the explanatory variables on the allocation of attention to a given topic relative to the omitted category. Note that all models include the same control variables used in the analyses reported in Tables 3 and 4, and that we estimate cross-sectional models using averages over the entire period. For purposes of presentation, we report only the coefficients for the population and area size variables.
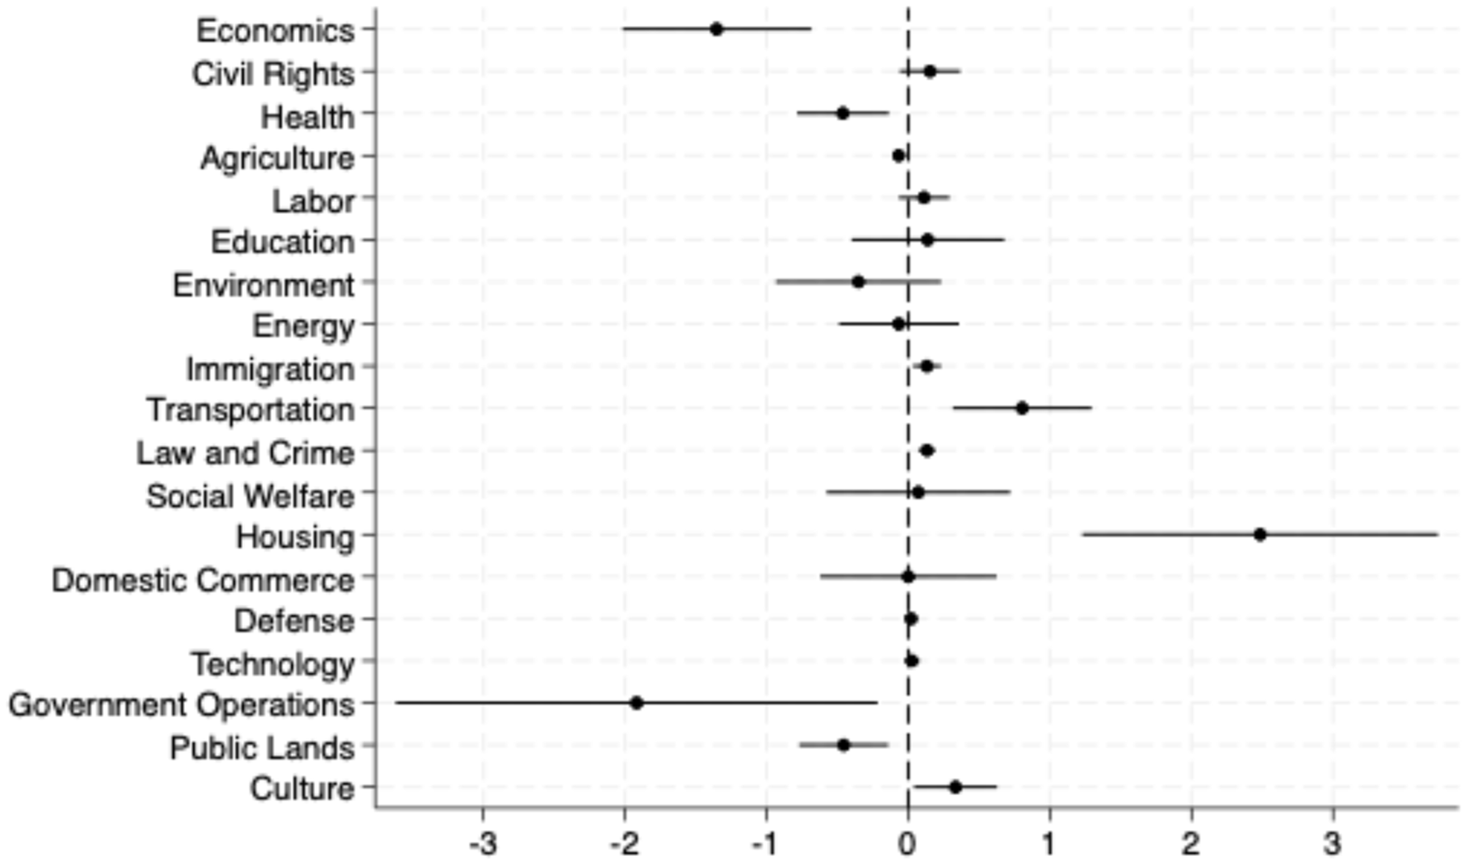
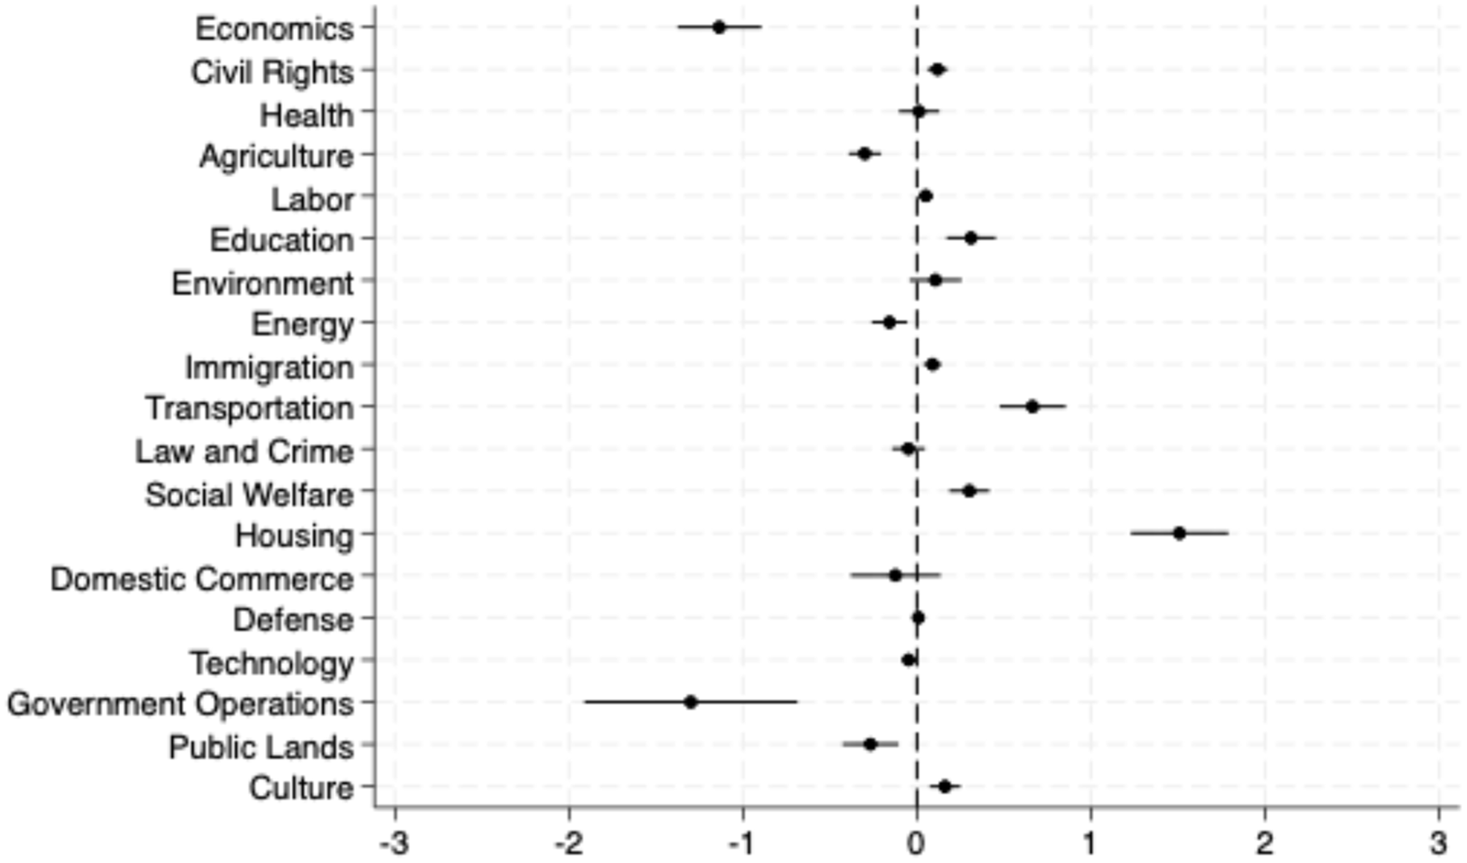
Effects of population size on attention to major issues in Denmark.
Note: Point estimates for the effect of logged population size on the proportion of attention devoted to each issue in a regression model with both population and area as independent variables. Horizontal lines indicate 95% confidence intervals.

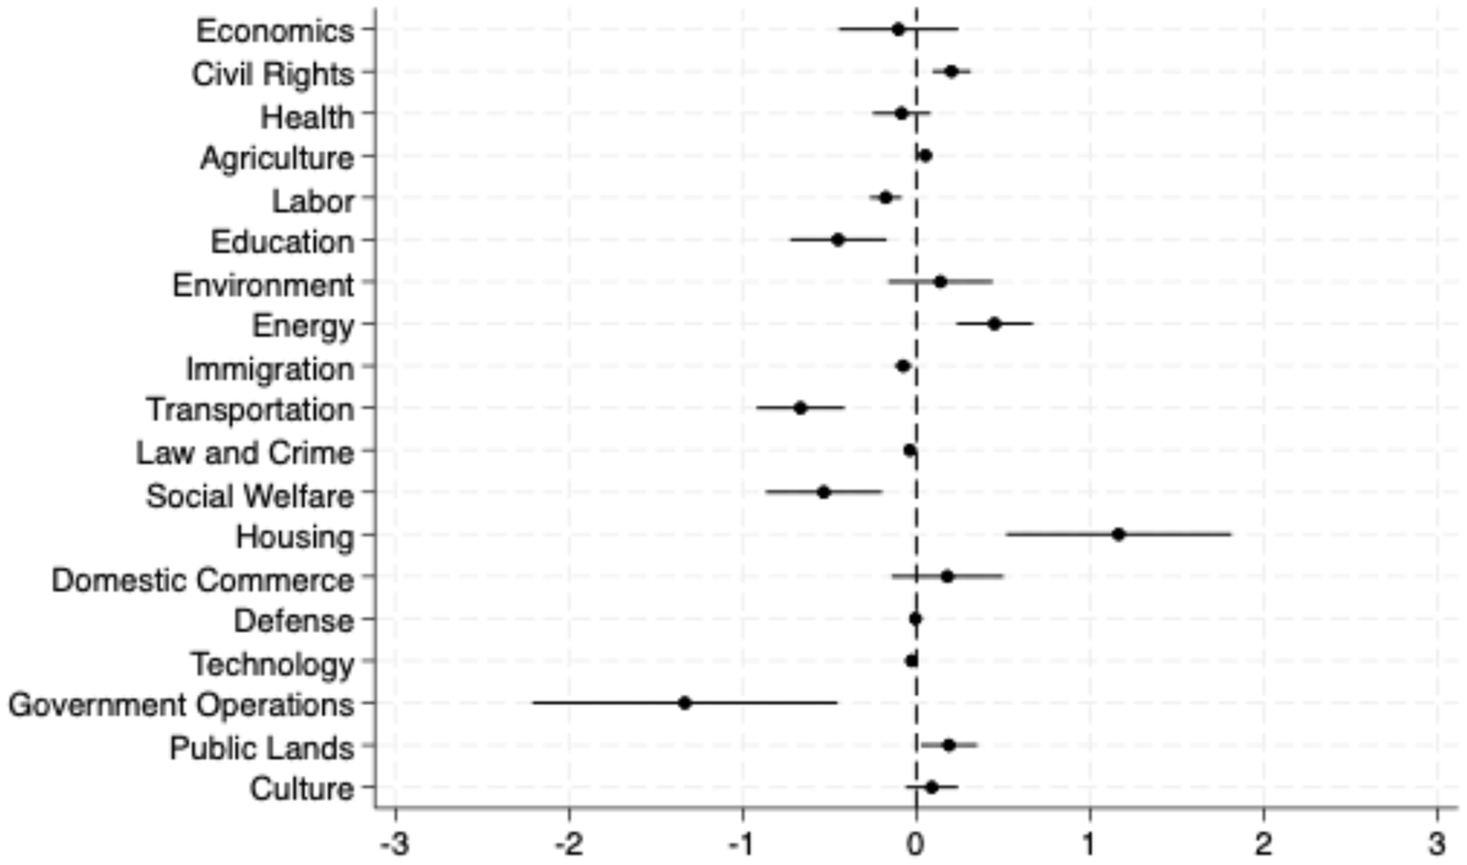
Effects of population size on attention to major issues in Norway.
Note: Point estimates for the effect of logged population size on the proportion of attention devoted to each issue in a regression model with both population and area as independent variables. Horizontal lines indicate 95% confidence intervals.

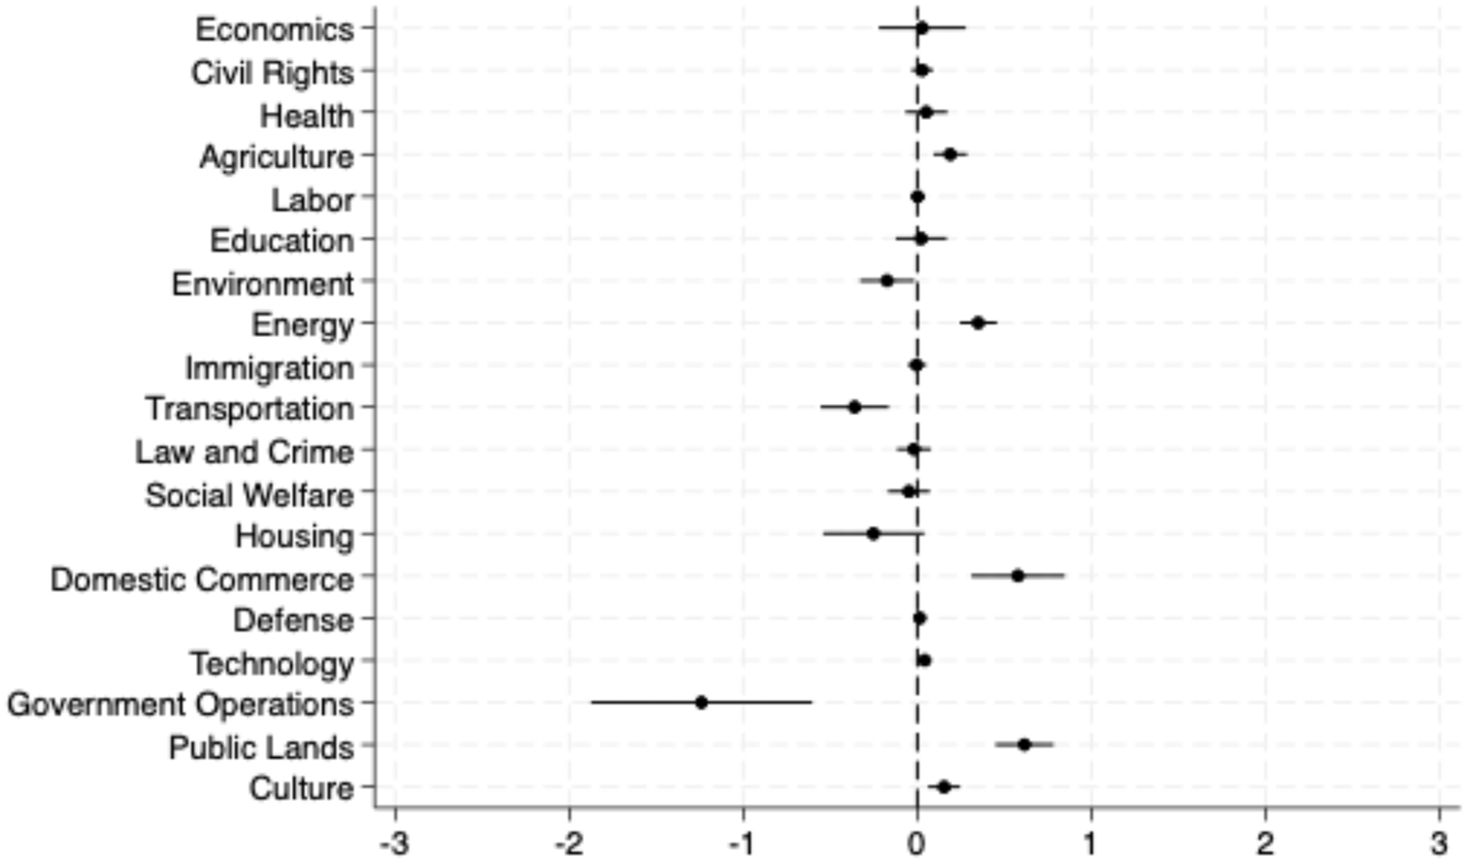
Effects of area size on attention to major issues in Denmark.
Note: Point estimates for the effect of logged area on the proportion of attention devoted to each issue in a regression model including both population and area as independent variables. Horizontal lines indicate 95% confidence intervals.

Effects of area size on attention to major issues in Norway.
Note: Point estimates for the effect of logged area on the proportion of attention devoted to each issue in a regression model with both population and area as independent variables. Horizontal lines indicate 95% confidence intervals.

Figures 4 and 5 present the estimated effects of population size on local policy attention across issues in Denmark and Norway, respectively. Broadly speaking, the patterns are similar across the two countries and largely consistent with Hypothesis 3. First, economics and government operations occupy a smaller share of the policy agenda in larger municipalities than in smaller municipalities. Thus, the agenda analysis also demonstrates a new way of identifying administrative economies of scale in the sense that local politicians in larger municipalities spend relatively less time on these issues than their counterparts in smaller municipalities. Second, the analysis supports the expectation that larger populations are associated with greater attention to issues such as housing, public transportation, and culture and education (although the latter relationship is not statistically significant in Denmark). These are all policy domains in which large populations may generate greater demand, making it reasonable that they receive more political attention in larger municipalities. In both countries we also find that population size has a negative effect on attention to public lands and agriculture.
Figures 4 and 5 reveal some further differences between the two countries that are not accounted for by Hypothesis 3. For example, in Denmark, population size has a small positive effect on attention to law-and-crime issues and a negative effect on attention to health issues. In Norway, we do not observe these relationships; instead, population size has a negative effect on energy issues and a positive effect on social welfare. Such differences may reflect country-level variation in how these issues are organized and in how the intensity of societal problems is distributed geographically.
Figures 6 and 7 show the effects of municipal size in terms of area in Denmark and Norway, respectively. These coefficient plots shed light on Hypothesis 4, which predicted that issues of public land, environment, energy, and agriculture would occupy more space on the local policy agenda in large-area jurisdictions, whereas issues of crime and social welfare would occupy less space. The results provide some support for this hypothesis. In both countries, councils in geographically larger municipalities devote more attention to issues of energy, public lands, and agriculture (although the latter effect is very small in Denmark). This is consistent with the argument underlying Hypothesis 4, namely that these are policy areas in which geographic dispersion may impose logistical challenges and costs, thereby requiring greater municipal discussion, regulation, and investment. For environment-related issues, we find no effect in Denmark and, contrary to Hypothesis 4, a small negative effect in Norway. However, for crime and social welfare, we find the expected negative effect only in Denmark. There are also other differences between the two countries. In Denmark, large-area municipalities devote significantly less attention to education, whereas in Norway, large-area municipalities pay more attention to domestic commerce, which may reflect the inclusion of tourism within this major-topic category. Finally, we surprisingly find area size to be negatively associated with attention to transportation in both Denmark and Norway.
In sum, the results shown in Figures 4–7 appear more consistent with Hypothesis 3 than with Hypothesis 4. Nevertheless, the coefficient plots for area clearly indicate that geographic area is an important and independent component of jurisdiction size. The importance of area did not emerge in the first part of the analysis, which focused on the structural dimensions of local policy agendas, but became visible only in the issue-by-issue comparisons.
Conclusion
The policy agenda of local councils is essential to determining what is discussed – and what is not – at the local level of government. This article has argued and demonstrated that these local policy agendas are shaped by fundamental features of the local political system, namely jurisdiction size in terms of both population and geographical area. In particular, we find a strong and systematic effect of population size: the greater the municipal population, the greater the number of items addressed in local council meetings, the greater the diversity in the issues addressed, and the more likely it is that attention is distributed evenly across different topics and issues. In contrast, with few exceptions, the effect of geographic area on these dimensions of local policy agendas is weak and statistically insignificant. This corroborates the broader jurisdiction literature’s predominant focus on population size (Blom-Hansen et al. Reference Blom-Hansen, Houlberg and Serritzlew2014; Dahl and Tufte Reference Dahl and Tufte1973; Gerring and Veenendaal Reference Gerring and Veenendaal2020).
We also examined the relationship between jurisdiction size and the relative attention devoted to different topics on the local council agendas. Again, we find systematic differences between large and small municipalities, including differences associated with variation in geographic area. Most of these patterns are similar across the two countries, although we also identify some differences in issue attention not accounted for by our theoretical expectations. Thus, area size does matter to the saliency of local policy issues, but more research is needed to understand how and why area size matters.
Across the many analyses reported in the paper, the results suggest that fundamental decisions about the structure of local jurisdictions – how large they are and how far they extend – have lasting consequences for what appears on the policy agenda. In other words, the scope of local democracy is shaped not only by voters and politicians, but also by geography and by jurisdictional boundaries often established many years ago. This constitutes an important contribution to the agenda-setting literature, which, as argued in the introduction, has been dominated by national-level studies conducted within contexts of fixed jurisdiction size. Another contribution stems from the estimation of large-N statistical models, which was made possible by the large number of local political units. National-level studies of policy agendas have often focused on within-unit variation and explanatory factors that vary over time, but as we argue and demonstrate in this paper, structural and relatively stable characteristics of political systems also play an important role in shaping the content and structure of policy agendas.
The results raise more general questions about the trade-offs associated with jurisdiction size. The findings might be interpreted as “democratic complexity costs” of larger jurisdictions, and in that sense increasing jurisdiction size will impede some dimensions of the local democracy (Mortensen et al. Reference Mortensen, Loftis and Seeberg2022, p. 62). However, this may be counterbalanced by the gains in terms of “democratic scope” of larger municipalities. They can simply manage a broader portfolio of tasks. In other words, Dahl’s (Reference Dahl1967, p. 960) expression still seems relevant: “…participation in very large units becomes minimal and in very small units it becomes trivial.” Another relevant aspect concerns the decision-making capacity of the local elected councils. Whereas larger organizations may expand their capacity by hiring more people, the size of a council is often (relatively) fixed and though councils tend to increase with population size they may often lack behind, and the large variation in the size of local policy agenda across jurisdictions also raises an issue of the workload faced by politicians, which deserves further scholarly attention.
There are, of course, limitations to our study of jurisdiction size and local policy agendas. First, in both countries, local councils are constrained by national legislation with respect to which issues they may or must (not) address, which likely narrows local agendas compared to those in national-level politics. One indication of this is that the agenda diversity and complexity scores of local council agendas are generally lower than the corresponding scores reported for national-level policy agendas (Boydstun et al. Reference Boydstun, Bevan and Thomas2014).
Second, the inclusion of two countries, many municipalities, control variables, and robustness tests strengthens the argument that jurisdiction size affects local policy agendas. However, in cross-sectional studies based on observational data, we can never be certain that the relationship is causal. Utilizing more recent amalgamation initiatives in Norway, for example, could provide one way of strengthening causal identification in future studies (see also Mortensen et al. Reference Mortensen, Loftis and Seeberg2022).
Third, there may be additional dimensions of local policy agendas influenced by jurisdiction size. In this study, we have applied the widely used and well-established CAP coding scheme.Footnote 2 This increases relevance and comparability with national-level studies of policy agendas, but future research could also examine other aspects and dimensions of local agendas. For example, a follow-up study could investigate the extent to which local council agendas reflect a detail-oriented mode of governing or a broader, policy-oriented mode, and how these different modes relate to municipal size.
We see many opportunities to expand and strengthen the findings presented here, and we hope other scholars will be inspired to examine classic questions in political science and agenda-setting through the analytical opportunities offered by local government.
Supplementary material
The supplementary material for this article can be found at https://doi.org/10.1017/S0143814X26101354
Data availability statement
Replication materials are available in the Journal of Public Policy Dataverse at: https://doi.org/10.7910/DVN/GC7HEQ.
Acknowledgements
We thank the editor as well as the three anonymous reviewers for constructive and helpful comments on the article.


 Open access

