


1. Introduction
Particle-laden turbulent flows are encountered widely, including in various industrial (Balachandar & Eaton Reference Balachandar and Eaton2010; Nathan et al. Reference Nathan, Jafarian, Dally, Saw, Ashman, Hu and Steinfeld2018) and biomedical applications (Nurkiewicz et al. Reference Nurkiewicz, Porter, Hubbs, Cumpston, Chen, Frazer and Castranova2008; Mallik, Mukherjee & Panchagnula Reference Mallik, Mukherjee and Panchagnula2020; Chen, O'Mahony & Barber Reference Chen, O'Mahony and Barber2021). Some industrial examples include the production of cement, lime and alumina, solid fuel combustion, sprays and the particle-based solar energy receivers and reactors that are under development. Applications in the biomedical area include aerosol drug delivery, particle-laden inks in bioprinting, inhalation exposure systems and transmission of disease through coughs and sneezes (Mittal, Ni & Seo Reference Mittal, Ni and Seo2020; Chong et al. Reference Chong, Ng, Hori, Yang, Verzicco and Lohse2021). In particle-laden turbulent flows, multi-scale turbulence interacts with particles, which in turn leads to complex phenomena such as enhanced or reduced particle dispersion and particle clustering (Lau, Frank & Nathan Reference Lau, Frank and Nathan2019). Improved understanding of these interactions will aid in achieving design objectives such as process optimisation, efficiency improvements and scale-up of new technology, which in turn requires the reliable prediction of heat and mass transport in flows carrying particles or droplets in suspension.
In a free shear particle-laden jet, which is a canonical flow, the characteristic flow time scale varies in space as the shear-driven turbulence evolves and decays, resulting in spatially varying local Stokes numbers, defined as the ratio of particle to flow characteristic time scales. Moreover, the greater inertia of particles relative to a single-phase flow increases the influence on the downstream dynamics of particle-laden jets of the accumulated effects of the turbulent structure in the supply pipes upstream of the nozzle exit (Ball, Fellouah & Pollard Reference Ball, Fellouah and Pollard2012). The combined, coupled effects of turbulence–particle interaction, turbulence modification, particle dispersion and clustering, together with the evolving turbulence scales with downstream distance, are complex and remain poorly understood.
Previous experimental studies have made significant strides in improving our understanding of turbulence–particle interaction in particle-laden turbulent jets. Early studies identified the key dimensionless parameters such as mass loading (Modarress, Tan & Elghobashi Reference Modarress, Tan and Elghobashi1984), particle to jet diameter ratio (Tsuji et al. Reference Tsuji, Morikawa, Tanaka, Karimine and Nishida1988) and Stokes number (Hardalupas et al. Reference Hardalupas, Taylor, Whitelaw and Weinberg1989) in these flows. Furthermore, previous studies of particle dispersion (Crowe, Gore & Troutt Reference Crowe, Gore and Troutt1985), particle-phase mass flux and number density distributions (Fan, Zhao & Cen Reference Fan, Zhao and Cen1997; Aísa et al. Reference Aísa, Garcia, Cerecedo, García Palacín and Calvo2002), gas-phase turbulence intensity (Hetsroni Reference Hetsroni1989) and gas- and particle-phase velocity statistics (Sakakibara, Wicker & Eaton Reference Sakakibara, Wicker and Eaton1996; Fan, Zhao & Cen Reference Fan, Zhao and Cen1992; Longmire & Eaton Reference Longmire and Eaton1992), have provided valuable insights for model development and industrial design. However, most of these experimental studies employed poly-dispersed particles, which results in the flow simultaneously having multiple particle response times. Although turbulent flows necessarily have multiple length scales, which fluctuate in time and space, it is possible to identify the dominant flow time scales, leading to a single characteristic value of the Stokes number for a given particle size. However, multiple particle sizes result in multiple values of the local characteristic Stokes number, owing to the squared dependence of the Stokes number on the particle diameter. This complicates analyses of these flows on a fundamental level, as the effect of Stokes number cannot be isolated from other controlling parameters. Moreover, the inflow conditions, i.e. the gas- and particle-phase velocities, together with the particle number density, were mostly not well characterised, making it difficult to generalise the conclusions of these studies as the evolution of the particle-laden jet is closely related to its inlet conditions. Recent experiments in a particle-laden turbulent round jet (PLRJ) were conducted to address these issues through the use of well-characterised inflow conditions and mono-dispersed particles (Lau & Nathan Reference Lau and Nathan2014, Reference Lau and Nathan2016). By simultaneously measuring the particle velocity and number density, the effects of inlet Stokes number on particle-phase reorganisation and velocity decay were investigated quantitatively. These studies found that there were local humps in the centreline concentration of particles, which were explained by a combination of the axial velocity decay together with the radial migration of the particle phase, providing a better understanding of the particle migration in space. More interestingly, it was inferred from the evolution of the axial and radial particle root mean square (r.m.s.) velocity that particles tend to respond preferentially to the gas-phase velocity in the axial direction compared with the radial direction. However, these experiments do not provide simultaneous measurements of the gas- and particle-phase quantities that are needed to provide critical quantitative information on the level of direction-dependent particle response, turbulence modulation, as well as the evolution of the local Stokes number. This, in turn, hinders the advancement of our fundamental understanding of these flows.
As a complement to experiments, direct numerical simulation (DNS) provides a unique capability to resolve fine-scale structure and to fully capture the spatially three-dimensional and time-evolving details of key variables such as the instantaneous gas- and particle-phase velocities as well as the particle number density, which are needed to understand the turbulence–particle interaction. To model the dynamics of the particle phase, a point-particle assumption is often utilised together with DNS (PP-DNS), following the pioneering work by Riley and Patterson (Reference Riley and Patterson1974). This approach circumvents the difficulties of directly solving the fundamental transport equation for the particle and gas phases together with the interfacial conditions by treating each particle as a point source. An appropriate particle acceleration model is therefore needed to represent the integrated hydrodynamic stress on a particle. Such models usually involve the assumption of low-to-moderate particle Reynolds numbers (such that no vortex shedding around the particle occurs), uniform flow seen by the particle, a spherical particle shape, etc. Notwithstanding limitations in knowledge of the conditions under which the assumptions begin to break down, PP-DNS has been widely applied to investigate turbulence–particle interaction in homogeneous isotropic turbulence (HIT) (Squires & Eaton Reference Squires and Eaton1990, Reference Squires and Eaton1991; Elghobashi & Truesdell Reference Elghobashi and Truesdell1992; Druzhinin & Elghobashi Reference Druzhinin and Elghobashi1999; Ferrante & Elghobashi Reference Ferrante and Elghobashi2003) and turbulent channel/pipe flows (McLaughlin Reference McLaughlin1989; Kontomaris, Hanratty & McLaughlin Reference Kontomaris, Hanratty and McLaughlin1992; Pan & Banerjee Reference Pan and Banerjee1996; Vreman Reference Vreman2007; Zhao, Andersson & Gillissen Reference Zhao, Andersson and Gillissen2013; Zhao, George & van Wachem Reference Zhao, George and van Wachem2015). These studies have demonstrated the usefulness of PP-DNS in predicting particle-laden flows in one-way (McLaughlin Reference McLaughlin1989; Squires & Eaton Reference Squires and Eaton1990, Reference Squires and Eaton1991; Elghobashi & Truesdell Reference Elghobashi and Truesdell1992; Kontomaris et al. Reference Kontomaris, Hanratty and McLaughlin1992), two-way (Pan & Banerjee Reference Pan and Banerjee1996; Druzhinin & Elghobashi Reference Druzhinin and Elghobashi1999; Ferrante & Elghobashi Reference Ferrante and Elghobashi2003;Vreman Reference Vreman2007; Zhao et al. Reference Zhao, Andersson and Gillissen2013) and four-way (Zhao et al. Reference Zhao, George and van Wachem2015) coupled regimes. These PP-DNS studies also provided quantitative analysis on the energy spectrum of the gas-phase turbulence and the vortical structure of the flow field, demonstrating the power of PP-DNS to reveal details of turbulence–particle interaction that are challenging to resolve using experimental methods alone.
Compared with the wide application in HIT and turbulent channel flows, the applications of PP-DNS in particle-laden turbulent jets have been relatively limited to date. Yuu, Ikeda & Umekage (Reference Yuu, Ikeda and Umekage1996) performed PP-DNS of a particle-laden jet in the two-way coupled regime with a low inlet Reynolds number ( $R{e_D}$, based on the jet diameter and inlet velocity) of 1700. It was shown that the presence of the particle phase resulted in a reduction of the gas-phase turbulence intensity by 20–50 % in the near and intermediate field before
 $15{D_j}$. This work was further extended by Li et al. (Reference Li, Fan, Luo and Cen2011), to investigate the effect of the Stokes number on vortical structures of the gas-phase flow field. Picano et al. (Reference Picano, Sardina, Gualtieri and Casciola2010) and Casciola et al. (Reference Casciola, Gualtieri, Picano, Sardina and Troiani2010) performed PP-DNS of a one-way coupled particle-laden jet at
 $R{e_D} = 4000$. Their work revealed that the particle transport in the intermediate field (before particles end up behaving as Lagrangian tracers) has a significant ‘memory’ of the initial conditions of the flow. These studies have greatly enhanced the understanding of the particle response and turbulence modulation in particle-laden jets. However, for a two-way coupled particle-laden jet, the interaction of turbulence and particles results in flow phenomena that are not currently fully understood, including near-field particle reorganisation, direction-dependent response of particles and anisotropic modulation of the gas-phase turbulence, which warrants further investigation at the fundamental level. In particular, the particle number density distribution at the nozzle exit is typically non-uniform, resulting in particle reorganisation in the near field. However, almost all previous studies assumed a uniform particle distribution, which hinders quantitative comparison with experiments in terms of particle number density distribution and investigation of their reorganisation downstream. Additionally, turbulent jets feature different integral length scales in the axial and radial directions. In a particle-laden jet, this results in a direction-dependent response of particles, and subsequently, an anisotropic modulation of the gas-phase turbulence. The level of direction-dependent particle response, as well as the variation of the integral length scale due to the presence of the particle phase, requires further quantification. Furthermore, turbulent jets produce inhomogeneous shear-driven turbulence, in which the role of the particle phase on the gas-phase turbulent kinetic energy (TKE), either as a production source or a dissipative sink, is not as obvious as in the configuration of HIT (Druzhinin & Elghobashi Reference Druzhinin and Elghobashi1999; Ferrante & Elghobashi Reference Ferrante and Elghobashi2003) or homogeneous shear flow (Gualtieri et al. Reference Gualtieri, Picano, Sardina and Casciola2013). In particular, the effect of particle reorganisation and direction-dependent particle response on turbulence modulation has barely been investigated.
The present investigation aims to tackle these issues by performing PP-DNS directly comparable to a laboratory particle-laden turbulent jet. Specifically, PP-DNS is carried out for the Adelaide PLRJ (Lau & Nathan Reference Lau and Nathan2014, Reference Lau and Nathan2016), which is in the two-way coupled regime with a  $R{e_D}$ of the order of 10 000. The inflow conditions are specified to account for the gas–particle slip velocity and the non-uniformity of the particle number density. Quantitative comparisons of the near-field particle reorganisation of particle concentration fields, as well as the particle velocity decay in the intermediate field (before particles end up behaving as Lagrangian tracers) are carried out. A budget analysis on the gas-phase TKE transport equation is carried out to reveal the role of the particle phase in turbulence modulation in both the near
 $(5{D_j})$ and intermediate-field ((5–20)Dj) regions. A comparison is also made between the integral length scales in the axial and radial directions, based on which the characteristic axial and radial Stokes numbers are computed to explain the direction-dependent particle response. The paper is organised as follows. The simulation approach and detailed configurations, especially the inlet conditions, are described in § 2. A quantitative comparison with the experiment, as well as an analysis of self-similarity, turbulence modulation and direction-dependent particle response are presented in § 3. Conclusions are presented in § 4.
2. The PP-DNS of the Adelaide particle-laden round jet
2.1. Adelaide PLRJ
The details of the experimental arrangement have been reported previously and readers are referred to Lau & Nathan (Reference Lau and Nathan2016) for the schematic plot of the experimental set-up, therefore only a brief description is included here. The Adelaide PLRJ is a turbulent round jet of air seeded with solid spherical particles surrounded by a weak co-flow of air. The air–particle mixture is injected downwards vertically into a confined wind tunnel from a 2080 mm long pipe with diameter  ${D_j} = 12.7$ mm. The particles are made of poly (methyl methacrylate) with a material of density
 ${\rho _p} = 1200\;\textrm{kg}\;{\textrm{m}^ - }^3$. The standard deviation of the particle diameter (
 ${d_p}$) is less than 5 %, resulting in a nearly mono-dispersed particle size distribution.
The selected flow conditions result in three exit Stokes numbers ( $S{t_D}$) of 0.3, 1.4 and 11.2, with
 $S{t_D}$ defined as
 ${\tau _p}/{\tau _{g,D}},$ where
 ${\tau _p} = {\rho _p}d_p^2/({\rho _g}18{\nu _g})$ is the characteristic time scale of the particle response and
 ${\tau _{g,D}} = {D_j}/{U_{g,x - b - e}}$ is the inflow time scale based on the jet bulk velocity (
 ${U_{g,x - b - e}}$) and the jet diameter (
 ${D_j}$). Here,
 ${\rho _g} = 1.2\;\textrm{kg}\;{\textrm{m}^{ - 3}}$ and
 ${\nu _g} = 1.5 \times {10^{ - 5}}\;{\textrm{m}^2}\;{\textrm{s}^{ - 1}}$ represent the density and the kinematic viscosity of air at 293 K, respectively. Two other alternative definitions of the Stokes number that may be relevant to the present study are the Stokes number based on the Kolmogorov time scale, i.e.
 $S{t_\eta } = {\tau _p}/{\tau _\eta }$, where
 ${\tau _\eta }$ is the local Kolmogorov scale of the gas phase, and the Stokes number based on the mean centreline velocity (
 $\langle {U_{g,x - c}}\rangle $) and velocity half-width (
 ${R_{0.5{U_{g,x - c}}}}$), i.e.
 $S{t_L} = {\tau _p}/{\tau _{g,L}} = ({\rho _p}d_p^2/(18{\nu _g}{\rho _g}))/(2{R_{0.5{U_{g,x - c}}}}/\langle {U_{g,x - c}}\rangle )$. These latter two Stokes numbers are computed a posteriori based on the results of the numerical simulations. Table 1 presents the values of
 $S{t_L}$ at the inlet and at the end of domain
 $(x/{D_j} = 30)$, respectively, as well as the maximum and minimum
 $S{t_\eta }$ along the centreline. As shown,
 $S{t_L}$ at
 $x/{D_j} = 30$ decreases to 0.03, 0.15 and 1.66 for
 $S{t_D} = 0.3$, 1.4 and 11.2, respectively. The maximum centreline
 $S{t_\eta }$ is 1.57, 5.66 and 50.4 for
 $S{t_D} = 0.3$, 1.4 and 11.2, respectively, while the minimum centreline
 $S{t_\eta }$ is 0.43, 2.22 and 16.4. More details are presented in Appendix A.
Characteristic Stokes numbers (Appendix A).

The mass loading  ${\phi _m}$, defined as the ratio of particle-to-air mass flow rate (
 ${\phi _m} = {\dot{m}_p}/{\dot{m}_g}$), was controlled by calibrated screw feeders and was fixed at 0.4 for all three cases. Here, it should be noted that
 ${\phi _m}$ is sufficiently high for the particle phase to exert a significant influence on the surrounding fluid, while the particle-phase volume fraction is sufficiently low (
 ${\sim} {10^{ - 4}}$) for particle collisions to be neglected, resulting in the flow being in the two-way coupled regime (Elghobashi Reference Elghobashi1991, Reference Elghobashi2006). The particle velocity and number density were measured using particle image velocimetry and planar nephelometry, respectively. The mono-dispersed particle size distribution, together with the well-characterised inflow profiles of particle velocity and number density, make this experimental set-up an ideal configuration for quantitative numerical investigation.
2.2. Point-particle DNS
The point-particle approach in the Eulerian–Lagrangian framework was employed to capture the turbulence–particle interaction. The transport equations of the mass, momentum and total energy for the gas phase are
 \begin{gather}\frac{{\partial {\rho _g}}}{{\partial t}} + \frac{{\partial {\rho _g}{U_{g,i}}}}{{\partial {x_i}}} = 0,\end{gather}
 \begin{gather}\frac{{\partial {\rho _g}{U_{g,i}}}}{{\partial t}} + \frac{{\partial {\rho _g}{U_{g,i}}{U_{g,j}}}}{{\partial {x_j}}} ={-} \frac{{\partial p}}{{\partial {x_i}}} + \frac{{\partial {\tau _{ij}}}}{{\partial {x_j}}} + {F_{p,i}},\end{gather}
 \begin{gather}\frac{{\partial {\rho _g}{e_g}}}{{\partial t}} + \frac{{\partial {U_{g,j}}({\rho _g}{e_g})}}{{\partial {x_j}}} ={-} \frac{{\partial p{U_{g,j}}}}{{\partial {x_j}}} + \frac{{\partial {\tau _{ij}}{U_{g,i}}}}{{\partial {x_j}}} - \frac{{\partial {q_j}}}{{\partial {x_j}}} + {U_{g,j}}{F_{p,j}},\end{gather}
where subscripts ‘ $g$’ and ‘
 $p$’ represent gas and particle phase, respectively. Here,
 ${\rho _g}$ represents the material density of the gas phase,
 ${U_{g,i}}$ is the
 $i\textrm{th}$ component of the gas-phase velocity, p and
 ${\tau _{ij}}$ represent the pressure and shear stress tensor of the gas phase, respectively,
 ${e_g}$ is the total energy (kinetic energy plus internal energy) and
 ${q_j}$ is the
 $j\textrm{th}$ component of the heat flux. Einstein notation is applied to the repeated indices. Note that the influence of particle volume on gas-phase continuity and momentum is neglected as the particle-phase volume fraction is negligibly low, around ~
 ${10^{ - 4}}$. As a result, equations (2.1)–(2.3) are essentially the same as the single-phase Navier–Stokes equations, except for the
 ${F_{p,i}}$ term, which represents the feedback force from the particle phase. A kernel-estimation-based method is employed to compute
 ${F_{p,i}}$ at position
 $\boldsymbol{x}$
 \begin{align}{F_{p,i}}(\boldsymbol{x}) = \sum\limits_{k = 1}^{{N_p}} {\int_\mathrm{\mathcal{D}} {\left( {m_p^0\frac{{\textrm{d}U_{p,i}^{(k)}}}{{\textrm{d}t}}} \right)P\{ \boldsymbol{x} - \boldsymbol{x^{\prime}}\} \delta (\boldsymbol{x^{\prime}} - \boldsymbol{x}_p^{(k)})\,\textrm{d}\kern0.06em \boldsymbol{x^{\prime}}} } = \sum\limits_{k = 1}^{{N_p}} {\left( {m_p^0\frac{{\textrm{d}U_{p,i}^{(k)}}}{{\textrm{d}t}}} \right)P\{ \boldsymbol{x} - \boldsymbol{x}_p^{(k)}\} } ,\end{align}
where the superscript ‘ $k$’ represents the
 $k\textrm{th}$ particle,
 ${N_p}$ represents the total number of particles,
 $\mathrm{\mathcal{D}}$ represents the entire domain,
 $m_p^0$ represents the mass of an individual particle and
 $\delta $ is the Kronecker delta. Here,
 $P\{ \boldsymbol{x} - \boldsymbol{x^{\prime}}\} $ represents a mollification kernel. The application of the mollification kernel avoids the oscillatory nature of the particle-in-cell method, which may induce numerical instability, especially where high-order central difference schemes are employed (Pepiot & Desjardins Reference Pepiot and Desjardins2012). The point-particle force is projected onto the Eulerian grid smoothly and conservatively via a polynomial
 $P\{ \boldsymbol{x} - \boldsymbol{x^{\prime}}\} $ which approximates a Gaussian shape, yet is continuous
 \begin{gather}P\{ \boldsymbol{x} - \boldsymbol{x^{\prime}}\} = C \times \zeta (\boldsymbol{x} - \boldsymbol{x^{\prime}}),\end{gather}
 \begin{gather}\zeta (\boldsymbol{x} - \boldsymbol{x^{\prime}}) = {[{s^2}({s^2} - 2) + 1]^2},\; \quad s = \min (|\boldsymbol{x} - \boldsymbol{x^{\prime}}|/\varDelta ,\; 1.0),\end{gather}
 \begin{gather}C = {1 / {\int_\mathrm{\mathcal{D}} {\zeta (\boldsymbol{x} - \boldsymbol{x^{\prime}})\,\textrm{d}\kern0.06em \boldsymbol{x^{\prime}}} }},\end{gather}
where  $\varDelta$ represents the grid width. Therefore, the mollification kernel essentially represents a sphere centred at each particle location and clipped at a radius of
 $\varDelta $. Similar formulations of
 $P\{ \boldsymbol{x} - \boldsymbol{x^{\prime}}\} $ have been successfully employed by other researchers (Pepiot & Desjardins Reference Pepiot and Desjardins2012), albeit in a fluidised bed configuration rather than a jet. Note that, in terms of code implementation, the source is distributed in a way corresponding to (2.5)–(2.7) but in a discrete manner.
The particle trajectory is computed by time integrating the equation of motion, which was originally developed by Basset, Boussinesq and Oseen (Basset Reference Basset1888), and was later derived again from first principles by Maxey and Riley (Maxey & Riley Reference Maxey and Riley1983). The full equation of motion includes the drag force, buoyancy force, lift force, added mass force, Basset history force and the force by the undisturbed velocity field (often referred to as the pressure gradient force). However, for small particles ( ${d_p} \sim O({l_\eta })$, where
 ${l_\eta }$ is the Kolmogorov scale) with a large density relative to the gas phase, as used in the current configuration (
 ${\rho _p}/{\rho _g} = 1000$), it is well established that the drag force is dominant (Maxey & Riley Reference Maxey and Riley1983; Armenio & Fiorotto Reference Armenio and Fiorotto2001). The effect of gravity is neglected because the Froude number computed based on the inlet jet velocity and the length of domain of interest (i.e.
 $30{D_j}$) is
 $O(10)$ for experiment and
 $O(100)$ for simulation, illustrating that the effect of gravity can be safely ignored in both experiment and simulation. Particle collisions are also negligible as the volume fraction of the particle phase is
 ${\sim} {10^{ - 4}}$. With these simplifications, the resulting equations of motion for the particle phase are
 \begin{gather}{m_p}\frac{{\textrm{d}{U_{p,i}}}}{{\textrm{d}t}} = {F_{D,i}},\end{gather}
 \begin{gather}\frac{{\textrm{d}\kern0.06em {x_{p,i}}}}{{\textrm{d}t}} = {U_{p,i}},\end{gather}
where  ${U_{p,i}}$ is the
 $i\textrm{th}$ component of the particle-phase velocity. Here,
 ${F_{D,i}}$ represents the drag force, and is computed based on the formulation proposed by Schiller and Naumann (Reference Schiller and Naumann1935),
 \begin{equation}{F_{D,i}} = 3{\rm \pi} {\mu _g}{d_p}({U_{s,i}} - {U_{p,i}})(1 + 0.15Re_p^{0.687}),\quad \; R{e_p} = \frac{{{d_p}|{\boldsymbol{U}_s} - {\boldsymbol{U}_p}|}}{{{\nu _g}}}.\end{equation}
This formulation extends the viscous drag to a higher Reynolds number, and it has been widely applied to predict the drag force when the particle Reynolds number ( $R{e_p}$) is less than 100, where the effect of vortex shedding behind the particle is expected to be negligible (Balachandar & Eaton Reference Balachandar and Eaton2010). For the current cases considered,
 $R{e_p}$ is
 ${\sim} O(10)$, which justifies the application of the Schiller–Naumann drag. The parameter
 ${U_{s,i}}$ in (2.10) denotes the
 $i\textrm{th}$ component of the undisturbed gas velocity seen by the particle, which is approximated by the interpolated gas-phase velocity at the particle location via a fourth-order Lagrange polynomial interpolation scheme. Note that the use of the mollification kernel does not affect the way that
 ${U_{s,i}}$ is computed, but rather distributes the drag force (
 ${F_{D,i}}$) to the grid nodes within the mollification kernel via a discrete and conservative operation.
The point-particle DNS was performed using the massively parallel code, S3D (Chen et al. Reference Chen2009), which is a well-validated code with strong scalability that has been successfully applied to a series of turbulent reacting flows (Chen et al. Reference Chen2009; Wang et al. Reference Wang, Hawkes, Chen, Zhou, Li and Aldén2017). In S3D, each message passing interface (MPI) process is responsible for a piece of the three-dimensional (3-D) domain, i.e. solving the transport equation for the grid points and particles within the domain. Note that all MPI processes have the same number of grid points, but the number of particles is not necessarily the same. Inter-processor communication is only between the nearest neighbours in a 3-D topology, and all-to-all communications are only required for monitoring and synchronisation ahead of input/output. The code has demonstrated scaling to well over 100 000 CPU cores (Chen et al. Reference Chen2009). The transport equations of the gas-phase continuity and momentum are discretised in Cartesian coordinates using an eighth-order central difference scheme. The solution is advanced in time by employing a fourth-order, six-stage, low-storage Runge–Kutta method (Kennedy, Carpenter & Lewis Reference Kennedy, Carpenter and Lewis2000). The particle equations are integrated in a fully coupled way together with the gas phase in the Runge–Kutta stages.
2.3. Simulation configuration
The PP-DNS of three PLRJ cases with the inlet Stokes numbers ( $S{t_D}$) of 0.3, 1.4 and 11.2 were carried out. The DNS configuration was designed to match the critical non-dimensional parameters of the experiment, i.e. the mass loading rate (
 ${\phi _m}$), inlet Stokes number (
 $S{t_D} = {\tau _p}/{\tau _{g,D}} = ({\rho _p}d_p^2/(18{\rho _g}{\nu _g}))/({D_j}/{U_{g,x - b - e}})$, where
 ${U_{g,x - b - e}}$ is the gas-phase axial component of the bulk velocity at the pipe exit) and inlet Reynolds number (
 $R{e_D} = {U_{g,x - b - e}}{D_j}/{\nu _g}$) such that the level of turbulence–particle interaction is maintained. The Mach number (
 $Ma = {U_{g,x - b - e}}/a$, where a is the speed of sound) in the experiments is 0.035, corresponding to an essentially incompressible flow. As it would be very costly to simulate a flow with such a low Mach number using a compressible solver, the Mach number in the DNS is set to 0.5, as a balance between reducing the computational cost and minimising the compressible effects, which are of the order of
 $(\gamma\unicode{x2013}1){(Ma/2)^2}$, where
 $\gamma $ represents ratio of the specific heat at constant pressure to that at constant volume. This is achieved in practical terms by scaling all physical length scales down, e.g. the jet and particle diameters, and velocity scales up, e.g. the jet and particle velocities, resulting in different Mach numbers but the same Stokes and Reynolds numbers. Note that, in the experiments, the particle-laden case
 $S{t_D} = 11.2$ has an inlet Reynolds number of 20 000. However, in the DNS, the corresponding Reynolds number is set to 10 000 to reduce the computational cost (noting that a DNS with
 $R{e_D} = 20\,000$ would be at least eight times more expensive than with 10 000), and to allow a comparison between the different Stokes number cases while keeping the Reynolds number constant. It is worth noting that the influence of Reynolds number on the jet dynamics is expected to be small in this high
 $R{e_D}$ range (Pitts Reference Pitts1991; Ball et al. Reference Ball, Fellouah and Pollard2012), and therefore the jet development in the simulations at
 $R{e_D} = 10\,000$ is expected to be similar had the simulations be performed at
 $R{e_D} = 20\,000$. To make this change of
 $R{e_D}$ (i.e. from 20 000 to 10 000) while preserving
 $S{t_D}$ at 11.2, the ratio
 ${D_j}/{d_p}$ is changed by
 ${\sim} 1.4 \times $, however, as
 ${d_p}$ is still much smaller than
 ${D_j}$, changes to this ratio are not expected to significantly influence the flow features. In addition to the three particle-laden cases, a simulation has also been performed for a single-phase jet under the same Reynolds number as the particle-laden jets but without injecting any particles. This provides a baseline to quantify any difference in the flow field due to the presence of the particle phase. Table 2 presents the operating conditions for which the simulations and experiments were performed.
Operating conditions for each case of the PP-DNS and experiment.

The 3-D Cartesian domain extends to  $30{D_j} \times 25{D_j} \times 25{D_j}$ in the streamwise and the two lateral directions. A uniform grid spacing of
 $\mathrm{\Delta }x = 0.02{D_j}$ was employed in the streamwise direction, while an algebraically stretched mesh is applied in the other two directions. The stretched mesh maintains a uniform spacing of
 $\mathrm{\Delta }y = \mathrm{\Delta }z = 0.02{D_j}$ within a
 $10{D_j} \times 10{D_j}$ region around the centreline (
 $5{D_j}$ on each side of the centreline), and is gradually stretched outside this region such that the maximum stretching rate near the side boundaries is below 3 %. This results in
 $1500 \times 750 \times 750$ grid points in total. The schematic plot of the computational domain and grid configuration are presented in figure 1.
Schematic plot for the computational domain and grid configuration.

The Kolmogorov length scale, i.e.  ${l_\eta } = {(\nu _g^3/{\epsilon _k})^{1/4}}$ where
 ${\epsilon _k}$ is the dissipation rate of gas-phase TKE, has its minimum value in the shear layer (Wang et al. Reference Wang, Hawkes, Chen, Zhou, Li and Aldén2017). Near to the shear layer,
 ${l_\eta }$ ranges from
 $0.25\varDelta $ (near field) to
 $0.8\varDelta $ (
 $30{D_j}$ downstream), therefore, the global minimum of
 ${l_\eta }$ is
 ${\sim} 0.25\varDelta $, occurring within the shear layer in the near field. Apart from the shear layer region in the near field, the grid resolution satisfies
 $\varDelta /{l_\eta } < 3.0$. Grid convergence tests with
 $1.5 \times $ finer resolution have also been carried out to ensure that the first and second moments of the statistics are grid independent (see Appendix C for the details of grid convergence test). The ratio of grid width over particle diameter, i.e.
 $\varDelta /{d_p}$ is approximately 30, 15 and 5 for the particle-laden jet of
 $S{t_D} = 0.3$, 1.4 and 11.2, respectively. Considering that
 $\varDelta $ is larger than
 ${d_p}$, the size of the mollification kernel was set to 1.0 (see (2.6)). Therefore, the use of mollification kernel is similar to a trilinear extrapolation, a widely applied scheme in a situation where particle diameter is smaller than the grid width (Tang et al. Reference Tang, Wang, Bolla, Wehrfritz and Hawkes2018). Simulations were run for at least 10 flow-through times, with the first 4 flow-through times used to reach a statistically stationary state, and the other 6 or more flow-through times utilised for time averaging. Spatial averaging over the azimuthal direction was also performed to reduce the statistical error. To collect the statistics of the particle phase, the entire computational domain is binned into 720 × 360 (in axial and radial directions, respectively) zones. These parameters for the statistics have been tested to ensure statistical convergence.
2.4. Boundary conditions
To quantitatively reproduce the distribution of particle velocity and number density of a given flow, it is essential, although non-trivial, to specify the appropriate instantaneous distributions of both the inflow velocity and number density. This implies injecting particles in such a way that both of these distributions match the experiment in the Adelaide PLRJ. However, given the limitations in understanding of the exit flow-field distribution at this level of detail in the experimental flow, together with the significant computational expense of computing the inflow through the full supply system, it was decided to develop a new approach to specify the inflow condition in greater detail than has been done before.
Almost all previous numerical studies of particle-laden jets have assumed uniform particle number density distributions at the nozzle exit. However, the experimental measurement on Adelaide PLRJ shows that the particle number density distribution at the jet emerging from a long pipe is far from uniform (Lau & Nathan Reference Lau and Nathan2016). Considering that the particle distribution at the pipe exit is not a free variable, but a result of the dynamics of the particle-laden pipe flow upstream of the exit, it is unlikely to be appropriate to de-couple the effect of exit conditions from that of other parameters, e.g.  $S{t_D}$. Therefore, in the present simulation, the particle distribution at the inlet was matched to the distribution measured experimentally. This was achieved by computing the probability density function of the particle-phase radial distribution (
 ${f_R}(r)$) for injection, where
 ${f_R}(r) \times dr$ represents the probability of a particle being injected at the radial location r. Based on its definition,
 ${f_R}(r)$ is proportional to the product of the ensembled averaged mean axial particle velocity and the mean number density at the inlet, i.e.
 ${f_R}(r)\sim \langle {U_{p,x - e}}(r)\rangle \times \langle {\varTheta _e}(r)\rangle $, both of which have been measured in the experiment. On this basis, particles were injected with their radial locations determined using the inverse transform sampling method to match
 ${f_R}(r)$, and with their azimuthal locations determined by a random variable uniformly distributed between 0 and
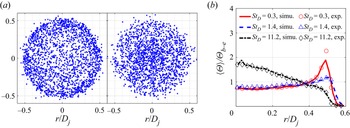
 $2{\rm \pi} $. Figure 2(a) presents the spatial distribution of ~2000 particles injected at the inlet for
 $S{t_D} = 0.3$ and 11.2, respectively. Figure 2(b) presents the generated radial profiles of the normalised mean particle number density (
 $\langle \varTheta \rangle /{\varTheta _{b - e}}$), where
 ${\varTheta _{b - e}}$ represents the bulk number density at the inlet. As shown, the generated profiles closely match the measured profiles, capturing the effect of the Stokes number on the non-uniform mean particle distribution, i.e. for
 $S{t_D} = 0.3$ and 1.4, particles concentrate near the edge of the jet (
 $r/{D_j}\sim 0.5$), while for
 $S{t_D} = 11.2$, particles concentrate near to the jet centreline.
The specified inflow conditions to the computational domain, showing (a) spatial distribution of ~2000 particles injected at the inlet,  $S{t_D} = 0.3$ (left),
 $S{t_D} = 11.2$ (right); (b) radial profiles of the normalised mean particle number density at the inlet. Experimental data from Lau & Nathan (Reference Lau and Nathan2016).

To specify the instantaneous distributions of inlet particle- and gas-phase velocity with ensemble averaged mean and r.m.s. profiles matching those of the experiment, the instantaneous velocity is decomposed into  ${U_i}(r,\theta ;t) = {U_{i,base}}(r) + {U_{i,fluc}}(r,\theta ;t)$, where r and
 $\theta $ represent the radial and circumferential directions,
 ${U_{i,base}}(r)$ is a radially varied but temporally constant profile matching the mean velocity in the experiments, while
 ${U_{i,fluc}}(r,\theta ;t)$ varies both spatially and temporally with a zero mean and with r.m.s. values that match the experiment. To generate
 ${U_{i,fluc}}$, the Passot–Pouquet energy spectrum (Passot & Pouquet Reference Passot and Pouquet1987) is employed to produce a homogeneous isotropic fluctuating velocity (
 ${\boldsymbol{u^{\prime}}_{HIT}}(x,y,z)$), which has a zero mean and a manually prescribed r.m.s. (
 $\sqrt {\langle \boldsymbol{u}^{{\prime}^2}_{HIT} \rangle }$, where
 $\langle \,\rangle $ represents the ensemble average operator). The turbulent velocity
 ${\boldsymbol{u^{\prime}}_{HIT}}$ is then scaled by a function that depends on the radial distance to match the measured radial profiles of the r.m.s. velocity for particle and gas phases, respectively. Finally, the scaled fluctuating velocity is fed to the inlet as
 ${U_{i,fluc}}$ by converting the spatial coordinate x to time t based on Taylor's frozen turbulence hypothesis.
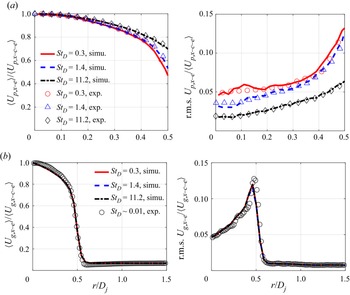
Figure 3(a) presents the inlet radial profiles of the mean and r.m.s. velocity of the particle phase, which were extracted from the simulations. As shown, these generated profiles match the experimental measurement reasonably well. Figure 3(b) presents the similar plot for the gas phase, which also exhibits reasonable agreement with experiment. Note that, for all three particle-laden cases, the inlet gas-phase velocity profiles were specified to match the ‘single-phase’ experimental measurement, in which the jet was seeded with tiny alumina particles with  $S{t_D}\sim 0.01$ such that these particles are expected to faithfully follow the flow field. The particle mass loading rate was maintained at 0.4, which is the same as the particle-laden cases. Nevertheless, the measured single-phase velocity is expected to be a reasonable approximation of the gas-phase velocity in the particle-laden jet.
(a) Inlet radial profiles of particle-phase mean axial velocity ( $\langle {U_{p,x}}\rangle $) and r.m.s. axial velocity (
 $\sqrt {\langle U^{\prime 2}_{p,x}\rangle } $). (b) Inlet radial profiles of gas-phase mean axial velocity (
 $\langle {U_{g,x}}\rangle $) and r.m.s. axial velocity (
 $\sqrt {\langle U^{\prime 2}_{g,x}\rangle } $). Experimental data from Lau & Nathan (Reference Lau and Nathan2016).

The other boundaries employ non-reflecting outflow boundary conditions (Sutherland & Kennedy Reference Sutherland and Kennedy2003; Yoo et al. Reference Yoo, Wang, Trouvé and Im2005); particles are removed from the computation if they cross those boundaries.
3. Results and discussion
In this section, a quantitative comparison between the PP-DNS and experiment is reported, which is followed by an investigation of turbulence modulation and particle response.
3.1. Particle velocity and number density
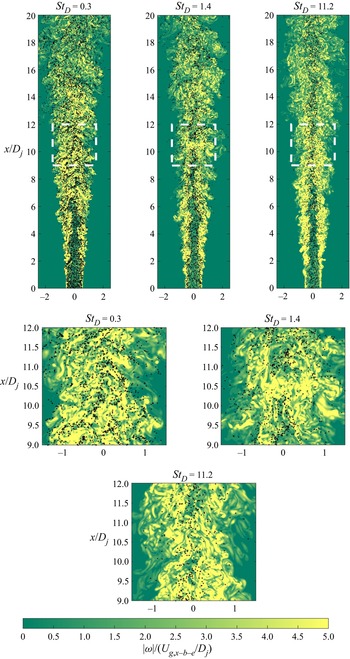
To illustrate the qualitative differences between the particle-laden jets at the three different Stokes numbers, figure 4 presents a slice of the spatial distribution of particles at a single time instance overlapped with the magnitude of the instantaneous gas-phase vorticity. As can be seen, particle clustering in the particle-laden jets with  $S{t_D} = 0.3$ and 1.4 is more significant than for
 $S{t_D} = 11.2$. For
 $S{t_D} = 0.3$ and 1.4, there is visual evidence of particles tending to concentrate in regions of low vorticity, consistent with expectation (Eaton & Fessler Reference Eaton and Fessler1994). However, there are also exceptions. For these two images, particles within the first few diameters of the inlet are observed to exhibit notable radial dispersion in response to the shear layer roll-ups (Mi, Nobes & Nathan Reference Mi, Nobes and Nathan2001), indicating a strong response to the gas-phase flow field. Meanwhile, for
 $S{t_D} = 11.2$, the particle locations show much less visual correspondence to the vorticity distribution. Also, for this high Stokes number case, particle clustering is less apparent than at
 $S{t_D} = 0.3$ and 1.4, and there is almost no radial dispersion within the first few jet diameters, where particles exhibit ballistic behaviour due to their large relaxation time scale compared with the local flow time scale. The observable radial dispersion only starts to occur after
 $15{D_j}$, consistent with the decrease in the local Stokes number with axial distance (Lau & Nathan Reference Lau and Nathan2016). More work is required to confirm or refine these visual observations with statistical analysis. Appendix D presents the investigation based on a Voronoi diagram, which provides a more quantitative analysis of particle clustering and preferential concentration in the low-vorticity region.
Instantaneous spatial distributions of particles overlaid with the vorticity magnitude normalised by a frequency defined by the inflow jet bulk velocity and jet diameter.

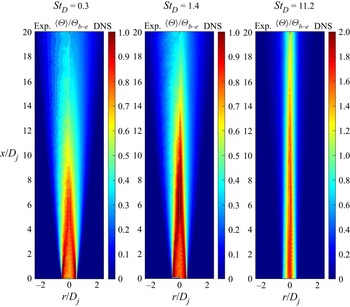
Figure 5 presents the predicted spatial distribution of the ensemble averaged mean particle number density in comparison with the experiment (Lau & Nathan Reference Lau and Nathan2016). For each image pair, the experimentally measured distribution is shown on the left, while the DNS is on the right. The particle number density was measured by using planar nephelometry, which infers the relative particle number density from the intensity of the measured Mie scattering signal (Birzer, Kalt & Nathan Reference Birzer, Kalt and Nathan2012). The particle number density in the DNS was computed as being  $\langle \varTheta (\boldsymbol{x})\rangle = \sum\nolimits_{i = 1}^{{N_t}} {[\sum\nolimits_{k = 1}^{N_p^{(i)}} {G(\boldsymbol{x} - \boldsymbol{x}_p^{(k,i)})} ]} /{N_t}$, where
 ${N_t}$ is the number of time instances used for the statistics,
 $N_p^{(i)}$ is the number of particles at the ith time instance,
 $\boldsymbol{x}_p^{(k,i)}$ represents the location of the kth particle at the ith time instance and
 $G(\boldsymbol{x} - \boldsymbol{x^{\prime}})$ represents a top hat function, which is essentially a cube centred at the location
 $\boldsymbol{x}$ with its volume corresponding to the local grid cell. As shown, the spatial distribution of the particle number density is well reproduced by the simulations. Specifically, both experiments and the simulations show that, for the two lower Stokes number cases, i.e.
 $S{t_D} = 0.3$ and 1.4, the region of peak particle number density shifts from the jet edge towards the centreline as the flow convects downstream. Furthermore, the simulations match the experiments in showing that the axial decay rate of particle number density decreases as
 $S{t_D}$ increases. As the only force term included in the equations of motion is the drag force, the close match between the experiment and simulation implies that incorporating only the drag force is sufficient to reasonably predict the large-scale features of the particle-phase motion for all particle-laden jets considered in this work.
Comparison of the measured (left) and simulated (right) spatial distributions of the mean particle number density ( $\langle \varTheta \rangle $) for three values of Stokes number. Experimental data from Lau & Nathan (Reference Lau and Nathan2016).

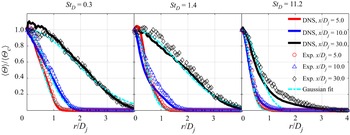
Figure 6 presents the radial profiles of the mean particle number density at three axial locations,  $x/{D_j} = 5.0$, 10.0 and 25.0. As can be seen, the radial profiles of
 $\langle \varTheta \rangle /\langle {\varTheta _c}\rangle $ for all three Stokes number cases were reproduced quantitatively by the simulations for most cases, although there are some differences. The relative error is less than 12 % in general. Moreover, Gaussian fits are applied to the measured profiles in the experiment, as it is well established that the passive scalar profile of a single-phase jet approaches a Gaussian in the far field (Pope Reference Pope2000). For
 $S{t_D} = 0.3$, the radial profiles of
 $\langle \varTheta \rangle /\langle {\varTheta _c}\rangle $ at all three axial locations match the Gaussian profiles reasonably well, especially for
 $x/{D_j} > 5.0$. Consistent with the findings in the experiment, the simulation results show that, for the case of
 $S{t_D} = 0.3$, the particles quickly reorganize from being preferentially concentrated at the jet edge (see figure 2b) to being preferentially concentrated towards the jet centreline within the first ~5 diameters of the inlet. For
 $S{t_D} = 11.2$, the radial profiles exhibit notable deviation from a Gaussian even at downstream distances of
 $x/{D_j} = 25.0$. These profiles show a steep decline with radial distance near the jet centreline followed by a long tail. In fact, these profiles resemble more the right half of a log-normal profile rather than a Gaussian profile. These findings indicate that the particle number density profile approaches a Gaussian at increasing axial distances as the inlet Stokes number increases, which is consistent with Lau & Nathan (Reference Lau and Nathan2016).
Measured and simulated radial profiles of the mean particle number density ( $\langle \varTheta \rangle $) at three different axial locations. Experimental data from Lau & Nathan (Reference Lau and Nathan2016).

Figure 7 presents the radial profiles of the particle-phase mean axial velocity ( $\langle {U_{p,x}}\rangle $) at
 $x/{D_j} = 5.0$, 10.0 and 30.0. As shown, the mean particle-phase velocity is reasonably reproduced by the PP-DNS, especially for the low Stokes number cases, i.e.
 $S{t_D} = 0.3$ and 1.4. However, for the high Stokes number case of
 $S{t_D} = 11.2$, the PP-DNS predicts slightly wider radial profiles of
 $\langle {U_{p,x}}\rangle $ near to the shear layer at
 $x/{D_j} = 5.0$ and 10.0. The slight overprediction of the particle-phase velocity spread may be attributed to the limitation of the point-particle method, as illustrated in Appendix A. The Stokes number based on the Kolmogorov scale is over 30 before
 $x/{D_j} = 10.0$, therefore, the point-particle assumption may not be strictly valid at
 $x/{D_j} = 5.0$ and 10.0 for the case of
 $S{t_D} = 11.2$. At
 $x/{D_j} = 30.0$, the numerical and experimental data exhibit better agreement for the case of
 $S{t_D} = 11.2$. This is consistent both with the quadratic decrease in Stokes number and with the decrease in volumetric loading with the axial distance, both of which will increase the validity of the point-particle approximation.
Radial profiles of the particle-phase mean axial velocity ( $\langle {U_{p,x}}\rangle $) at three different axial locations. Experimental data from Lau & Nathan (Reference Lau and Nathan2016).

Figure 8 presents the radial profiles of the particle-phase r.m.s. axial velocity at  $x/{D_j} = 5.0, 10.0$ and 30.0, respectively. As expected, the prediction of the r.m.s. velocity is in general less accurate than that of the mean velocity. For
 $S{t_D} = 0.3$, the relative error is in general less than 10 % at the two selected locations. The relative error increases with the inlet Stokes number, for
 $S{t_D} = 1.4$ and 11.2, the maximum relative errors at the selected locations are approximately 20 % and 35 %, respectively. For all three cases, the relative error in r.m.s. velocity at
 $x/{D_j} = 10.0$ is, in general, larger than that at
 $x/{D_j} = 30.0$. This again points to the limitation of the point-particle assumption.
Radial profiles of the particle-phase r.m.s. axial velocity at three different axial locations. Experimental data from Lau & Nathan (Reference Lau and Nathan2016).

Notwithstanding the potential role of the point-particle approximation, the synthesised inflow turbulence based on the Passot–Pouquet energy spectrum and Taylor's frozen turbulence hypothesis may also be a source of difference between the numerical simulation and the experimental measurement. Nevertheless, the error in the r.m.s.  ${U_{p,x}}$ is expected to have a minor impact on the rest of the analyses. Specifically, for the results presented in § 3.2, the first-order impact of particles on the gas-phase TKE is via the mean drag force determined by the gas- and particle-phase mean velocity, which is illustrated to be reasonably well reproduced, as shown in figure 7. In addition, the influence of the r.m.s.
 ${U_{p,x}}$ on the conditional mean velocity statistics, as well as the integral length scale, is also minor, therefore, the error in r.m.s.
 ${U_{p,x}}$ has a minor impact on the particle response presented in § 3.3. In general, the PP-DNS results provides a reasonable baseline for the subsequent analysis of turbulence–particle interactions in terms of turbulence modulation and particle response.
3.2. Modulation of turbulence
To investigate turbulence modulation, figure 9 presents the axial evolution of the mean slip velocity to illustrate the region where the particle phase lags or leads the gas phase. The mean slip velocity is computed as  $\langle {U_{slip,x}}\rangle = \langle {U_{g,x}}|\boldsymbol{x} = {\boldsymbol{x}_p}\rangle - \langle {U_{p,x}}\rangle $, where
 $\langle {U_{g,x}}|\boldsymbol{x} = {\boldsymbol{x}_p}\rangle $ represents the conditionally averaged gas-phase velocity at the particle location. Figure 9(a) presents the centreline slip velocity, which is positive in the near-field region. This is because the centreline mean velocity of the gas phase is slightly higher than that of the particle phase at the pipe exit, as a result of the dynamics of the particle-laden pipe flow (Lau & Nathan Reference Lau and Nathan2014, Reference Lau and Nathan2016). The positive slip velocity illustrates that the particle phase lags the gas phase in the near-field region. Downstream of the inlet plane, due to particle inertia, the particle-phase velocity decays at a lower rate than the gas phase. Therefore, the particle-phase velocity eventually exceeds the gas-phase velocity, resulting in a negative slip velocity further downstream. The slip velocity eventually approaches zero in the far field as the local Stokes number decreases, resulting in the particles more faithfully following the flow. Figure 9(b) presents the slip velocity at the location of the gas-phase velocity half-width, which is negative throughout the domain illustrating that, for all three particle-laden jets, the particle phase leads the gas phase at the velocity half-width location within the first
 $30{D_j}$ from the inlet. Both figure 9(a,b) illustrate that, in the region where the particle phase leads, the higher Stokes number case exhibits a greater (in magnitude) slip velocity due to the higher particle inertia. This results in a larger positive momentum transfer to the gas phase via
 $\langle {F_{p,x}}\rangle $ (see (2.2)), and therefore, a slower decay of the mean gas-phase velocity for the higher Stokes number cases.
Axial evolution of the slip velocity ( $\langle {U_{slip,x}}\rangle $) at the centreline (a) and the velocity half-width location (b). The inset is a zoom in plot for
 $0 < x/{D_j} < 2$.

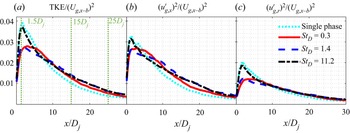
To quantify the modulation on turbulence due to the presence of the particle phase, figure 10(a) presents the axial evolution of the normalised gas-phase TKE ( $k = \langle {u^{\prime}_{g,i}}{u^{\prime}_{g,i}}\rangle /2$) at the velocity half-width location (
 ${R_{0.5{U_{g,x - c}}}}$) for the single-phase jet together with the particle-laden jet at all three Stokes numbers. Compared with the single-phase jet, the gas-phase TKE in the particle-laden jet is damped for
 $x < 5{D_j}$ for all three Stokes numbers. The low Stokes number cases, i.e.
 $S{t_D} = 0.3$ and 1.4, yield much more significant damping relative to
 $S{t_D} = 11.2$. Specifically,
 $S{t_D} = 0.3$ and 1.4 reduce the peak value of TKE by approximately 30 % compared with the single phase, while
 $S{t_D} = 11.2$ results in only minor damping of less than 5 %. In the intermediate region,
 $5{D_j} < x < 20{D_j}$, the gas-phase TKE in the particle-laden jet is greater than that of the single-phase jet for all Stokes numbers. The level of increase appears to be less dependent on the Stokes number, i.e. 15 %–25 % for all the three cases considered. The increase of the gas-phase TKE persists to the end of the computational domain as the presence of the particle phase slows down the decay of the gas-phase TKE owing to the higher particle inertia (see figure 14 for further discussion).
Axial variation of the normalised gas-phase TKE, variance of axial and radial velocities ( $\langle u^{\prime 2}_{g,x}\rangle $ and
 $\langle u^{\prime 2}_{g,r}\rangle $) at the velocity half-width location (
 ${R_{0.5{U_{g,x - c}}}}$), for the single-phase case and the particle-laden cases
 $S{t_D} = 0.3$, 1.4 and 11.2. The y-axis is normalised by the square of the inflow jet bulk velocity.

Figure 10(b,c) presents the normalised variance of the gas-phase velocity component in the axial and radial directions. For  $x < 5{D_j}$, the presence of the particle phase damps the fluctuating velocity in both the axial and radial directions, especially for low Stokes number cases. For example, the peak values of
 $\langle u^{\prime 2}_{g,r}\rangle $ and
 $\langle u^{\prime 2}_{g,x}\rangle$ for the
 $S{t_D} = 0.3$ and 1.4 cases are approximately 40 % and 20 % lower than the corresponding peak values for the single-phase case. The significant radial damping in this region (
 $x < 5{D_j}$) may be attributed to the reorganisation of the particle concentration towards a Gaussian-like profile (Lau & Nathan Reference Lau and Nathan2016), with this reorganisation being expected to occur at a greater rate for the two lower Stokes number cases due to the highly non-Gaussian initial particle distributions for these cases (see figure 5). In the intermediate region of
 $5{D_j} < x < 20{D_j}$, the presence of the particle phase increases both
 $\langle u^{\prime 2}_{g,x}\rangle $ and
 $\langle u^{\prime 2}_{g,r}\rangle $. However,
 $\langle u^{\prime 2}_{g,x}\rangle $ is increased more significantly. For all three particle-laden jets, the increase of
 $\langle u^{\prime 2}_{g,x}\rangle $ is around 35 %, which is notably larger than the 20 % increase for
 $\langle u^{\prime 2}_{g,r}\rangle $. The preferential increase of the gas-phase fluctuating velocity in the axial direction is consistent with the preferential axial response of the particle phase owing to the lower characteristic Stokes number in axial direction (see § 3.4 for detailed discussion). The increase of
 $\langle u^{\prime 2}_{g,x}\rangle $ and
 $\langle u^{\prime 2}_{g,r}\rangle $ persists to the end of the computational domain. As far as turbulence anisotropy is concerned, the single-phase jet exhibits significant anisotropy, as indicated by
 $\langle u^{\prime 2}_{g,x}\rangle /\langle u^{\prime 2}_{g,r}\rangle$ being larger than unity. Specifically, the ratio of
 $\langle u^{\prime 2}_{g,x}\rangle /\langle u^{\prime 2}_{g,r}\rangle $ at the velocity half-width location is ~1.4, which is consistent with previous single-phase experimental measurements (Hussein, Capp & George Reference Hussein, Capp and George1994). The presence of the particle phase causes the preferential damping of
 $\langle u^{\prime 2}_{g,r}\rangle $ in the near field and the preferential increase of
 $\langle u^{\prime 2}_{g,x}\rangle $ in the intermediate region which, therefore, results in an overall higher anisotropy than for the single-phase jet. For example, the anisotropy indicated by the ratio of
 $\langle u^{\prime 2}_{g,x}\rangle /\langle u^{\prime 2}_{g,r}\rangle $ at the velocity half-width location of
 $x = 20{D_j}$ is 1.6, 1.9 and 2.0 for
 $S{t_D} = 0.3$, 1.4 and 11.2, respectively.
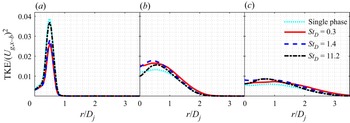
Given the strong spatial variation in the gas-phase TKE, figure 11 presents the normalised TKE radial at three representative locations corresponding to the near, intermediate and ‘far’ fields, i.e.  $x/{D_j} = 1.5$, 15.0 and 25.0, respectively. Note that previous work (Mi et al. Reference Mi, Nobes and Nathan2001) has shown that true similarity of the far field for both the mean and r.m.s. quantities for a single-phase jet is not reached until
 $x/{D_j} = 70$, although the equivalent data are not available for a two-phase jet. As shown, compared with the single-phase jet, the gas-phase TKE is in general damped in the near field of the particle-laden jets, especially for
 $S{t_D} = 0.3$ and 1.4, and then increased in the intermediate field, consistent with the results presented in figure 10. The increase of the gas-phase TKE persists to the end of the computational domain, for example, at
 $x/{D_j} = 25$, the increase in the magnitude of the peak TKE for
 $S{t_D} = 0.3$ is around 10 % of its single-phase counter part, while that for
 $S{t_D} = 1.4$ and 11.2 is more than 20 %.
Radial profiles of the normalised gas-phase TKE at  $x/{D_j} = 1.5$, 15.0 and 25.0, for the single-phase case and the particle-laden cases for
 $S{t_D} = 0.3$, 1.4 and 11.2. The TKE is normalised by the square of the inflow jet bulk velocity.

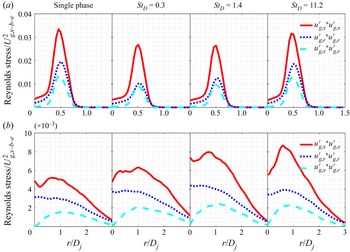
In addition to TKE, the radial profiles of Reynolds stress components,  $\langle {u^{\prime}_{g,x}}{u^{\prime}_{g,x}}\rangle $,
 $\langle {u^{\prime}_{g,r}}{u^{\prime}_{g,r}}\rangle $ and
 $\langle {u^{\prime}_{g,x}}{u^{\prime}_{g,r}}\rangle $, are presented to provide more details about the modulation of turbulence. Figure 12 presents the radial profiles of the gas-phase Reynolds stress components,
 $\langle {u^{\prime}_{g,x}}{u^{\prime}_{g,x}}\rangle $,
 $\langle {u^{\prime}_{g,r}}{u^{\prime}_{g,r}}\rangle$ and
 $\langle {u^{\prime}_{g,x}}{u^{\prime}_{g,r}}\rangle$ at
 $x/{D_j} = 1.5$ and 25. As can be observed, the variation of the Reynolds stress due to the presence of the particle phase strongly depends on the inlet Stokes number.
Radial profiles of the normalised Reynolds stresses, i.e.  $\langle {u^{\prime}_{g,x}}{u^{\prime}_{g,x}}\rangle $,
 $\langle {u^{\prime}_{g,r}}{u^{\prime}_{g,r}}\rangle $ and
 $\langle {u^{\prime}_{g,x}}{u^{\prime}_{g,r}}\rangle $ at
 $x/{D_j} = 1.5$ (a) and 25 (b), for the single-phase jet and the particle-laden jets
 $S{t_D} = 0.3$, 1.4 and 11.2. The y-axis is normalised by the square of the inflow jet bulk velocity.

The results at  $x/{D_j} = 1.5$ show that the profiles of the Reynolds stresses for all Stokes number cases, as well as the single-phase case, have a peak in the shear layer (
 $r/{D_j} = 0.5$), consistent with expectation. Furthermore, the three components of Reynolds stress in the particle-laden jets are lower than the single-phase jet. This illustrates that the presence of particles damps the Reynolds stresses, with the damping of
 $\langle {u^{\prime}_{g,r}}{u^{\prime}_{g,r}}\rangle $ is more significant than that of
 $\langle {u^{\prime}_{g,x}}{u^{\prime}_{g,x}}\rangle $ and
 $\langle {u^{\prime}_{g,x}}{u^{\prime}_{g,r}}\rangle $. Taking
 $S{t_D} = 1.4$ as an example, the peak values of
 $\langle {u^{\prime}_{g,x}}{u^{\prime}_{g,x}}\rangle $ and
 $\langle {u^{\prime}_{g,x}}{u^{\prime}_{g,r}}\rangle $ are 21 % and 26 % lower than the single-phase jet, respectively, while the peak value of
 $\langle {u^{\prime}_{g,r}}{u^{\prime}_{g,r}}\rangle $ is as much as 37 % lower than the single-phase jet. These findings are consistent with previously published experimental results, which showed that particles tend to preferentially respond to the axial fluctuations in the gas-phase velocity compared with the radial fluctuations (Lau & Nathan Reference Lau and Nathan2014). As the inlet Stokes number is increased, the three Reynolds stress components approach the corresponding ones in the single-phase jet, illustrating that larger particles have less impact on the gas-phase velocity in the near-field region. This is attributed to the decrease of the overall particle drag as the inlet Stokes number is increased (as later analysed in figure 13).
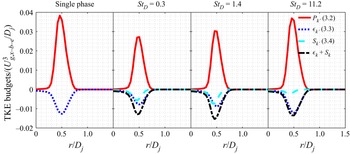
Radial profiles of the normalised TKE budgets at  $x/{D_j} = 1.5$, for the single-phase case and the particle-laden cases
 $S{t_D} = 0.3$, 1.4 and 11.2. The y-axis is normalised by a rate defined by the inflow jet bulk velocity and jet diameter (
 $U_{g,x - b - e}^3/{D_j}$).

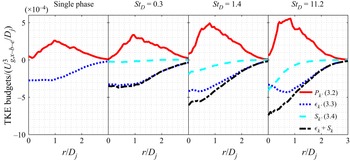
Radial profiles of the normalised TKE budgets at  $25.0{D_j}$, for the single-phase case and the particle-laden cases
 $S{t_D} = 0.3$, 1.4 and 11.2. The y-axis is normalised by a rate defined by the inflow jet bulk velocity and jet diameter (
 $U_{g,x - b - e}^3/{D_j}$).

At  $x/{D_j} = 25$, the three Reynolds stress components in the particle-laden jet are higher than those in the single-phase jet for all Stokes numbers. This is because the Reynolds stress decays more slowly in the particle-laden jet than the single-phase jet due to the greater inertia in the former. The peak magnitude of the Reynolds stress consistently increases with the inlet Stokes number, which is consistent with the later findings from figure 14. In addition, the increase of
 $\langle {u^{\prime}_{g,x}}{u^{\prime}_{g,x}}\rangle $ and
 $\langle {u^{\prime}_{g,x}}{u^{\prime}_{g,r}}\rangle $ is more significant than that of
 $\langle {u^{\prime}_{g,r}}{u^{\prime}_{g,r}}\rangle $. Taking
 $S{t_D} = 1.4$ as an example, the peak value of
 $\langle {u^{\prime}_{g,r}}{u^{\prime}_{g,r}}\rangle $ is 40 % higher than the single-phase jet, while the peak values of
 $\langle {u^{\prime}_{g,x}}{u^{\prime}_{g,x}}\rangle $ and
 $\langle {u^{\prime}_{g,x}}{u^{\prime}_{g,r}}\rangle $ are as much as 55 % and 50 % higher than the single-phase jet, respectively.
To better explain the modulation of turbulence by the presence of the particle phase, a budget analysis of TKE is carried out. The transport equation of the gas-phase TKE ( $k$) in particle-laden flows yields (Pope Reference Pope2000; Li et al. Reference Li, Luo, Wang, Xiao and Fan2019):
 \begin{equation}\frac{{\partial k}}{{\partial t}} ={-} \langle {U_{g,i}}\rangle \frac{{\partial k}}{{\partial {x_i}}} + {P_k} + {\epsilon _k} + {S_k} + {D_k},\end{equation}
where  ${P_k}$ represents the production term,
 ${\epsilon _k}$ represents the dissipation term and
 ${S_k}$ is a source term due to the presence of the particle phase. The other terms, i.e. turbulent convection, viscous diffusion and pressure transport are lumped to
 ${D_k}$,
 \begin{gather}{P_k} ={-} \langle {u^{\prime}_{g,i}}{u^{\prime}_{g,j}}\rangle \frac{{\partial \langle {U_{g,i}}\rangle }}{{\partial {x_j}}},\end{gather}
 \begin{gather}{\epsilon _k} ={-} 2{\nu _g}\langle {s^{\prime}_{g,ij}}{s^{\prime}_{g,ij}}\rangle ={-} {\nu _g}\left\langle {\frac{{\partial {{u^{\prime}}_{g,i}}}}{{\partial {x_j}}}\left( {\frac{{\partial {{u^{\prime}}_{g,i}}}}{{\partial {x_j}}} + \frac{{\partial {{u^{\prime}}_{g,j}}}}{{\partial {x_i}}}} \right)} \right\rangle ,\end{gather}
 \begin{gather}{S_k} = \langle {f^{\prime}_i}\,{u^{\prime}_{g,i}}\rangle ,\end{gather}
 \begin{gather}{D_k} ={-} \frac{1}{2}\frac{{\langle \partial {{u^{\prime}}_{g,j}}{{u^{\prime}}_{g,i}}{{u^{\prime}}_{g,i}}\rangle }}{{\partial {x_j}}} - \frac{1}{{{\rho _g}}}\frac{{\partial \langle {{p^{\prime}}_g}{{u^{\prime}}_{g,j}}\rangle }}{{\partial {x_j}}} + {\nu _g}\frac{{{\partial ^2}k}}{{\partial {x_j}\partial {x_j}}},\end{gather}
where  ${u^{\prime}_{g,i}}$ and
 ${f^{\prime}_i}$ represents fluctuating components of the velocity and the particle-induced force, while
 ${U_{g,i}}$ represents the total instantaneous gas-phase velocity component. Einstein notation is applied to the repeated indices. Note that the influence of the particle volume on the gas-phase TKE is neglected as the particle-phase volume fraction is negligibly low, i.e.
 ${\sim} {10^{ - 4}}$. The dissipation term (
 ${\epsilon _k}$) is computed as the dissipation rate based on the total instantaneous velocity (
 ${\boldsymbol{U}_g}$) minus the dissipation rate based on the mean velocity (
 $\langle {\boldsymbol{U}_g}\rangle $). The lumped diffusion term (
 ${D_k}$) is mostly responsible for spatially transferring TKE within the gas-phase itself, while not making a direct contribution to turbulence increase or reduction (Li et al. Reference Li, Luo, Wang, Xiao and Fan2019). In the following, the budget analysis mostly focuses on the source and sink terms, i.e.
 ${P_k}$,
 ${\epsilon _k}$ and
 ${S_k}$. As illustrated in (3.1), the gas-phase TKE is influenced by the particle phase directly via the source term
 ${S_k}$, and indirectly via
 ${P_k}$ and
 ${\epsilon _k}$ through the particles’ influence on the gas-phase velocity field.
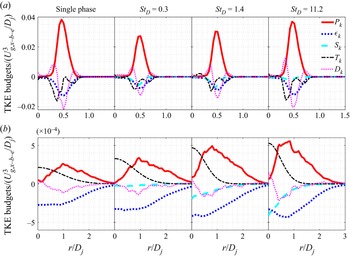
Figure 13 presents the radial profiles of the normalised TKE budget in the jet near field,  $x/{D_j} = 1.5$. As can be seen, the production and dissipation terms reach their peak magnitudes near to the shear layer region (
 ${\sim} r/{D_j} = 0.5$) for both the single-phase jet and the particle-laden jets. Compared with the single-phase jet, the presence of particles results in a notably reduced production term (
 ${P_k}$), especially for cases with small particles, i.e.
 $S{t_D} = 0.3$ and 1.4. This is because the presence of particles reduces the spatial gradient of the gas-phase mean velocity. More specifically, the gas velocity within the upstream pipe is lower than the particle phase in the near-wall region (
 $r/{D_j} > 0.4$), due to viscous drag from the pipe wall, but higher than the particle phase in the core of the jet. Once the particle-laden flow leaves the pipe, the particle phase retains a similar velocity due to its higher inertia. Therefore, in the near-field region, the particle phase lags the gas phase in the high-speed jet core, but leads it near to the low-speed jet edge, resulting in a decrease of the main component of the velocity gradient, i.e.
 $\partial \langle {U_{g,x}}\rangle /\partial r$, relative to the single phase, and thus to a decrease in
 ${P_k}$.
It can also be seen that the peak magnitudes of  ${P_k}$ and
 ${\epsilon _k}$ are notably reduced for the low Stokes number cases of
 $S{t_D} = 0.3$ and 1.4, but almost unchanged for the highest Stokes number case (
 $S{t_D} = 11.2$). The stronger reduction of
 ${P_k}$ and
 ${\epsilon _k}$ by the smaller particles can be qualitatively explained by calculating the magnitude of the particle drag force (
 ${\boldsymbol{F}_p}$). By definition,
 $|{{\boldsymbol{F}_p}} |\; \sim \; m_p^0 \times {\varTheta _b}/{\tau _p} \times |{{\boldsymbol{U}_{slip}}} |\times {\varTheta ^\mathrm{\ast }}$, where
 $|{{\boldsymbol{U}_{slip}}} |$ is the magnitude of the local slip velocity and
 ${\varTheta ^\mathrm{\ast }}$ is the local particle number density normalised by the bulk number density (
 ${\varTheta _b}$). The product of the first three terms scales as
 $1/d_p^2$, so that
 $|{{\boldsymbol{F}_p}} |\sim|{{\boldsymbol{U}_{slip}}} |\times {\varTheta ^\mathrm{\ast }}/d_p^2$. At the location of
 $x/{D_j} = 1.5$ and
 $r/{D_j} = 0.5$, even though
 $S{t_D} = 11.2$ has a value of
 $|{{\boldsymbol{U}_{slip}}} |$ that is some 15 times greater than for
 $S{t_D} = 0.3$, this is more than offset by the fortyfold increase in
 $d_p^2$. Moreover,
 $S{t_D} = 0.3$ has a value of
 ${\varTheta ^\mathrm{\ast }}$ which is 2.5 times greater than for
 $S{t_D} = 11.2$. Combining all these,
 $|{{\boldsymbol{F}_p}} |$ for
 $S{t_D} = 0.3$ is around 6 times higher than for
 $S{t_D} = 11.2$ in the near field, which explains why smaller particles have a stronger impact on the gas-phase velocity in the near-field region and thus also a stronger reduction of
 ${P_k}$ and
 ${\epsilon _k}$.
The particle-induced source term ( ${S_k}$) is negative for all three particle-laden cases, indicating that the direct impact of the particle phase is to dissipate the gas-phase TKE. The previous analysis also applies here to explain that the magnitude of
 ${S_k}$ for
 $S{t_D} = 11.2$ is much smaller than that for
 $S{t_D} = 0.3$ and 1.4. It is worth noting that, for the low Stokes number cases
 $S{t_D}$=0.3 and 1.4, the magnitude of
 ${S_k}$ is comparable to that of the dissipation term (
 ${\epsilon _k}$), illustrating that the particles under these conditions play an important role in dissipating TKE. That is, in addition to the reduction of
 ${\epsilon _k}$ due to the presence of the particle phase, further dissipation of similar order is provided through
 ${S_k}$. Nevertheless, the total dissipation, i.e.
 ${\epsilon _k} + {S_k}$ is approximately the same as that of
 ${\epsilon _k}$ for the single-phase jet. Meanwhile, the production term is reduced in particle-laden jets due to the decrease of the mean velocity gradient. Therefore, the reduction of the near-field TKE in particle-laden jets is mostly due to the reduction of the overall production, rather than the increase of the total dissipation. Furthermore, the level of reduction for
 ${P_k}$ increases monotonically as the inlet Stokes number is reduced. This explains why
 $S{t_D} = 0.3$ yields the most significant damping, while
 $S{t_D} = 11.2$ yields the least damping for gas-phase TKE in the near field. Note that figure 13 only presents the source terms, i.e.
 ${P_k}$,
 ${\epsilon _k}$ and
 ${S_k}$ for clarity, and this results in obviously imbalanced TKE budgets. Figure 25 in Appendix B presents the balanced TKE budgets by including the lumped diffusion term (
 $D_k$) and the transport term due to mean convection.
Figure 14 presents the radial profiles of the normalised TKE budget at the downstream location of  $x/{D_j} = 25$. For the single-phase jet, the production term reaches its peak magnitude near to the shear layer, while the dissipation term exhibits a flat profile from the centreline to the shear layer region, consistent with previous measurements in a turbulent single-phase jet (Hussein et al. Reference Hussein, Capp and George1994). Compared with the single-phase case, the peak magnitudes of
 ${P_k}$ and
 ${\epsilon _k}$ are increased in particle-laden jets. This is because the particle phase leads the gas phase downstream of
 $25\; {D_j}$ (see figure 9), increasing the momentum of the gas phase. The positive momentum transfer slows down the decay of the gas-phase velocity and its gradients. This, then, results in greater values of
 ${P_k}$ and
 ${\epsilon _k}$ at a given downstream location than for the single-phase case. Since the higher Stokes number case yields a slower decay of both the gas-phase velocity and its gradients, owing to the higher particle inertia, this explains the consistent increase in the peak magnitudes of
 ${P_k}$ and
 ${\epsilon _k}$ with the inlet Stokes number.
The particle-induced source term ( ${S_k}$) remains negative at
 $25{D_j}$ for all three particle-laden cases. It is worth noting that the particle phase leads the gas phase at
 $25{D_j}$, as illustrated by the negative mean slip velocity shown in figure 9. However,
 ${S_k}$ remains negative. This seemingly counterintuitive finding is because the mean slip velocity determines the mean quantities, e.g. mean drag and mean kinetic energy, but not the fluctuating quantities such as
 ${S_k}$, which is defined as the product of fluctuating drag and fluctuating gas-phase velocity (
 ${S_k} = \langle {f^{\prime}_i}{u^{\prime}_{g,i}}\rangle $). By its definition, there is not a one-to-one correspondence between the sign of the mean slip velocity and the sign of
 ${S_k}$. The negative
 ${S_k}$ illustrates that the particle phase continues to play a role in dissipating gas-phase TKE. This confirms that there is no positive TKE transfer from the particle to the gas phase. Instead, the increase of the intermediate-field TKE in particle-laden jets also results mostly from the slower decay of the gas-phase velocity. As discussed above, a higher Stokes number case maintains the axial momentum of the gas phase for a longer distance which, in turn, results in the
 $S{t_D} = 11.2$ case yielding the most prominent increase, while the
 $S{t_D} = 0.3$ case yields the least increase for the gas-phase TKE in the intermediate field.
3.3. Direction-dependent response of the particle phase
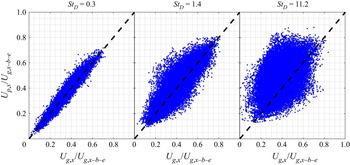
Figure 15 presents scatter plots of the instantaneous axial particle-phase velocity as a function of the gas-phase velocity at the corresponding particle location. Data are reported at the velocity half-width location ( $r = {R_{0.5{U_{g,x - c}}}}$) at
 $x/{D_j} = 15$. Also drawn is a reference line of
 ${U_{p,x}} = {U_{g,x}}$, representing the perfect response of particles to the flow field. As expected, particles of
 $S{t_D} = 0.3$ and
 $S{t_D} = 1.4$ exhibit notably stronger response than those of
 $S{t_D} = 11.2$. It can be seen that the data are skewed, with the particle phase tending to lead the gas phase, which is expected to occur at the velocity half-width location throughout the computational domain (see figure 9). Furthermore, the skewness increases with
 $S{t_D}$.
Scatter of the instantaneous particle velocity versus the gas velocity at the corresponding particle location. Samples were taken at the velocity half-width location at  $x/{D_j} = 15$, with a sampling region of
 $0.2{D_j}$ and
 $0.5{D_j}$ in the r and x directions, respectively.

The probability density function (PDF) of the  ${U_{p,x}}/{U_{g,x}}$ is shown in figure 16. Data are reported at the velocity half-width locations at
 $x/{D_j} = 5.0$, 15.0 and 25.0. Consistent with the findings from figure 15, the PDF in
 $S{t_D} = 0.3$ is very narrow, with values close to 1.0, while the PDF becomes boarder with an increase in the Stokes number given an axial distance, consistent with the fact that the particle response increases as the Stokes number is reduced. The trend in skewness observed in figure 15 is better illustrated here. Specifically, the distribution of
 ${U_{p,x}}/{U_{g,x}}$ is skewed to the side greater than unity. This can be explained by figure 9, in which the particle phase is shown to lead the gas phase in the intermediate-field region owing to the higher particle inertia there, resulting in a large number of samples having
 ${U_{p,x}}/{U_{g,x}}$ greater than unity. Since larger particles have higher inertia, this explains why the distribution of
 ${U_{p,x}}/{U_{g,x}}$ is more skewed in the particle-laden jet with higher inlet Stokes number. The skewness reduces with downstream distance following the corresponding decrease in local Stokes number.
Probability density function of the ratio  ${U_{p,x}}/{U_{g,x}}$. Samples were taken at the velocity half-width location at
 $x/{D_j} = 15$, with a sampling region of 0.2
 $D_j$ and 0.5
 $D_j$ in the r and x directions, respectively.

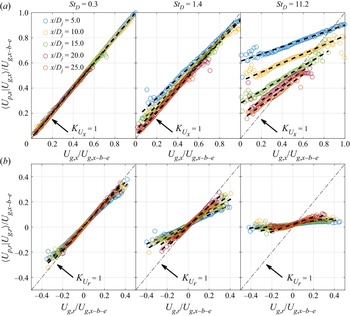
To quantify the level of particle response, the conditionally averaged particle velocity ( $\langle {U_{p,i}}|{U_{g,i}}\rangle $) is plotted as a function of the gas velocity at the particle location for a series of axial distances and at radial locations corresponding to the velocity half-width. To compute
 $\langle {U_{p,i}}|{U_{g,i}}\rangle $ numerically,
 ${U_{g,i}}$ is divided into 100 bins, and the ensemble average of
 ${U_{p,i}}$ is calculated within each bin. A perfect particle response would result in
 $\langle {U_{p,i}}|{U_{g,i}}\rangle = {U_{g,i}}$. In figure 17(a),
 $\langle {U_{p,x}}|{U_{g,x}}\rangle $ is plotted against
 ${U_{g,x}}$ to present the particle response in the axial direction, while in figure 17(b),
 $\langle {U_{p,r}}|{U_{g,r}}\rangle $ is plotted against
 ${U_{g,r}}$ to present the particle response in the radial direction. The linear regression for each direction was also calculated, such that the slope, i.e.
 ${K_{{U_x}}} = \arg {\min _K}\parallel K{U_{g,x}} + {b_x} - \langle {U_{p,x}}|{U_{g,x}}\rangle {\parallel _2}$ or
 ${K_{{U_r}}} = \arg {\min _K}\parallel K{U_{g,r}} + {b_r} - \langle {U_{p,r}}|{U_{g,r}}\rangle {\parallel _2}$, measures how strongly the particle-phase velocity is correlated to the gas-phase velocity in the corresponding direction, with a value of unity meaning perfect correlation, and a value of zero meaning no correlation. It can be seen that both the axial and radial particle responses increase consistently with the axial distance, as indicated by the observation that
 ${K_{{U_x}}}$ and
 ${K_{{U_r}}}$ approach unity. This is expected because the local Stokes number decreases with the square of axial distance.
Conditionally averaged particle velocity as a function of gas velocity at the corresponding particle location for a series of axial distances and at radial locations corresponding to the velocity half-width (where the sampling region is 0.2 $D_j$ and 0.5
 $D_j$ in the r and x directions, respectively). (a) Axial velocity component; (b) radial velocity component. The dashed black lines are linear fits of the data. The dot-dashed lines represent the reference of unity slope.

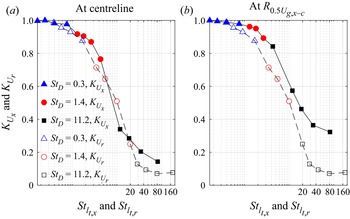
Figure 18 presents the axial variation of the dimensionless particle response indicated by  ${K_{{U_x}}}$ and
 ${K_{{U_r}}}$. Figure 18(a) presents the values of
 ${K_{{U_x}}}$ and
 ${K_{{U_r}}}$ obtained at the velocity half-width location for the three particle-laden jets. As can be observed, for a given axial distance, the values of
 ${K_{{U_x}}}$ and
 ${K_{{U_r}}}$ approach unity with a decrease in the values of the inlet Stokes number. Moreover,
 ${K_{{U_x}}}$ and
 ${K_{{U_r}}}$ both increase with axial distance, which is as expected given that the local Stokes number decreases with
 ${x^{ - 2}}$. Furthermore,
 ${K_{{U_x}}}$ is closer to unity than
 ${K_{{U_r}}}$ for a given axial distance in all three particle-laden jets, illustrating the direction-dependent response of particles to the axial gas-phase velocity component in comparison with the radial component. For example, for
 $S{t_D} = 0.3$,
 ${m_x}$ exceeds 0.95 as near to the inlet plane as
 $x/{D_j} = 5$, indicating a close response to the axial gas-phase velocity. However,
 ${K_{{U_r}}}$ is only 0.8 at the same axial distance (
 $x/{D_j} = 5$), and only exceeds 0.95 for
 $x > 20{D_j}$. Interestingly, the value of
 ${K_{{U_r}}}$ is as low as ~0.07 in the near field for the case where
 $S{t_D} = 11.2$. This implies that the particles have a near-zero correlation to the radial gas velocities near the inlet, particularly for large Stokes numbers.
Axial variation of the particle response, as indicated by  ${K_{{U_x}}}$ and
 ${K_{{U_r}}}$. Samples taken from (a) the velocity half-width; and (b) the centreline.

Figure 18(b) presents the corresponding results sampled along the centreline as for those presented along the half-width in figure 18(a). Comparing these figures shows that some differences in the particle response, as indicated by  ${K_{{U_x}}}$ and
 ${K_{{U_r}}}$, occur for the two radial locations. This is as expected since the particle response depends on the characteristic flow time scale and the local particle concentration, both of which vary radially. However, the key conclusions remain the same, i.e. the particle response improves with an increase in axial distance and a decrease in Stokes number, with the particle phase preferentially responding more to the axial velocity than the radial velocity. The preferential axial response implies a larger characteristic time scale of the gas-phase flow field in the axial direction than in the radial direction (Lau & Nathan Reference Lau and Nathan2016), which results in a smaller characteristic Stokes number in the axial direction.
To compute the characteristic Stokes number in the axial and radial directions ( $S{t_{{l_{t,x}}}}$ and
 $S{t_{{l_{t,r}}}}$), the characteristic flow time scale in these two directions is defined based on the axial and radial integral length scales, respectively, i.e.
 $S{t_{{l_{t,x}}}}(x) = {\tau _p}/({l_{t,x}}(x,0)/\langle {U_{g,x - c}}(x)\rangle )$ and
 $S{t_{{l_{t,r}}}}(x) = {\tau _p}/({l_{t,r}}(x,0)/\langle {U_{g,x - c}}(x)\rangle )$, where
 ${l_{t,x}}(x,0)$ and
 ${l_{t,r}}(x,0)$ represent the axial and radial integral length scales on the centreline, and
 $\langle {U_{g,x - c}}(x)\rangle $ is the centreline mean axial velocity. The integral length scale is computed by integrating the velocity auto-correlation function, i.e.
 ${l_{t,x}}(x,r) = \int_0^\infty {{R_{11}}(\mathrm{\Delta }x;x,r)(\mathrm{d\Delta }x)} $ and
 ${l_{t,r}}(x,r) = \int_0^\infty {{R_{12}}(\mathrm{\Delta }r;x,r)(\mathrm{d\Delta }r)} $. Following the definition of the velocity auto-correlation function (Pope Reference Pope2000),
 ${R_{11}}(\mathrm{\Delta }x;x,r)$ and
 ${R_{12}}(\mathrm{\Delta }r;x,r)$ are computed as
 \begin{gather}{R_{11}}(\mathrm{\Delta }x;x,r) = \langle {u^{\prime}_{g,x}}(x + \mathrm{\Delta }x,r){u^{\prime}_{g,x}}(x,r)\rangle /\langle {u^{\prime}_{g,x}}(x,r){u^{\prime}_{g,x}}(x,r)\rangle ,\end{gather}
 \begin{gather}{R_{12}}(\mathrm{\Delta }r;x,r) = \langle {u^{\prime}_{g,x}}(x,r + \mathrm{\Delta }r){u^{\prime}_{g,x}}(x,r)\rangle /\langle {u^{\prime}_{g,x}}(x,r){u^{\prime}_{g,x}}(x,r)\rangle ,\end{gather}
where  ${u^{\prime}_{g,x}}(x,r)$ is the gas-phase fluctuating axial velocity at the location
 $(x,r)$. Figure 19 presents the velocity auto-correlation functions on the centreline at
 $x/{D_j} = 20.0$, i.e.
 ${R_{11}}(\mathrm{\Delta }x;20{D_j},0)$ and
 ${R_{12}}(\mathrm{\Delta }r;20{D_j},0)$. It is known that statistical error can pollute auto-correlation functions at large separation distances, which prevents the accurate calculation of the integral length scale where integration to infinity is used. Therefore, exponential fits were employed for the raw data following previous work (Bewley, Chang & Bodenschatz Reference Bewley, Chang and Bodenschatz2012). As can be seen,
 $S{t_D} = 0.3$ yields a slightly broader distribution of
 ${R_{11}}$, while
 $S{t_D} = 1.4$ and 11.2 yield notably narrower
 ${R_{11}}$ than for the single-phase jet. Specifically,
 ${R_{11}}$ drops to below 0.1 for
 $\mathrm{\Delta }x/{D_j} > 1.7$, 1.9, 0.74, and 0.92 in the single-phase jet and the particle-laden jet with
 $S{t_D} = 0.3$, 1.4 and 11.2, respectively. The same trend is observed for
 ${R_{12}}$. Furthermore,
 ${R_{12}}$ is notably narrower than
 ${R_{11}}$, with the former dropping to below 0.1 for
 $\mathrm{\Delta }r/{D_j} > 0.54$, 0.72, 0.32, and 0.34 in single-phase jet and particle-laden jets with
 $S{t_D} = 0.3$, 1.4 and 11.2, respectively. The narrower
 ${R_{12}}$ compared with
 ${R_{11}}$, implies that the integral length scale in radial direction (
 ${l_{t,r}}$) is smaller than its axial counterpart (
 ${l_{t,x}}$). This is illustrated further in figure 20.
Log-normal fitted velocity auto-correlation functions on centreline at  $x/{D_j} = 20.0$, where markers represent the raw data and lines represent the exponential fit: (a)
 ${R_{11}}(\mathrm{\Delta }x;20{D_j},0)$; (b)
 ${R_{12}}(\mathrm{\Delta }r;20{D_j},0)$.

Axial variations of three measures of the centreline integral length scale: (a) axial integral length scale ( ${l_{t,x}}$); (b) radial integral length scale (
 ${l_{t,r}}$); (c) ratio of
 ${l_{t,r}}/{l_{t,x}}$.

Figure 20(a,b) presents the axial evolution of the centreline integral length scales in the axial and radial directions, respectively, i.e.  ${l_{t,x}}(x,0)$ and
 ${l_{t,r}}(x,0)$. Since
 ${l_{t,x}}$ and
 ${l_{t,r}}$ are determined from the integration of a two-point correlation function, its statistical convergence requires many more sample points than do single-point quantities. Although the results presented in figure 20 have not reached full statistical convergence, the convergence in figure 20(a,b) is sufficient to show that
 ${l_{t,x}}$ is larger than the corresponding
 ${l_{t,r}}$ throughout the entire domain. Furthermore, the particle-laden case with
 $S{t_D} = 0.3$ generally follows that of the single-phase jet, while the cases of
 $S{t_D} = 1.4$ and 11.2 exhibit notably different profiles at
 $15.0 < x/{D_j} < 25.0$ compared with their single-phase counterpart. Moreover, figure 20(c) shows that the ratio of
 ${l_{t,r}}/{l_{t,x}}$ is mostly below 0.5 at all selected locations. The larger integral length scale in the axial direction results in a smaller characteristic Stokes number in the axial direction compared with that in the radial direction. As an indicator of isotropy,
 ${l_{t,r}}/{l_{t,x}} = 0.5$ corresponds to isotropic turbulence (Pope Reference Pope2000). Due to the anisotropic nature of the shear-driven turbulence in a turbulent jet,
 ${l_{t,r}}/{l_{t,x}}$ is mostly below 0.5.
Figure 21 presents the axial variation of the local Stokes numbers based on the integral scale in the axial and radial directions, i.e.  $S{t_{{l_{t,x}}}}$ and
 $S{t_{{l_{t,r}}}}$, respectively. The dashed lines are quadratic functions to show that
 $S{t_{{l_{t,x}}}}$ and
 $S{t_{{l_{t,r}}}}$ reduce quadratically with axial distance. As a result of the larger integral length scale in the axial direction,
 $S{t_{{l_{t,x}}}}$ is in general less than half that of the corresponding
 $S{t_{{l_{t,r}}}}$. This explains the preferential particle response in the axial direction.
Axial variation of the characteristic local Stokes number based on the integral scale in the axial and radial directions,  $S{t_{{l_{t,x}}}}$ and
 $S{t_{{l_{t,r}}}}$: (a)
 $S{t_D} = 0.3$ and 1.4; (b)
 $S{t_D} = 11.2$.

Figure 22 combines the results of all three Stokes number cases and presents the particle response indicated by  ${K_{{U_x}}}$ and
 ${K_{{U_r}}}$ as a function of the axial and radial Stokes numbers (
 $S{t_{{l_{t,x}}}}$ and
 $S{t_{{l_{t,r}}}}$), respectively. Specifically, figure 22(a,b) presents the
 ${K_{{U_x}}}$ and
 ${K_{{U_r}}}$ computed from particles at the centreline and velocity half-width locations, respectively. As can be seen, the two profiles of
 ${K_{{U_x}}}$ versus
 $S{t_{{l_{t,x}}}}$ and of
 ${K_{{U_r}}}$ versus
 $S{t_{{l_{t,r}}}}$ collapse reasonably well, especially for local Stokes numbers less than 20. This illustrates that the current definitions of
 $S{t_{{l_{t,x}}}}$ and
 $S{t_{{l_{t,r}}}}$ qualitatively describe the particle response in the sense that the particle phase would exhibit a similar level of response in the axial and radial directions given the same
 $S{t_{{l_{t,x}}}}$ and
 $S{t_{{l_{t,r}}}}$, i.e. the particle response itself is independent of the direction, and the differences in particle behaviour are attributable to differences in the fluid time scale in the axial and radial directions. Nevertheless, despite the use of these directional Stokes numbers,
 ${K_{{U_x}}}$ still has greater values than
 ${K_{{U_r}}}$, particularly at high Stokes numbers, implying that the directional Stokes numbers used here do not fully capture the anisotropy in the flow. This implies that the particle response as indicated by
 ${K_{{U_x}}}$ and
 ${K_{{U_r}}}$ depends on additional parameters to the local flow time and length scales, such as the local mass loading and the history of particle–fluid interaction. Additionally, it should also be noted that, in a turbulent jet, a range of turbulence scales are present at any given location within the flow. Therefore, while the local Stokes number is one measure of the particle response, it is necessary to incorporate additional parameters to fully characterise the particle response.
Particle response indicated by  ${K_{{U_x}}}$ and
 ${K_{{U_r}}}$ as a function of
 $S{t_{{l_{t,x}}}}$ and
 $S{t_{{l_{t,r}}}}$, respectively. Samples taken from (a) the centreline; and (b) the velocity half-width location.

4. Conclusions
Point-particle DNSs have been carried out for the Adelaide particle-laden round jet, which is in the two-way coupled regime with a jet Reynolds number of the order of 10 000. A particle injection method is proposed such that the inflow conditions of the jet in terms of particle number density and velocity match the experimental measurements. The investigation focussed on three cases with inlet Stokes numbers of 0.3, 1.4 and 11.2. The particle reorganisation in the near field, as well as the spatial distribution of the mean particle number density, the mean and r.m.s. particle velocity, are reasonably well reproduced by simulations, although some significant differences persist. Nevertheless, the agreement is sufficient for the subsequent analysis on turbulence modulation and particle response based on the simulation results.
The extent of turbulence modulation is quantified by the gas-phase TKE. Compared with the single-phase jet, the gas-phase TKE is generally damped in the near field ( $x < 5{D_j}$) of these particle-laden jets, especially for
 $S{t_D} = 0.3$ and 1.4, and then increases in the intermediate field (
 $5{D_j} < x < 20{D_j}$). The increase of the gas-phase TKE persists to the end of the computational domain, i.e.
 $30{D_j}$. The presence of the particle phase causes the preferential damping of
 $\langle u^{\prime 2}_{g,r}\rangle $ in the near field and the preferential increase in
 $\langle u^{\prime 2}_{g,x}\rangle $ within the intermediate field, resulting in an overall higher anisotropy than the single-phase jet.
A budget analysis of the production ( ${P_k}$), dissipation (
 ${\epsilon _k}$) and particle-induced source (
 ${S_k}$) terms of the gas-phase TKE was also carried out. Upstream from
 $1.5{D_j}$, the peak magnitudes of
 ${P_k}$ and
 ${\epsilon _k}$ are reduced in particle-laden jets compared with the single-phase jet. This is explained by the reduced gradient of the gas-phase velocity in the near field, where the particle phase lags the gas phase in the high-speed core but leads the gas phase in the low-speed jet edge due to its higher inertia. Despite a reduction in gas-phase dissipation of kinetic energy,
 ${\epsilon _k}$, by the presence of the particle phase, the particles introduce an additional dissipation term,
 ${S_k}$, so that the total dissipation, i.e.
 ${\epsilon _k} + {S_k}$, is of a similar magnitude to
 ${\epsilon _k}$ for the single-phase jet. However,
 ${P_k}$ is reduced in the particle-laden jets relative to the single-phase counterpart due to the decrease of the mean velocity gradient. Therefore, the reduced near-field TKE in the particle-laden jets is attributable mostly to the reduction of the overall production, rather than to any increase of the total dissipation. Downstream of
 $25{D_j}$, the particle-laden jets exhibit greater values of
 ${P_k}$ and
 ${\epsilon _k}$ than does the single-phase jet. This is because the particle phase leads the gas phase here owing to the greater particle inertia, which transfers momentum to the gas phase, reducing the decay of the gas-phase velocity and its gradients. The particle-induced source term remains negative, confirming that there is no direct injection of TKE from the particle phase but, instead, the increase in the far-field TKE in particle-laden jets results mostly from the reduced velocity decay of the gas phase.
The correlation between the particle-phase velocity and the gas-phase velocity, i.e. the particle response, was quantified by calculating the slope of the linear regressions of  $\langle {U_{p,x}}|{U_{g,x}}\rangle $ as a function of
 ${U_{g,x}}$ and of
 $\langle {U_{p,r}}|{U_{g,r}}\rangle $ as a function of
 ${U_{g,r}}$, i.e.
 ${K_{{U_x}}}$ and
 ${K_{{U_r}}}$, where a value of unity implies perfect correlation, and a value of zero implies no correlation. It is found that
 ${K_{{U_x}}}$ and
 ${K_{{U_r}}}$ approach unity as the axial distance increases, which is as expected given that the local Stokes number decreases with
 ${x^{ - 2}}$. More interestingly, particles exhibit a significantly stronger response to the gas-phase velocity in the axial direction than in the radial direction. To explain this, the characteristic Stokes number in the axial and radial directions, i.e.
 $S{t_{{l_{t,x}}}}$ and
 $S{t_{{l_{t,r}}}}$, is defined based on the centreline integral length scale in the corresponding directions (
 ${l_{t,x}}$ and
 ${l_{t,r}}$) and the centreline mean velocity (
 $\langle {U_{g,x - c}}\rangle $). The ratio of
 ${l_{t,r}}$ to
 ${l_{t,x}}$ was found to be mostly below 0.5 due to the anisotropic nature of the shear-driven turbulence. The greater value of
 ${l_{t,x}}$ leads to a smaller value of
 $S{t_{{l_{t,x}}}}$ than for
 $S{t_{{l_{t,r}}}}$, which explains the preferential particle response to the axial gas-phase velocity component.
A new dimensionless figure is presented that collapses the local normalised particle response as a function of the local Stokes number based on the integral length scale. Both the axial and radial components of the normalised particle response, as indicated by  ${K_{{U_x}}}$ and
 ${K_{{U_r}}}$, collapse reasonably well with their respective local Stokes number, i.e.
 $S{t_{{l_{t,x}}}}$ and
 $S{t_{{l_{t,r}}}}$. This provides a new qualitative measure of the particle response in a sense that the particle phase would exhibit a similar level of response in the axial and radial directions given the same
 $S{t_{{l_{t,x}}}}$ and
 $S{t_{{l_{t,r}}}}$, i.e. the particle response itself is independent of the direction, and the differences in particle behaviour are attributable to differences in the fluid time scale in the axial and radial directions.
Funding
The authors are pleased to acknowledge the financial contributions of the Australian government through the Australian Renewable Energy Agency (grant no. 2015/RND054). Computational resources were provided via the National Computational Infrastructure (NCI) and the Pawsey Supercomputing Centre, which are supported by the Australian Government. These resources were provided under the auspices of the National Computational Merit Allocation Scheme, and via Intersect Australia Pty, Ltd.
Declaration of interests
The authors report no conflict of interest.
Appendix A. Self-similarity
New data are presented of the self-similarity of the gas-phase quantities in particle-laden jets. These complement previous experimental work on particle-laden jets (Lau & Nathan Reference Lau and Nathan2014, Reference Lau and Nathan2016), and on the self-similar behaviour of the particle-phase quantities. The axial variation of the mean centreline gas-phase velocity ( $\langle {U_{g,x - c - e}}\rangle /\langle {U_{g,x - c}}\rangle$) and the half-width of the gas-phase mean velocity (
 ${R_{0.5{U_{g,x - c}}}}/{D_j}$) are presented in figure 23. As can be seen, all three cases exhibit an approximately linear decay of the centreline velocity and a linear spread of the velocity half-width between approximately
 $15{D_j}$ and
 $30{D_j}$. Both the velocity decay and the jet spreading rates decrease consistently with an increase in the inlet Stokes number from 0.3 to 11.2, consistent with previous measurements of the particle phase (Lau & Nathan Reference Lau and Nathan2014, Reference Lau and Nathan2016). For
 $S{t_D} = 0.3$, 1.4 and 11.2, the coefficients of velocity decay (
 ${K_1}$) are 8.12, 8.88 and 12.48, respectively, while the coefficients of jet spreading (
 ${K_2}$) are 0.081, 0.073 and 0.051, respectively. Note that the equivalent values reported in single-phase jets (Bogusławski & Popiel Reference Bogusławski and Popiel1979; Xu & Antonia Reference Xu and Antonia2002) are
 ${K_1} \in [5.90,6.50]$ and
 ${K_2} \in [0.070,0.086]$. Therefore, compared with a single-phase jet, the presence of the particle phase causes a greater change in
 ${K_1}$ than in
 ${K_2}$, implying that the presence of the particle phase has less influence on the gas-phase spreading rate than on the decay rate.
Axial profiles of (a) gas-phase mean axial velocity on the centreline ( $\langle {U_{g,x - c}}\rangle $); and (b) half-width based on gas-phase mean axial velocity (
 ${R_{0.5{U_{g,x - c}}}}$). Dotted cyan: linear fits.

Figure 24(a,b) presents the corresponding axial evolution of the local Stokes number, which is defined as  $S{t_L} = {\tau _p}/{\tau _{g,L}} = ({\rho _p}d_p^2/(18{\nu _g}{\rho _g}))/(2{R_{0.5{U_{g,x - c}}}}/\langle {U_{g,x - c}}\rangle )$. Since
 $\langle {U_{g,x - c}}\rangle$ decays approximately linearly with 1/x, while
 ${R_{0.5{U_{g,x - c}}}}$ spreads approximately linearly with x, the local Stokes number decays quadratically with the axial distance, as illustrated by the quadratic fits in figure 24(a,b). For
 $S{t_D} = 0.3$, the local Stokes number decreases from 0.38 at the inlet to 0.03 at
 $30{D_j}$, while for
 $S{t_D} = 1.4$,
 $S{t_L}$ decreases from 1.80 at the inlet to 0.15 at
 $30{D_j}$. For
 $S{t_D} = 11.2$,
 $S{t_L}$ decreases from 14.2 at the inlet and remains greater than unity throughout the computational domain. Figure 24(c,d) presents the axial evolution of the centreline Stokes number based on the Kolmogorov scale (
 $\; S{t_\eta } = {\tau _p}/{\tau _\eta }$, where
 ${\tau _\eta }$ is the local Kolmogorov scale of the gas phase). As shown,
 $S{t_\eta }$ exhibits some non-monotonic variation within the first 10
 ${D_j}$ from the inlet, and there is no simple correlation between
 $S{t_\eta }$ and
 $S{t_L}$ in this region. Over the range of
 ${D_j}$,
 $S{t_\eta }$ also exhibits quadratic decay with the axial distance. The quadratic decay of
 $S{t_\eta }$ is as expected because a scaling analysis yields
 $S{t_\eta }/S{t_L} \propto Re_D^{0.5}$ (Casciola et al. Reference Casciola, Gualtieri, Picano, Sardina and Troiani2010), while
 $S{t_L} \propto {x^{ - 2}}$.
Axial variation of the local Stokes number ( $S{t_L}$) and Stokes number based on the Kolmogorov scale (
 $S{t_\eta }$): (a,c)
 $S{t_D} = 0.3$ and 1.4; (b,d)
 $S{t_D} = 11.2$. Dotted cyan: quadratic fits.

It is worth noting that, in a particle-laden jet, as the local Stokes number is spatially varying, the mean and r.m.s. quantities only approach the self-similar state in the far field where the local Stokes number approaches zero such that the particle-laden jet behaves like a single-phase jet. Moreover, for the particle-laden jets considered in this work, the presence of the co-flow further hinders true self-similarity being achieved, as true self-similarity only occurs for a jet issuing into a stationary medium. Therefore, it is important to appreciate that the results shown above only present a quasi-self-similar behaviour.
Appendix B. Gas-phase TKE budgets
Figure 25 presents the full gas-phase TKE budgets at  $x/{D_j} = 1.5$ and 25, respectively. In addition to the source terms, i.e. production (
 ${P_k}$), dissipation (
 ${\epsilon _k}$) and particle-induced source (
 ${S_k}$) presented in § 3.2, the transport term due to mean convection (
 ${T_k} ={-} \langle {U_{g,i}}\rangle (\partial k/\partial {x_i})$), as well as the lumped diffusion term (
 ${D_k}$) composed of turbulent diffusion (
 $- {\textstyle{1 \over 2}}(\langle \partial {u^{\prime}_{g,j}}{u^{\prime}_{g,i}}{u^{\prime}_{g,i}}\rangle /\partial {x_j})$), pressure diffusion (
 $- (1/{\rho _g})(\partial \langle {p^{\prime}_g}{u^{\prime}_{g,j}}\rangle /\partial {x_j})$) and viscous diffusion (
 ${\nu _g}({\partial ^2}k/(\partial {x_j}\partial {x_j}))$), are shown.
Radial profiles of the normalised TKE budgets, i.e. production ( ${P_k}$), dissipation (
 ${\epsilon _k}$), particle-induced source (
 ${S_k}$), mean convection (
 ${T_k}$) and lumped diffusion (
 ${D_k}$) at
 $x/{D_j} = 1.5$ (a) and 25 (b), for the single-phase case and the particle-laden cases
 $S{t_D} = 0.3$, 1.4 and 11.2. The y-axis is normalised by a rate defined by the inflow jet bulk velocity and jet diameter (
 $U_{g,x - b - e}^3/{D_j}$).

Specifically, figure 25(a) presents the TKE budgets at upstream of  $x/{D_j} = 1.5$. As can be observed, both the lumped diffusion term (
 ${D_k}$) and the transport term due to mean convection (
 ${T_k}$) play important roles in balancing the TKE budgets. Figure 25(b) presents the TKE budgets at downstream of
 $x/{D_j} = 25$. As shown, for the single-phase jet, the positive production term (
 ${P_k}$) reaches its local peak near to the shear layer, while the negative dissipation term (
 ${\epsilon _k}$) exhibits a flat profile from centreline to shear layer region and then approaches zero as the radial distance increases. The mean flow convection (
 ${T_k}$) is mostly positive, the peak magnitude of
 ${T_k}$ occurs near to the centreline with a peak value similar to the peak magnitude of the production term. By comparison, the lumped diffusion (
 ${D_k}$) is mostly negative, reaching its peak magnitude near to the shear layer, with the peak magnitude being ~50 % of the peak production. These findings are consistent with the known dynamics of single-phase turbulent jets (Pope Reference Pope2000). For particle-laden jets, the presence of the particle phase varies the spatial gradient of the gas-phase velocity, and therefore, affects all of the gas-phase TKE budgets, including the production (
 ${P_k}$), dissipation (
 ${\epsilon _k}$), mean transport (
 ${T_k}$) and lumped diffusion (
 ${D_k}$) terms.
Appendix C. Sensitivity to grid resolution and Mach scaling
A grid convergence test was conducted by comparing the results from the simulation with the baseline grid resolution and one with 1.5× finer resolution. Considering that the velocity gradient has its maximum value at the inlet plane, the simulation results are expected to be most sensitive to grid resolution in the near-field region. Figure 26 presents the radial profiles of the mean gas-phase velocity ( $\langle {U_{g,x}}\rangle $), the TKE, the TKE production term (
 ${P_k}$) and the particle-induced TKE source term (
 ${S_k}$) at
 $x/{D_j} = 5$. As shown, the first moment statistics indicated by
 $\langle {U_{g,x}}\rangle $ are very similar. The second moment statistics indicated by TKE,
 ${P_k}$ and
 ${S_k}$ also only exhibit minor differences due to grid resolution.
Radial profiles of normalised gas-phase mean axial velocity ( $\langle {U_{g,x}}\rangle /{U_{g,x - b - e}}$), TKE (TKE/
 $U_{g,x - b - e}^2$), TKE production (
 ${P_k}/(U_{g,x - b - e}^3/{D_j})$) and particle-induced TKE source (
 ${S_k}/(U_{g,x - b - e}^3/{D_j})$) at
 $x/{D_j} = 5$, for the prediction with the baseline grid and 1.5× finer grid.

Moreover, figure 27 presents the normalised differences in  $\langle {U_{g,x}}\rangle $, TKE,
 ${P_k}$ and
 ${S_k}$ at the velocity half-width locations of
 $x/{D_j} = 5$ and 10. The normalised difference in terms of variable
 $\phi $ is computed as
 $\mathrm{\Delta }\phi (r,x) = |{{\phi_{base}}(r,x) - {\phi_{fine}}(r,x)} |/|{{\phi_{fine}}(r,x)} |$, where the subscripts ‘base’ and ‘fine’ represent the prediction with the baseline and 1.5× finer grid resolution, respectively. As can be observed, the difference at
 $x/{D_j} = 10$ is in general smaller than that at
 $x/{D_j} = 5$, justifying that the results of the simulations are typically more sensitive to grid resolution in the near field. The differences in terms of the first moment statistics are less than 1 %, while the second moment statistics exhibit larger differences of up to 5.2 %. However, the differences remain less than 5 % in general, illustrating that a reasonable grid convergence can be obtained with the baseline grid resolution.
Normalised difference between baseline grid and 1.5× finer grid, in terms of gas-phase mean axial velocity ( $\langle {U_{g,x}}\rangle $), TKE, TKE production (
 ${P_k}$) and particle-induced TKE source (
 ${S_k}$) at
 $x/{D_j} = 5$ and 10.

As mentioned in § 2.3, Mach scaling was applied to reduce the computational cost, resulting in an inflow Mach number of 0.5. To access the effect of compressibility, addition simulations with a lower inflow Mach number of 0.125, where compressible effects are expected to be small, were performed on a shorter computational domain for demonstration purposes; note that the other critical non-dimensional parameters, e.g. inlet Reynolds and Stokes numbers, remain unchanged.
Figure 28 presents the radial profiles of the gas-phase mean velocity and TKE predicted with inflow Mach numbers of 0.5 and 0.125. As shown, the differences between the two cases are small, illustrating that the compressible effects with Ma = 0.5 on the mean and fluctuating gas-phase velocity field can be safely ignored.
Radial profiles of gas-phase mean axial velocity ( $\langle {U_{g,x}}\rangle /{U_{g,x - b - e}}$), TKE (TKE/
 $U_{g,x - b - e}^2$) at
 $x/{D_j} = 5$, 10 and 15, for inflow Ma = 0.5 and 0.125.

In addition, figure 29 presents the radial profiles of the particle-phase mean velocity and number density predicted with inflow Mach numbers of 0.5 and 0.125. As can be observed, the differences in particle-phase quantities due to the inlet Mach number are minor, illustrating that the compressible effects with Ma = 0.5 on particle drag can also be safely ignored. The findings from figures 28 and 29 illustrate that the compressible effects on both gas- and particle-phase are in general minor, justifying the scaling operation to inflow Ma = 0.5.
Radial profiles of particle-phase mean axial velocity ( $\langle {U_{p,x}}\rangle /{U_{g,x - b - e}}$) and number density (
 $\langle \varTheta \rangle /{\varTheta _{b - e}}$) at
 $x/{D_j} = 5$, 10 and 15, for inflow Ma = 0.5 and 0.125.

Appendix D. Particle clustering
The brief analysis of particle clustering presented in § 3.1 is mostly based on visual evidence, a Voronoi diagram approach (Monchaux, Bourgoin & Cartellier Reference Monchaux, Bourgoin and Cartellier2010) is therefore employed to perform a more quantitative analysis. In this approach the domain is divided into cells defined based on particle positions and, therefore, the Voronoi cell area provides a measure of the local particle concentration.
The PDF of the Voronoi area is calculated to quantify the clustering of particles. Figure 30 presents the PDF of the logarithmic normalised Voronoi area ( ${V^\mathrm{\ast }} = \textrm{log}(V)$, where
 $V = A/\langle A\rangle$, with A and
 $\langle A\rangle $ being the Voronoi area and its mean, respectively) at
 $x/{D_j} = 15$. In comparison, the PDF of a Gaussian distribution having the same mean and r.m.s. as
 ${V^\mathrm{\ast }}$, as well as the PDF of a random Poisson process (RPP), are shown as reference, the latter represents the scenario where particles are randomly distributed in space with no clustering. As can be observed, the PDF of the logarithmic Voronoi area (
 ${V^\mathrm{\ast }}$) is very close to a Gaussian distribution, illustrating that the PDF of the Voronoi area (
 $V$) itself is close to a log-normal distribution. In comparison with the PDF for a RPP, the PDFs for all three particle-laden jets are broader, illustrating the deviation from random distribution due to particle clustering. These are consistent with the findings in Monchaux et al. (Reference Monchaux, Bourgoin and Cartellier2010). The span of V is over five orders of magnitude, indicating the presence of extremely large and small Voronoi cells, which is also an indicator of significant particle clustering. Furthermore, the r.m.s. of
 ${V^\mathrm{\ast }}$ for
 $S{t_D} = 0.3$, 1.4 and 11.2 is 1.2, 1.6 and 0.9, respectively, illustrating that, at the axial location of x/D = 15,
 $S{t_D} = 1.4$ exhibits the strongest particle clustering, followed by
 $S{t_D} = 0.3$ and then
 $S{t_D} = 11.2$. Note that the r.m.s. of
 ${V^\mathrm{\ast }}$ for a RPP is around 0.5, the larger r.m.s. of
 ${V^\mathrm{\ast }}$ found in particle-laden jets again illustrates the presence of particle clustering.
The PDF of the logarithmic normalised Voronoi area ( $\textrm{log(}V)$) at
 $x/{D_j} = 15$, in comparison with the PDFs of the corresponding Gaussian distribution and a RPP.

To quantify the correlation between particle clusters and low fluid vorticity regions, figure 31 presents the scatter of the normalised vorticity magnitude ( $|{\omega ^\ast }|= |\omega |/\langle |\omega |\rangle $) versus the normalised particle number density (
 ${\varTheta ^\ast } = \varTheta /\langle \varTheta \rangle $), where
 $\langle \varTheta \rangle$ and
 $\langle |\omega |\rangle $ are the ensemble averaged number density and vorticity magnitude of all samples. Note that
 $\varTheta $ is computed as the inverse of the local Voronoi area. Samples presented in figure 31 were taken at the axial location of
 $x/{D_j} = 15$. As illustrated by the conditional mean of
 $|{\omega ^\ast }|$ on
 ${\varTheta ^\ast }$, i.e.
 $\langle |{\omega ^\ast }|\; |\; {\varTheta ^\ast }\rangle $, for the two particle-laden jets with small inlet Stokes numbers, i.e.
 $S{t_D} = 0.3$ and 1.4, it is apparent that the particle number density is negatively correlated with the vorticity magnitude, illustrating that particles tend to concentrate in low-vorticity regions, consistent with expectation (Squires & Eaton Reference Squires and Eaton1991). Meanwhile, for
 $S{t_D} = 11.2$, the particle number density exhibits much less correspondence to the vorticity magnitude due to the relatively large particle inertia. The findings from figure 31 are consistent with the visual evidence presented in figure 4.
Scatter plots of the logarithmic normalised particle number density ( $\textrm{log(}{\varTheta ^\ast })$) versus normalised vorticity magnitude (
 $|{\omega ^\ast }|$) at
 $x/{D_j} = 15$, and the conditional mean of
 $\langle |{\mathrm{\omega }^\mathrm{\ast }}|\,|\,\textrm{log(}{\varTheta ^\ast })\rangle $.