1. Introduction
During the quest for a greener future, energy and environmental policymakers should consider the impact of policies on income distribution. The tension between environmental regulations and their impact on different income groups emerged in 1969 when the National Environmental Policy Act was signed. Despite the “double dividend” hypothesis, which predicts that both environmental and economic gains will result from energy and environment policies, the gains are not shared equally by all income groups (Sandler & Pezzullo, Reference Xing, Leard and Li2007).
Studies find that the benefits of many environmental policies outweigh the costs and are sustainable (Freire-González, Reference Fullerton2018). But are environmental policies equitable? There is rapidly growing literature on how the impacts of environmental and energy policies are distributed by income class. This literature can be considered a facet of environmental justice (Gianessi et al., Reference Graham-Rowe, Gardner, Abraham, Skippon, Dittmar, Hutchins and Stannard1979; Robinson, Reference Sierzchula, Bakker, Maat and van Wee1985; Parry & Small, Reference Prenzler2005; Fullerton, Reference Fullerton2008, Reference Gianessi, Peskin and Wolff2011; Bento, Reference Bento2013). There are studies on the costs and/or benefits of renewable energy (Hwang, Reference Jones and Kammen2010; Ming et al., Reference Muehlegger and Rapson2014; Yang et al., Reference Yang, He, Xia and Chen2019; Höckner et al., Reference Jenn, Inês and Michalek2020). However, currently, no study considers both the benefits and costs of renewable energy policy from a reallocation perspective among income groups. If the distribution of costs and benefits follow a different pattern, then focusing only on one side of the benefit-cost equation will miss the net distributional impact on society.
In this article, we offer an applied contribution to the emerging energy-equity literature by investigating the income-distribution impacts of the California Electric Vehicle Rebate Program (CVRP), a program designed to help stimulate consumer demand for plug-in electric vehicles (PEVs). Consumers who purchase a qualified PEV are eligible to receive a cash rebate. The size of the rebate has varied since the program was initiated in 2013, but the rebate has been as large as $5000 per vehicle. Due to distributional concerns that wealthy Californians were capturing a significant share of the rebates, the CVRP was modified in March 2016 to include income thresholds that disqualify high-income households. We investigate how the financial benefits of the rebate are distributed before and after this policy change.
Further, the subsidy program is funded indirectly by consumers. The revenues to support the rebates are drawn from California’s cap and trade program to control greenhouse gas emissions from stationary sources. Companies pay for emission permits in an annual auction, but eventually the costs transfer to consumers, who ultimately pay the costs of the permits, as those costs are passed through from companies to consumers (Bento, Reference Bento2013).
In this study, our results show that, before enforcing the income thresholds, the benefits of the CVRP program were highly regressive but the costs were slightly progressive. When combining benefits and costs, we find that the net impacts are regressive. In addition to reaffirming that the CVRP program benefits largely high-income groups, our study shows that focusing on the rebate benefits, without considering costs, slightly overestimates the inequality. Furthermore, we show nonlinear aspects to the distributional impacts. The top 10 % of the California population by income receives 33 % of rebates, but the population bearing the highest share of the rebate cost (13.5 %) is those with incomes at the 70–80 % percentile of the income distribution. This result highlights that, in order to improve equality, policymakers can reduce rebates at high-income levels and/or redistribute the cost of rebates by switching the funding source to other public finance sources. As policymakers reallocate the rebate and cost distributions, they might – in order to accomplish more fairness – strive to achieve more equality in the shares of benefits and costs experienced by each income group.
1.1 The California clean vehicle rebate program
The CVRP provides rebates to qualified PEV buyers, and the level of rebate depends on the vehicle design and the vehicle type. Eligible vehicle designs include battery-electric vehicles (BEVs), plug-in hybrid electric vehicles (PHEVs), and fuel cell vehicles (FCVs). Each of these vehicle designs is also recognized for compliance credits in the Zero Emission Vehicle (ZEV) program administered by the California Air Resources Board (CARB).
Technically, ZEVs are vehicles powered by electric motors with energy stored in a lithium-ion battery or hydrogen fuel cell. The types of vehicles covered include light-duty cars and trucks, neighborhood electric vehicles, and motorcycles. Currently, the rebate for zero-emission light-duty cars and trucks is a maximum of $2500, while the maximum rebate is $900 for neighborhood electric vehicles and motorcycles. PHEVs are vehicles that are capable of driving with battery power in conjunction with an internal combustion engine, and that battery can be charged by plug-in electric power. The maximum rebate for PHEVs is currently $1500.
The size of the rebate was independent of income until 2016. Starting in March 2016, the CVRP set a household income ceiling of $500,000 for rebate eligibility. Moreover, households with incomes less than $72,900 were made eligible for an additional $1500 in rebates on top of the base rebate.
The funding source for the CVRP is mainly the state’s cap-and-trade program for greenhouse gases (Center for Sustainable Energy, Reference DeShazo, Sheldon and Carson2016). Revenue is raised from an auction, where the government sells emissions allowances to companies in need of allowances. Having taken effect in 2013, California’s cap-and-trade scheme has created one of the largest carbon permit markets in the USA. The program covers 85 % of California’s emissions, including the electricity sector and transport fuels.
The revenues from the carbon cap-and-trade program are the sole source of funding for the state’s carbon reduction programs, and the CVRP program is one of them. Because the cap-and-trade program is the sole funding source for the CVRP program, the distribution of costs of the cap-and-trade program by income group is the same as the distribution of costs of the CVRP program by income group.
1.2 Who benefits?
DeShazo et al. (2017) were the first authors to explore the distributional effects of the CVRP. They dispensed surveys to potential PEV buyers in California and integrated the results with market conditions to estimate the rebate’s impact. They showed, using a model simulation, that higher income groups received most of the rebates. They also analyzed some reforms, including higher rebates for lower-income groups and vehicle price caps that might make the CVRP more equitable and cost-effective. Rubin and St-Louis (Reference Van Haaren2016) also reach a similar conclusion by utilizing the CVRP rebate data. However, such studies have not considered how the CVRP collects funding from the cap-and-trade program.
Previous studies have examined the costs of cap and trade by income in absolute terms and as a share of household income. Hassett et al. (Reference Höckner, Voswinkel and Weber2007) computed the effect of a national energy tax. They found that the ratio of energy expenditures to income decreases with income. Grainger and Kolstad (Reference Hardman, Chandan, Tal and Turrentine2010) estimate the distribution of potential carbon prices by income group using the 2003 Consumer Expenditure Survey and an input-output model. They show that the cost of a carbon tax increases as family income increases, but the cost-to-income ratio decreases as income increases (again implying a regressive pattern of costs). Jones and Kammen (Reference Langbroek, Franklin and Susilo2014) estimate a model of carbon emissions at the zip code level using data from the Consumer Expenditure Survey. Independent variables include household energy consumption from the National Household Travel Survey and transportation information from the Residential Energy Consumption Survey. We use information from their study below to ascertain the cost distribution of cap and trade.
1.3 Contribution of the study
As both the benefits and cost of the CVRP program increase with income, a more complete analysis is needed for policymakers to evaluate the CVRP program’s redistribution effect. Our research thus connects two intellectual traditions in public finance. One concerns the income distribution of people who benefit from a government program. The other concerns the income distribution of people who pay for a government program. Bringing the two distributions together, we offer insight into the CVRP’s net-benefit distribution. We evaluate the net benefit to income ratio and show that the ratio offers different policy implications than the result when considering only the benefit ratio or only the cost ratio. To the best of our knowledge, this is the first study considering both the funding source and benefits of the CVRP program.
We build on the work of Rubin and St-Louis (Reference Van Haaren2016) and DeShazo et al. (2017)) in several ways. First, we use data on the actual incidence of rebates by zip code to validate their survey-based finding that high-income groups receive most of the rebates. Second, we explore whether the recently adopted income-based reforms have changed the income distributions of rebate beneficiaries. Finally, we calculate the CVRP cost distributions on different income groups using the California cap-and-trade program’s income distribution.
Our results reaffirm previous findings that the CVRP benefits increase with income. When we examine rebate distributions after the program was modified, we again find that the CVRP benefits increase with income. The distribution of the costs of the program is more complicated. The results reveal that middle-income groups bear most of the total expense from the CVRP program. Most interesting are our findings when benefit and cost distributions are compared. Income groups with incomes between the 70th and 80th percentiles pay for 13 % of the total CVRP program costs and receive 16 % of the rebate benefits. On the other hand, the highest 10 % income group bears 11 % of the costs but receives 33 % of the total rebates.
2. Theoretical basis and hypothesis
Our objective is to determine how the financial benefits and costs of the CVRP vary by income class. During the study, we make the following assumptions: (i) the only funding source for the CVRP program in California is from the cap-and-trade program; (ii) the government revenue from the California cap-and-trade program solely depends on energy consumption; and (iii) the zip code mean income represents the mean income for rebate receivers. We also focus on the California CVRP program and do not consider other electric vehicle policies, such as charging station distribution and charging rates. With these assumptions, our results focus on the CVRP program’s redistribution effects, but not the general electric vehicle equity problem.
We evaluate the distributional impact of policies by exploring the ratio of benefits to costs in different income groups. Progressiveness occurs when the ratio of benefit to income declines with income or when the ratio of cost to income rises with income. Regressiveness implies the opposite patterns. In contrast to a complete benefit-cost analysis, we introduce a public finance perspective and focus on the financial redistribution of the CVRP program. Thus, we do not consider the effectiveness of the CVRP program in stimulating electric vehicle sales or its environmental benefits and risks. By focusing on the financial redistribution effect, this study provides a straightforward overview of how the CVRP program reallocates income in California.
The main index of interest, therefore, is the net benefit-cost to income ratio at the zip code level. In our study, we use the following equation to calculate the net benefit to income ratio:
 $$ rati{o}_i=\left( benefi{t}_i-\mathit{\cos}{t}_i\right)/ incom{e}_i $$
In Equation (1), the ratio is the net benefit to income ratio in zip code
 $ i $
. The benefit is zip code
 $ i $
’s benefits from the CVRP program. The cost is zip code
 $ i $
’s costs from the CVRP program. The income is zip code
 $ i $
’s median income. If the ratio is greater than zero, then zip code
 $ i $
’s benefits are more than the costs from the CVRP program. If the ratio is less than zero, then zip code
 $ i $
’s benefits are less than the costs from the CVRP program.
The funding source and mechanism of the CVRP program also suggest how its benefits and costs distribute among income groups. The funding source of the CVRP program distributes among all residents, because its funding source, the California cap-and-trade program, charges all residents who consume electricity and gasoline. Meanwhile, only residents buying electric vehicles receive rebates. The benefits should be expected to concentrate on high-income consumers, given that purchasers of new PEVs are predominantly high-income consumers. For example, a recent trade survey found that the average Tesla buyer’s income was $503,000 for the Model X, $267,000 for the Model S, and $160,000 for the new Model 3 (Prenzler, Reference Robinson2016, Reference Rubin and St-Louis2017). Therefore, we expect that the benefits of the CVRP program will be regressive but the distributions of costs and net benefits are not obvious without careful study.
3. Data and methods
We then consider the data and methods concerning financial benefits and then the data and methods concerning financial costs.
3.1 Financial benefits: consumer rebate data
The unit of analysis in this study is at the zip code level. Due to privacy concerns, there is no single data source after 2015 that provides information on how much money each recipient received in CVRP rebates and that recipient’s household income. Instead, the data provided by the CVRP include the rebate amounts and the zip code of the recipient’s address. Therefore, the rebate data are aggregated at the zip code level, as well as matched with income and other demographic information at the zip code level.
The rebate data are compiled from the survey statistics of the California Clean Vehicle Rebate Project (Center for Sustainable Energy, 2018). There are many advantages to using these data. As the information is used for issuing rebates, the survey statistics dataset contains accurate information about the rebate and related information. The data used in this research cover rebates from 2010 to 2017, allowing us to explore the potential change in buyers responding to the income-related policy changes of 2016.
The dataset contains the rebate amount and the zip code where each rebate was issued. The data were collected from a voluntary survey given to the rebate receivers and included the zip code where they register to receive the rebate, the amount of rebate they received, the manufacturer of the car, and power sources. The survey also contains personal information, but samples collected after 2015 are not disclosed to protect buyer privacy. Therefore, in this research, the rebate information is compiled according to their zip code and year and then linked to other information.
The income information for each zip code is gathered from the Internal Use Statistics of Income (SOI) individual tax return files. The aggregate gross income variable contains the total income (before taxes) within each zip code. The SOI zip code level data only cover 2010–2015. Therefore, income data after 2015 are represented by the 2015 data, the latest year available. Population data were necessary to estimate average income. The population within each zip code was collected from the 2010 Zip Code Tabulation Areas from the Census Bureau. The zip codes with a small population can generate extreme values (i.e., they are sensitive to minor changes), so only zip codes with a population of more than 100 are included in the analysis.
Ultimately, the data analyzed cover 1659 zip codes within California and a total of 8380 observations for 2010–2017. The total number of zip codes within California is 2597. The number is reduced in this dataset because there are zip codes that either had no rebates issued or had insufficient populations. The total observations were also separated from those occurring before and after the income cap was imposed (accounting for 6811 and 2566 observations, respectively) to ascertain whether the policy change was effective. There are, however, overlaps between the two groups, as the date of the policy change is in the middle of a year, so the rebates issued before and after that year are averaged separately.
3.2 Financial costs: cap and trade auction revenues
For the cap-and-trade program’s cost distribution, we ascertain carbon emissions by zip code in California and then assume that the program’s costs in each zip code are proportional to a zip code’s share of statewide carbon emissions. In effect, we are assuming that the costs of the cap-and-trade program are passed on to the final product consumers, a standard assumption in the cap-and-trade literature. Thus, zip codes with a large (small) average share of carbon emissions incur a large (small) share of the costs from the permit auctions.
The carbon emissions data for our main analysis were obtained from Jones and Kammen (Reference Langbroek, Franklin and Susilo2014), which relied on the Residential Energy Consumption Survey and the U.S. Census. Compared with other studies, the data used in Jones and Kammen (Reference Langbroek, Franklin and Susilo2014) are more up-to-date and relevant to the zip code unit of analysis used in our research. Jones and Kammen analyzed at the zip code level using a two-stage approach. In the first stage, the Residential Energy Consumption Survey was used to estimate the coefficients for energy use. With the coefficients estimated, they compiled the local living patterns from the U.S. Census and estimated the emissions distribution of carbon dioxide.
As a robustness check, we also used emissions information from Grainger and Kolstad (Reference Hardman, Chandan, Tal and Turrentine2010). To simulate the potential impact of a carbon tax, they utilized data from the 2003 Consumer Expenditure Survey and a standard input-output table for U.S. production estimated by the U.S. Bureau of Economic Analysis.
4. Results of unconstrained program
Table 1 summarizes the California data on rebates received and mean income, reporting the mean rebate at the individual level and the mean income at the zip code level. Among those receiving a rebate, the average rebate was about $2200. The mean income was about $95,500. The average ratio of rebate to population was about $3.9 per 100 persons.
Summary statistics for California rebate program.

Note: Reported is the mean of each variable with standard deviations in parentheses.
Figure 1 displays on a map of California the distributions of zip codes benefiting and losing due to the CVRP. The map provides a visual indication of how the two quantities are related. In the map, those zip codes receiving more rebates than costs are marked as red, and those zip codes contributing fewer rebates than costs are marked as blue. Those zip codes without rebate data are left in white. Although Figure 1 does not include the income category, it reveals that only the high-income regions of San Francisco and Los Angeles, and a few other regions tend to receive more rebates than costs. The rest of the areas in the state, which tend to have lower median incomes, tend to have smaller rates of rebates compared to costs.
Net financial impact of the CVRP program by zip code.

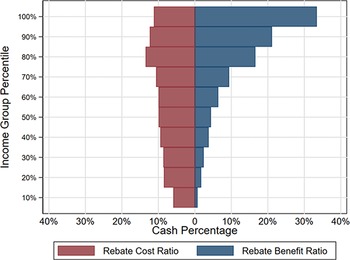
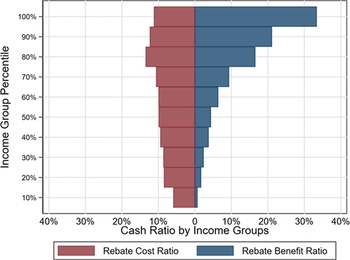
The income distribution of the cap-and-trade program’s mean cost is compared to the income distribution of the mean rebate in Figure 2. In this figure, income, rebate received and rebate costs are averaged at the zip code level. The right side of Figure 2 reports the distribution of rebate percentage received by each income category while the left side reports the percentage distribution of the cap-and-trade cost by income (Jones & Kammen, Reference Langbroek, Franklin and Susilo2014). The income intervals are chosen to ensure that each category has the same population size.
Distribution (%) of financial burden and financial rebate as a share of income, by zip code.

Note that the distribution of financial costs among income classes is different from the distribution of financial benefits. The financial benefits of the rebates are concentrated in the high-income categories while the low-income categories receive virtually no benefit from the rebates. To be more specific, the group with the highest 10 % of income accounts for 11 % of the total costs but receives 33 % of the total rebates.
Figure 2 also shows that the rebate program’s costs are distributed relatively evenly across income categories, with a slight pattern of progressiveness. The highest average financial cost of the program is reported for people with incomes between 70 and 80% percentile. Overall, the financial costs appear somewhat larger in the high-income categories than in the low-income categories.
Table 2 shows that the ratio of net benefit to income increases from negative to positive as income increases. The sign of net benefit shows whether a specific income group receives more benefits than the costs. If the sign is positive, then the income group receives more rebates than costs. Both mean benefits and costs increase as income increases, but the mean benefits only surpass the cost for people with incomes higher than $66,670, and the benefits continuously increase with income. The increasing ratio indicates that the net benefits of the rebate program are concentrated in the highest income groups.
Net benefit to income ratio.

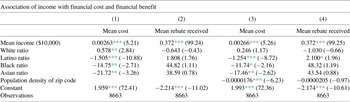
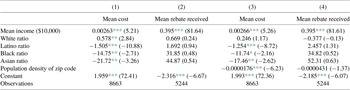
Table 3 reports the correlations, derived from simple linear regression, between mean income, and mean financial cost and mean financial benefit of the CVRP. Previous studies also suggest household demographics (i.e., the number of children and number of household vehicles) and consumer demographic information (i.e., race, household age, education, housing type, and political attitudes) (DeShazo et al., 2017) are correlated with buying electric vehicles. However, due to the data limitations, we include only income and race in the analysis. A more complete dataset might need a survey specific to electric vehicle buyers.
Statistical predictions of mean cost and mean rebate.

Note: t statistics in parentheses.
* p < 0.05;
** p < 0.01;
*** p < 0.001.
The result shows the magnitude of the associations between the variables, but we do not aim to test causality or make predictions. We also include population density and race into the analysis, as previous literature suggests (Jones & Kammen, Reference Langbroek, Franklin and Susilo2014; Muehlegger & Rapson, Reference Neubauer and Wood2019). Structured similarly to models 1 and 2, models 3 and model 4 include the population density and race as control variables.
The results of models 1 and 2 show that zip codes with higher incomes both contribute more to and receive more from the rebate program. The mean income coefficient of model 3 is a little bit lower than that of model 1, as Jones and Kammen (Reference Langbroek, Franklin and Susilo2014) suggested, but the conclusion about the significance of the coefficient does not change. Therefore, the previous implication is maintained. The difference between models 2 and 4 is minor, showing that including the population density variable does not change the basic finding.
In models 1 and 3, the mean income coefficient is significant and positive, even though the coefficients are small. The coefficient magnitudes mean little because income in the original surveys was categorical. Instead, the scale matters: the significant p-values show a high correlation, implying that the higher income zip codes contribute significantly more to the rebate program through the California cap-and-trade program. Meanwhile, in models 2 and 4, the income coefficients are also small and are also significant and positive. The significant p-values here mean that, on average, the higher-income people receive more rebates.
By comparing the results of the two estimates, we see that the positive average income coefficients for receiving rebates are 90–100 times that for contributing to the program. The ratio shows that, although higher income groups contribute somewhat more to the rebate program as income increases, the benefits received from the program increase far more rapidly with income. One reason for this result is that the cap-and-trade program’s financial costs are shared by all residents in California (through higher prices for products), but the benefits of receiving the rebates are concentrated among wealthy consumers to buy new PEVs, a highly expensive consumer product. Therefore, the results of the estimates and coefficients suggest the same conclusion as the visual inspection of Figure 2: the rebate program’s distributional impacts are regressive.
4.1 Comparing before and after income restrictions
In 2016, there was a major change in the CVRP that sought to address concerns about income inequity. Before the change, there was no income restriction on receiving the clean vehicle rebate. After 29 March 2016, two stages of income ceilings were imposed on the rebate, as well as two stages of additional rebates for low-income consumers. From that date to 31 October 2016, the income ceiling was $250,000 for a single filer and $1500 was added to the rebate for lower-income buyers. After 31 October 2016, the income ceiling was lowered to $150,000 and the additional rebate was raised to $2500.
The previous analysis did not consider the change of policy, and therefore it is reasonable to consider how much the new policy changed the impacts on income distribution. To examine whether our previous conclusion is robust to the change, the data used in Figure 1 are split into two parts: before 29 March 2016, and after 29 March 2016. After splitting, the dataset for observations before the policy changes contains 9929 observations while the dataset after the policy changes contains 2763 observations.
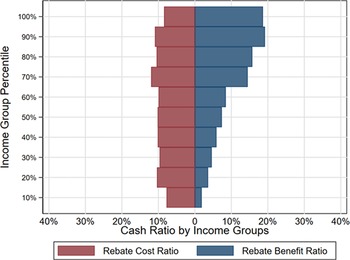
Figures 3 and 4 display the income distribution of both the rebate contribution ratios and the rebate received ratios, before (Figure 3) and after (Figure 4) the policy changed. The distribution of the contribution to the rebate program before the policy change is more like that of Figure 2, with 39 % of rebates flowing to the highest income groups. This is not surprising because most of the observations in the main dataset were collected before the policy changes. Since the income interval has been chosen to even the population within each category, the scales are somewhat different. After the income constraint was imposed, the ratio decreased to 25 %.
Distribution (%) of financial burden and financial rebate as a share of income, by zip code, before income restrictions.

Distribution (%) of financial burden and financial rebate as a share of income, by zip code, after income restrictions.

Despite the policy change, the patterns displayed in Figures 3 and 4 suggest similar conclusions to those drawn from Figure 2: the cost of the rebate program derived from the California cap-and-trade program is relatively evenly distributed among different income groups while the benefits of the rebate program concentrate on the highest income group. Groups other than the highest income group obtain almost no benefits from the rebate program. The cost of the rebate policy is relatively evenly borne among different income groups and actually increases slightly as income increases.
Tables 4 and 5 list the ratios of net benefit to income, before (Table 4) and after (Table 5) income ceiling was included. The income intervals are different in Tables 4 and 5, showing the change in income in California. However, the mean net benefit to income ratio increases with income in both Tables 4 and 5. This means that including the income ceiling does not change the fact that the rebate policy predominantly benefits individuals with higher incomes.
Net benefit to income ratio before income ceiling.

Net benefit to income ratio after income ceiling.

Tables 6 and 7 examine the correlations among mean income, meaningful contribution to the rebate program, and mean rebate received from the program using different emission estimations. Models 1 and model 2 examine the correlation between income, mean rebate received, and mean rebate contribution individually. Models 3 and 4 also include population density as a control variable.
Statistical predictions of mean cost and mean rebate, before income restrictions.

Note: t statistics in parentheses.
* p < 0.05;
** p < 0.01;
*** p < 0.001.
Statistical predictions of mean cost and mean rebate, after income restrictions.

Note: t statistics in parentheses.
* p < 0.05;
** p < 0.01;
*** p < 0.001.
The results of Tables 6 and 7 show similar results to that of Table 3. In general, people with higher incomes bear more costs and receive more benefits from the rebate program. The mean income coefficients in model 1 in Tables 6 and 7 are lower than those in Table 3. However, the conclusion regarding the significance of the coefficient does not change. In other words, even after the policy change, higher-income people still received more rebates.
In both tables, mean income coefficients are significant and positive. Again, although the magnitude of these coefficients should not be interpreted numerically, their scales are still comparable. The significant p-values also mean that, on average, the higher-income people pay more to, and receive more rebates from, the rebate program.
The ratio of benefits to costs from the rebate program is also similar to that found in Table 3. The positive income coefficients for receiving rebates are approximately 150 times those of the cost from the program between model 3 and model 4 in Table 6, and the number grows to 276 times between model 3 and model 4 in Table 7. The ratio means that, although the high-income groups contribute more to the rebate program, the benefits received from the program rise far faster as income rises. Therefore, the inference that higher-income people receive more from the rebate program is the same and, thus, is robust to the changes in policy.
5. Discussion: potential policy responses
The results of the analysis indicate that the current CVRP has a strongly regressive distribution of financial benefits and a modestly progressive distribution of financial costs. Although the rebate program later included an income ceiling for those receiving the rebate and an increased rebate for lower-income groups, the policy change has not changed the fact that the distribution of CVRP financially benefits the high-income groups. The reason that imposing income restrictions does not change the distribution of CVRP benefits could be that the rebate does not compensate enough for high PEV prices in lower-income groups and a lack of public charging infrastructure discourages low-income consumers more than high-income consumers. Low-income groups are more sensitive to vehicle price (Muehlegger & Rapson, Reference Muehlegger and Rapson2018) and less likely to own their houses (Sierzchula et al., Reference Yang, He, Xia and Chen2014).
In addition to the CVRP’s direct redistribution effect, the program has also helped wealthier people access cheaper transportation. According to the comparison tool developed by the U.S. Department of Energy, the national average price for one gallon of gasoline is $2.84, while the cost for one e-gallon is $1.19 (EGallon, Reference Freire-González2018). (California has higher prices for gasoline and electricity than the national average). Thus, including the income distribution of vehicle operating costs would likely have made the CVRP financial benefits appear even larger than they are without considering energy costs.
The CVRP and its income redistribution could be justified by the social gains from reducing greenhouse gas emissions by encouraging the use of ZEVs. However, studies show that the social gains from reducing emissions are not as large as would be expected by the difference in emissions between the average car and a ZEV (Archsmith et al., Reference Archsmith, Kendall and Rapson2015; Jenn et al., Reference Lambert2016; Muehlegger & Rapson, Reference Parry and Small2020; Xing et al., Reference Xing, Leard and Li2021). The buyers for ZEVs tend to replace fuel-efficient vehicles with ZEVs, so the emission reduction is smaller than average (Muehlegger & Rapson, Reference Parry and Small2020; Xing et al., Reference Xing, Leard and Li2021). Furthermore, the current ZEV policy also encourages manufacturers to produce less-efficient vehicles, due to the compliance averaging in regulatory programs (Jenn et al., Reference Lambert2016).
On the other hand, both the Random Utility Model estimation (Langbroek et al., Reference Muehlegger and Rapson2016) and the recent experience from the state of Georgia show the rebate program’s importance to the commercial viability of the electric vehicle industry. For several years Georgia stimulated PEV sales with a generous PEV rebate of $5000. When Georgia canceled the financial incentive for PEV sales, the volume of PEV sales fell significantly (Lambert, Reference Ming, Ximei, Yulong and Lilin2017). Thus, insofar as the rebates’ main policy goal is to increase PEV sales, efforts to enhance the equity of rebate design need to be analyzed carefully.
The most obvious modification to increase equity would be to increase the rebate that lower-income people receive. Since low-income consumers are more price-sensitive (Muehlegger & Rapson, Reference Muehlegger and Rapson2018) and more likely to purchase used cars than new cars (Muehlegger & Rapson, Reference Neubauer and Wood2019), it may be worthwhile to consider rebates for purchases of used PEVs. California’s efforts to help low-income people purchase new PEVs may be misguided because new PEVs are quite expensive, well above the $35,000 average transaction price for a new light-duty vehicle in 2017. On the other hand, the current federal policy of restricting federal tax credits to new PEVs has had the indirect effect of reducing used PEVs’ resale value, which in turn has made used PEVs more affordable than they otherwise would be. Thus, efforts to make PEVs more affordable for low-income consumers need to be analyzed with care.
Although the average prices of new PEVs have decreased in recent years, the savings on fuel and rebates for the owner still may not be large enough to cover the initial price premium. This factor is especially significant for the lower and middle-income groups, as they access the used car market where consumers are more sensitive to prices, rebates, and operating expenses (DeShazo et al., 2017). Affordable leasing arrangements for used or new PEVs might be an attractive option for some low-income and middle-income households.
Another policy alternative is to focus rebates on the types of vehicles that lower-income consumers purchase. Rebating on luxury BEVs such as the Tesla Model X does not make the BEV more accessible to lower and middle-income groups, yet Tesla buyers have been a major beneficiary of federal and state incentives (Hardman et al., Reference Hassett, Mathur and Metcalf2017). Since the lower and middle-income consumers are usually in the market for nonluxury vehicles, and since the average ratio of rebate to vehicle price is higher for nonluxury vehicles, policymakers should consider focusing the rebates on nonluxury vehicles. As this article went to press, California was considering more equity-related changes to the CVRP (Carpenter, Reference Carpenter2021).
Another aspect worth considering is whether PEVs can meet the daily needs of lower-income drivers. Although PEVs have much lower energy costs than gasoline vehicles, only high-income households are able to utilize the strength of PEVs while minimizing the difficulties. First, high-income households tend to have two or more vehicles while low-income households may have only one vehicle. The high-income household can buy a PEV that will be utilized only for short-range or inner-city driving and that requires 2–4 hours to charge and receive a rebate. Low-income households are less likely to have more than one vehicle and, thus, that vehicle must have the capability to meet all of the household’s needs. In this respect, the short-range BEV is a less attractive option than a PHEV or even an HEV that does not require lengthy charging (Van Haaren, Reference Sandler and Pezzullo2011; Graham-Rowe et al., Reference Grainger and Kolstad2012; Neubauer & Wood, Reference Prenzler2014; Xing et al., Reference Xing, Leard and Li2021). Secondly, despite the mass investment in public charging infrastructure, house renters still have difficulties in charging their PEVs. Therefore, increasing the charging infrastructure in low-income areas (Sierzchula et al., Reference Yang, He, Xia and Chen2014), targeting the rebate on vehicles meeting a certain driving range, and enforcing recharging standards might also attract lower and middle-income buyers. China is rapidly gaining experience in commercializing affordable PEVs by deploying public infrastructure in advance and, thus, the Chinese experience should be examined for its relevance to other settings.
In addition to lowering the price of new PEVs, changing the funding source for the rebate program also helps to increase equity. The resource redistribution among different income groups raises equity concerns for PEV rebates. Our results show that the middle-income groups pay for most of the rebates, but the highest 10 % income group receives most of the rebates. If the tax base for the CVRP program changes to a capital-gains tax, the cost of the CVRP program would be distributed more heavily in higher-income groups that experience the lion’s share of capital gains.
Acknowledgments
The authors acknowledge helpful comments and suggestions from S. Carley and D. Duncan. The authors are fully responsible for the research design, analysis, and conclusions. This research did not receive any specific grant from funding agencies in the public, commercial, or not-for-profit sectors. More information on the robustness checks is available from the authors upon request.