I. INTRODUCTION
Inverse scattering techniques at millimeter and submillimeter frequencies have been successfully used in a wide range of applications such as medical diagnosis [Reference Fear, Li, Hagness and Stuchly1], detection and identification of buried objects [Reference Quivira, Fassbender, Martinez-Lorenzo and Rappaport2], and security scanners for detecting concealed threats in close range [Reference Sheen, McMakin and Hall3]. In the band between 100 GHz and 1 THz, through-clothing imaging is feasible due to the transmissive behavior of materials, such as paper, plastic, wood, and clothing tissues [Reference Siegel4, Reference Appleby and Wallace5]. Active submillimeter-wave imaging systems are capable to achieve images with resolution of about 1 cm at standoff ranges from 5 to 100 m [Reference Sheen, Hall, Severtsen, McMakin, Hatchell and Valdez6–Reference Cooper, Dengler, Llombart, Thomas, Chattopadhyay and Siegel8].
Current submillimeter imaging systems require the use of focused aperture antennas to concentrate the transmitted energy in a small region at the desired distance [Reference Cooper, Dengler, Llombart, Thomas, Chattopadhyay and Siegel8]. Instead of radiating in the far field, as most of the conventional apertures, these systems usually work in the Fresnel region of the antenna. Owing to the technological difficulty of having focal plane arrays at these frequencies, mechanical fast beam scanning has been proposed to interrogate the area of interest. In [Reference Cooper, Dengler, Llombart, Thomas, Chattopadhyay and Siegel8–Reference Garcia-Pino, Llombart, Gonzalez-Valdes and Rubiños-Lopez10] multi-reflector antenna systems were used to accomplish that by substituting the paraboloidal main reflector for an ellipsoidal-based one, which concentrates the transmitted energy in a focal region.
The characterization of the focused beams produced by this kind of antennas is of maximum interest for imaging applications. For instance, the transversal beamwidth gives a better available resolution, whereas the longitudinal beamwidth determines the range of distances where the system is usable. Furthermore, the beam aberrations that occur while the beam is scanned characterize the resolution degradation across the transversal field of view of the system.
The basic theory of focused aperture is well known, and it has been extensively reported in publications on Antennas [Reference Shermann III11–Reference Aleksieieva and Dolzhikov15], as well as on Optics [Reference Li and Wolf16–Reference Li20]. The most classical publication on focused aperture antennas is by Sherman [Reference Shermann III11], who analyzed the diffraction fields of continuous, rectangular apertures when the system is focused in the Fresnel region. A theorem was proven which establishes that the far-field properties of conventional apertures with uniform phase are the same as the ones of the focused apertures across the focal plane. Graham showed in [Reference Graham12] that the axial field pattern of focused aperture antennas can be analyzed and synthesized in the same manner as the angular pattern of the far field apertures. In [Reference Hansen13], Hansen studied the effects of amplitude tapering in the focused aperture lobes of the axial patterns. Shafai et al. provided in [Reference Shafai, Kishk and Sebak14] some tables with beam characteristics for defocused parabolic reflectors. In [Reference Aleksieieva and Dolzhikov15] the effect of phase errors in circular apertures focused in the Fresnel zone is investigated. In the field of Optics, Li and Wolf studied in [Reference Li and Wolf16] the diffraction of a converging, monochromatic spherical wave through a circular aperture to find the deviation between the point of maximum field intensity and the geometric focus. This deviation is referred as the focal shift and it was predicted for circular apertures in terms of a parameter known as the Fresnel number, which relates the dimensions of the system and the wavelength. The focal shift was then obtained for rectangular apertures by Hansen in [Reference Hansen13]. Some other works were devoted to study the focal shifts in converging electromagnetic waves by a simplified mathematical model [Reference Parker Givens17], in terms of the state of coherence of the focused wave [Reference Friberg, Visser, Wang and Wolf18], by the Kirchhoff theory [Reference Li19], and by the Rayleigh theory [Reference Li20].
This paper presents a novel analytical model of focused beams due to circular apertures. The model is used to calculate closed expressions to approximately predict the main beam parameters. It is the first time these results are obtained for focused apertures. The analytical model is based on a generalization of the parabolic on pedestal amplitude distribution described in [Reference Milligan21]. In this case, the necessary focusing phase is introduced in the model. Both transversal and axial patterns admit analytical integration and can be straightforwardly obtained with this model. The main contribution of the paper is to provide design formulas to characterize the main parameters of the focused beams in terms of the taper illumination at the rim of the aperture.
The paper is organized as follows: in Section II, the focused aperture electromagnetic model is reviewed and a closed formulation for the transversal and axial patterns of the electromagnetic beam for focused circular apertures is developed. Some numerical results of the focused beams in an imaging radar application are presented in Section III, addressing the practical calculations of the axial and transversal beamwidths in terms of the analytical design formulas. The effects of quadratic phase errors in the focused apertures are discussed in Section IV; this is of special interest due to the presence of such errors in the confocal reflector systems implementing focused apertures. Finally, the conclusions are reported in Section V.
II. BASIC FORMULATION FOR FOCUSED APERTURES
A) Electric field in the Fresnel region of an aperture
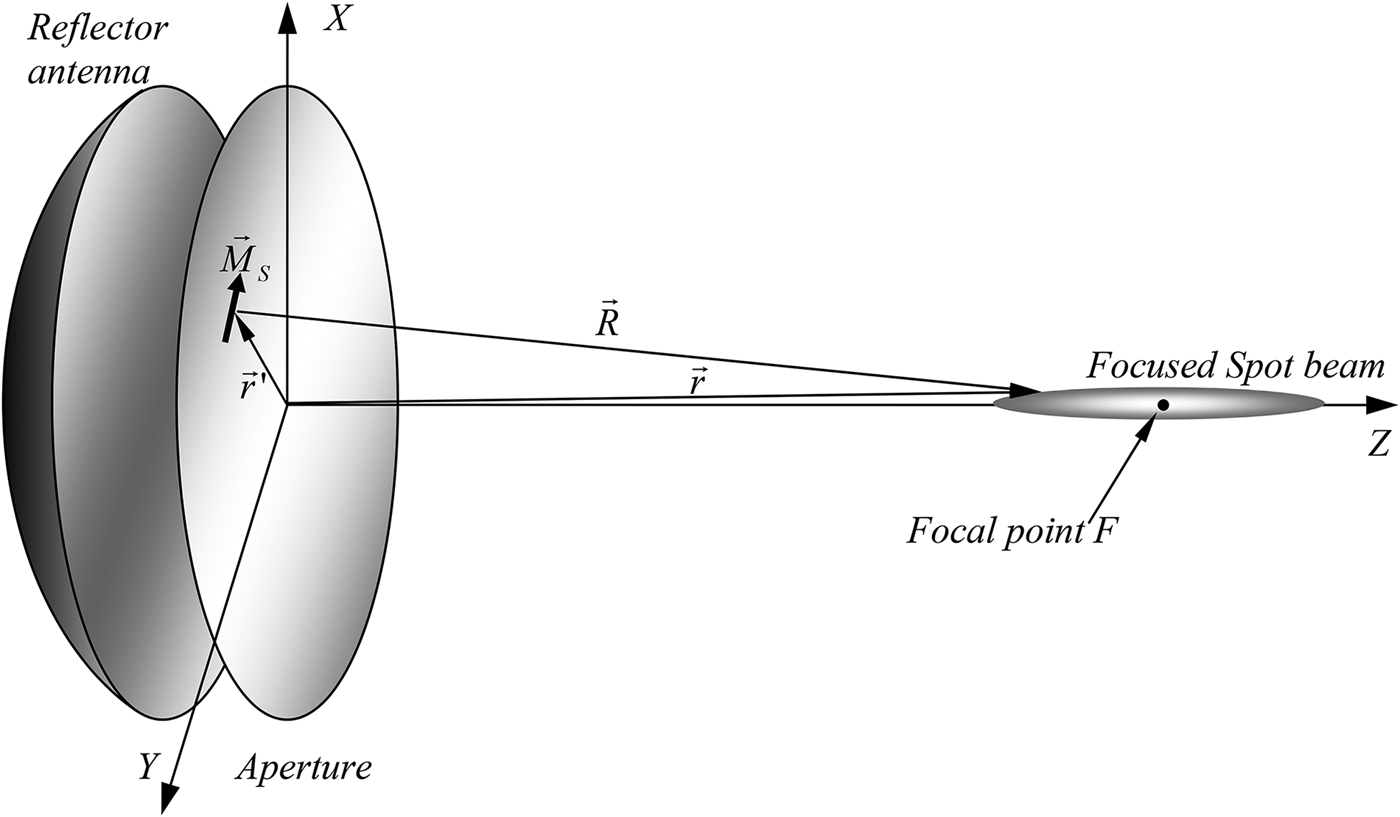
Let us consider an antenna with the aperture in the XY plane, as in Fig. 1. Every aperture point  $\vec r^{\,\prime}$ is excited by an electric field
 $\vec E_a $. According to the second principle of equivalence, based on the electric conductor equivalent [Reference Balanis22], the electromagnetic field produced by the aperture can be modeled as the radiation of an equivalent magnetic surface current
 $\vec M_S=- 2\hat z \times {\vec E} _a$. The electric field produced at any observation point
 $\vec r=x\hat x+y\hat y+z\hat z$ by a magnetic source can be represented by the following expression [Reference Balanis23]:
 $${\mathop{E} \limits^{\rightharpoonup}(\mathop{r} \limits^{\rightharpoonup}) =\int\!\!\!\int_{S^{\prime}} {\lpar \vec {R} \times \vec {M} _S\rpar } \displaystyle{{\lpar 1+jkR\rpar e^{-jkR}} \over {R^3 }}dS^{\prime}}\comma \;$$
where  $\vec R=\vec r - \vec r^{\,\prime}$,
 $R=\left\vert {\vec r - \vec r^{\,\prime}} \right\vert$, and k represents the wavenumber. If the distance from the aperture to the observation point is much larger than one wavelength (kR≫1), the electric field of equation (1) can be approximated as:
 $$\mathop{E} \limits^{\rightharpoonup}(\mathop{r} \limits^{\rightharpoonup}) =\displaystyle{j \over {2\lambda }}\int\!\!\!\int_{S^{\prime}} {\lpar \hat R \times \vec {M} _S \rpar \displaystyle{{e^ {-jkR}} \over {R}} dS^{\prime}}\comma \;$$
where  $\hat R=\vec R/R$. Let us consider the particular case of a circular aperture of radius a with amplitude and phase of the illumination dependent on the radial coordinate ρ. If the polarization is uniform and characterized by the unit vector
 $\hat e$, contained in the aperture plane, the cross product in equation (2) can be expressed as:
 $$\hat R \times \vec M_S=\displaystyle{{2E_0 e_{ac} \lpar \rho \rpar } \over {R}}\left[{z\hat e - \lpar \hat e \cdot \vec R\rpar \hat z} \right]\comma \;$$
where e ac(ρ) is a complex normalized function that represents the aperture illumination distribution and E 0 is the maximum value of the electric field on the aperture. By combining equations (2) and (3), it is proved that the longitudinal component of the field (along the Z-axis) is cancelled in the boresight direction ( $\hat r=\hat z$), while the transversal component (parallel to
 $\hat e$), which is dominant near the Z-axis, can be expressed as:
 $$\mathop{E_T} \limits^{\rightharpoonup}(\mathop{r} \limits^{\rightharpoonup}) =\displaystyle{{jE_0 z} \over {\lambda}}\hat e\int\!\!\!\int_{S^{\prime}} {e_{ac} \lpar \rho \rpar \displaystyle{{e^{-jkR}} \over {R^2 }}dS^{\prime}}.$$
The distance from the observation point to each aperture point can be approximated using a series expansion and keeping the second-order terms of the ratio  $\left({\vec r^{\,\prime}/r} \right)$, being
 $r=\left\vert {\vec r\,} \right\vert $:
 $$R=r\left[{1 - \hat r \cdot \displaystyle{{\vec r^{\,\prime}} \over {r}} + \displaystyle{1 \over 2}\left\vert {\displaystyle{{\vec r^{\,\prime}} \over r}} \right\vert ^2 - \displaystyle{1 \over 4}\left({\displaystyle{{\vec r^{\,\prime} \cdot \hat r} \over r}} \right)^2 } \right].$$
In the far field or the Fraunhofer region (r > 2D 2/λ), only the first two terms are relevant. In focused apertures for millimeter and submillimeter bands it is recommended to use the approximation of the Fresnel region, consisting of using only R = r in the denominator of equation (4) and all the terms in equation (5) for the exponential function. However, when the region of interest is near the boresight direction, the last term of equation (5) can be neglected, since  $\vec r^{\,\prime}$ and
 $\hat r$ are almost perpendicular to each other. At the same time, r can be approximated as z. With such approximations, the transversal electric field can be expressed as:
 $$\mathop{E_T} \limits^{\rightharpoonup}(\mathop{r} \limits^{\rightharpoonup}) =\displaystyle{{jE_0 } \over \lambda }\displaystyle{{e^{-jkz} } \over z}\hat e\int\!\!\!\int_{S^{\prime}} {e_{ac} \lpar \rho \rpar \, e^{ - jk\lpar \rho ^2 /2z\rpar } \, \, e^{jk\lpar \hat r \cdot \vec r^{\,\prime}\rpar } dS^{\prime}} .$$
Equation (6) can be seen as the far field from an aperture which is perturbed by a quadratic phase error that is different for each observation plane with constant z. Since the distribution is circularly symmetric, equation (6) can be expressed by a single integral in the variable ρ in terms of the Bessel function of the first kind and zero order J 0(x) [Reference Milligan21]:
 $$\eqalign{ \mathop{E_T} \limits^{\rightharpoonup}(\mathop{r} \limits^{\rightharpoonup}) &= \displaystyle{{jE_0} \over \lambda} \displaystyle{{e^{- jkz}} \over z}\hat e2\pi \int_0^a {{e_{ac}}(\rho )\,{e^{ - jk({\rho ^2}/2z)}}} \cr & \quad {J_0}(k\rho \sin \theta )\rho \,d\rho .}.$$
Focused aperture antenna showing the focal point F and the focused beam around it.

B) Focused aperture
The focused aperture is characterized for having a phase distribution of the form 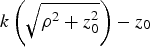 $k\left({\sqrt {\rho ^2+z_0^2 } } \right)- z_0 $, which is enforced to produce a coherent sum of electromagnetic field contributions at a focal point F placed at a distance z 0 in the direction of the aperture axis. In practical situations, a phase distribution like that can be provided, for example, by an ellipsoidal reflector with the feed at the aperture plane and the secondary focus at F [Reference Llombart, Cooper, Dengler, Bryllert and Siegel9]. By considering the diffracted fields, a focused spot beam, as seen in Fig. 1, will be produced around F. When the focal point is placed at the Fresnel region, it is possible to approximate the phase distribution by a series expansion keeping only the second-order term kρ 2/z 0. Using such approximation, the electric field in equation (7) reduces to:
 $$\eqalign{ \mathop{E_T} \limits^{\rightharpoonup}(\mathop{r} \limits^{\rightharpoonup}) &=\displaystyle{{jE_0 } \over \lambda }\displaystyle{{e^{ - jkz} } \over z}\hat e\int_0^a {e_{ac} \lpar \rho \rpar \, e^{jk\lpar \rho ^2 /2\rpar \lpar \lpar 1/z_0 \rpar - \lpar 1/z\rpar \rpar }} \cr & \quad J_0 \lpar k\rho \sin \theta \rpar \rho \, d\rho \,\comma }$$
where e a(ρ) is now an amplitude distribution with real values. By inspecting equation (8) it can be stated that, for focused apertures, the electric field near the axis in the focal plane (z = z 0) has the same properties as the far field, as shown by Shermann [Reference Shermann III11]. The conventional aperture with uniform phase is the limit case, when the focal point tends to be at infinity.
C) Parabolic distribution with taper illumination at the edge
In practical applications, focused apertures are implemented by reflector antennas or arrays with tapered amplitude distributions. This kind of distribution can be represented as [Reference Milligan21]:
 $$f_a \lpar \rho \rpar =p+\lpar 1 - p\rpar \left({1 - \displaystyle{{\rho ^2 } \over {a^2 }}} \right)=1 - \lpar 1 - p\rpar \displaystyle{{\rho ^2 } \over {a^2 }}.$$
In the focal plane, the formulation of the electric field is the same as that of the far field of the uniform phase apertures. Therefore, closed expressions for the electric field, in terms of Bessel functions, can be obtained. In planes different from the focal one, according to equations (6) and (8), the diffracted field is equivalent to the far field affected by a quadratic phase error with root mean square value that increases with the distance from the focal plane.
1) TRANSVERSAL PATTERNS IN THE FOCAL PLANE
The transversal patterns in the focal plane are characterized by the far field form of the radiated field for symmetric circular distributions [Reference Milligan21]:
 $$\eqalign{\mathop{E_T} \limits^{\rightharpoonup}(\mathop{r} \limits^{\rightharpoonup}) &=\displaystyle{{jE_0 } \over \lambda }\displaystyle{{e^{ - jkz} } \over z}\hat e\, 2\pi \int_0^a {\left[{p+\lpar 1 - p\rpar \left({1 - \displaystyle{{\rho ^2 } \over {a^2 }}} \right)} \right]} \cr & \quad J_0 \lpar k\rho \sin \theta \rpar \; \rho \; d\rho .}$$
Taking into account the properties of the Bessel functions [Reference Abramovitz and Stegun24], the transversal electric field can be expressed as:
 $$\mathop{E_T} \limits^{\rightharpoonup}(\mathop{r} \limits^{\rightharpoonup}) =\displaystyle{{jE_0 } \over \lambda }\displaystyle{{e^{ - jkz} } \over z}\hat e\; 2\pi \; a^2 \cdot \left[{p\displaystyle{{J_1 \lpar u\rpar } \over u}+\lpar 1 - p\rpar \displaystyle{{2\; J_2 \lpar u\rpar } \over {u^2 }}\, } \right]\comma \;$$
where
 $$u = ka\displaystyle{{\sqrt {x^2+y^2 } } \over r}.$$
2) AXIAL PATTERN
In the case of the Z axis, since J 0(0) = 1, the condition  $\left({\hat r \cdot \vec r^{\,\prime}=0} \right)$, and using the expression of the tapered distribution in equation (9), equation (8) becomes:
 $$\eqalign{\mathop{E_T} \limits^{\rightharpoonup}(\mathop{r} \limits^{\rightharpoonup}) &=\displaystyle{{jE_0 } \over \lambda }\displaystyle{{e^{ - jkz} } \over z}\hat e\, 2\pi \int_0^a {\left[{1 - \lpar 1 - p\rpar \displaystyle{{\rho ^2 } \over {a^2 }}} \right]} \cr & \quad e^{jk\lpar \rho ^2 {\rm /2}\rpar \lpar \lpar 1/z_0 \rpar - \lpar 1/z\rpar \rpar } \; \rho \; d\rho. }$$
This expression has an analytical solution using the integrals of the form  $\int {x^n e^{\alpha x} dx} $ [Reference Tallarida25]. It is convenient to define the following auxiliary variables:
 $$N_0=\displaystyle{{\, a^2 } \over {\lambda \; z_0 }}\semicolon \; \quad N=\displaystyle{{a^2 } \over {\lambda \; z}}\semicolon \; \quad v=\pi \lpar N_0 - N\rpar.$$
The first one, N 0, is the so-called Fresnel number for the focusing aperture, as introduced by Li in [Reference Li and Wolf16], while N and v depend also on the observation point z. Using such variables, and the analytical solutions of the integrals  $\int {x^n e^{\alpha x} dx}$, the axial field of equation (13) can be written as:
 $$\eqalign{\mathop{E_T} \limits^{\rightharpoonup}(\mathop z) &=jE_0 e^{ - jkz} \hat e\; \lpar \pi \, N_0 - v\rpar \cr & \quad \left\{{\displaystyle{{e^{jv} - 1} \over {jv}} - \lpar 1 - p\rpar \displaystyle{{\lpar 1 - jv\rpar \; e^{jv} - 1} \over {v^2 }}} \right\}.}$$
The relationship between the actual distance variable z and the auxiliary one, v, is given by the following expressions:
 $$v=\pi \, \, N_0 \left({1 - \displaystyle{{z_0 } \over z}} \right)\semicolon \; \quad z=\displaystyle{{z_0 } \over {1 - \lpar v/\pi \, N_0 \rpar }}.$$
III. NUMERICAL RESULTS AND FOCUSED BEAM DESIGN FORMULAS
To illustrate the pattern characteristics of the focused aperture antennas, an aperture model of a reflector antenna similar to the one presented in [Reference Garcia-Pino, Llombart, Gonzalez-Valdes and Rubiños-Lopez10] has been used. It consists of an aperture with diameter 60 cm used to focus a beam at 8 m standoff. The frequency considered in this study is 300 GHz (λ = 1 mm) instead of the 600 GHz case considered in [Reference Garcia-Pino, Llombart, Gonzalez-Valdes and Rubiños-Lopez10].
Figure 2 shows the calculated electric field amplitude for the selected geometry. The beam is shown in an area of 200 × 200 cm centered in the focus placed at (0, 0, 8) m. The beam has a very narrow beamwidth in X, while it is much wider in the Z direction. From the point of view of the applications requiring focusing, such as the imaging radar, this means that some margin exists (between 750 and 850 cm) for the standoff distance in which the imaging radar is usable. In Fig. 2(a) the electric field has been computed using equation (8) with an aperture model, while in Fig. 2(b) an equivalent problem has been solved using a Physical Optics code [Reference Martinez-Lorenzo, García Pino, Vega, Arias and Rubiños26] to obtain the scattered field of an ellipsoidal reflector with the same aperture area and an inter-focal length of 8 m. The reflector illumination is also presented in Fig. 2(b). Good agreement between the analytical and computational models is obtained.
Focused beam in real dimensions for an aperture size of 60 cm at 300 GHz with a focal distance z 0 = 8 m and a taper edge illumination of −10 dB. (a) Using the analytical model; (b) results using the ICARA Physical Optics code with an ellipsoidal reflector with the same aperture area and inter-focal length of 8 m. Reflector illumination is presented in the top left corner.
In Fig. 3, the beam is represented in a non-equal scale of 6 × 300 cm, showing the label of the relative amplitude of the electric field. The reference level of magnitude 1 has been taken at the focal point in the Z axis at 8 m from the aperture. The level of relative magnitude 0.7 for the electric field allows obtaining the −3 dB beamwidth. It is remarkable that the maximum is not exactly at the focal point, but it is slightly displaced towards the aperture. This effect is known as the focal shift [Reference Hansen13, Reference Li and Wolf16–Reference Li20]. It can be qualitatively deduced by inspecting equation (15): although the factor in brackets is an even function with its maximum at v = 0, when multiplying it by (πN 0 − v) the maximum is shifted to a negative value of v. This means that the maximum value appears closer to the aperture than the nominal distance z 0.
Focused beam in non-equal dimensions showing relative electric field intensity for an aperture size of 60 cm at 300 GHz with a focal distance z 0 = 8 m and a taper edge illumination of −10 dB.
Figure 4 shows the axial pattern along the Z-axis, where the focal shift effect can be observed. Two cases have been plotted in Fig. 4: the uniform amplitude distribution (p = 1) and the tapered distribution with 10 dB decay at the edge of the aperture (p = 0.316). In both cases the results of the analytical expression in equation (15) have been compared with the results of the numerical computation of the integral in equation (13).
Axial beam pattern showing the beam shift for the uniform case (p = 1) and the −10 dB tapered illumination (p = 0.316).
Figure 5 shows the transversal patterns (for uniform amplitude distribution) at different Z values between 7 and 9 m, including the focal plane (8 m) and the plane of the maximum electric field (7.92 m). The effect of the filled nulls associated to the quadratic error described in equation (6) can be observed.
Transversal pattern in different planes with constant z value for the uniform amplitude case (p = 1).
Figure 6 shows the transversal pattern in the focal plane for different values of the taper value p. As expected, the narrowest beamwidth occurs for the uniform case (p = 1) while the beamwidth increases for smaller values of p.
Transversal patterns in the focal plane for different edge taper illumination.
In the following subsections some guidance for the computation of main beam parameters for focused aperture design is given.
A) Axial focal shift
The width of the lobes of the electric field described by equation (15) and illustrated in Fig. 4 has an inverse linear relationship with N 0: the greater N 0, the narrower lobes. The deviation of the maximum can be obtained by finding numerically the v-coordinate, v p, of the maximum of the electric field described by equation (13). Figure 7(a) represents the product (v p·N 0) as a function of N 0 for different values of p. For growing values of N 0, the product of N 0 times the beam shift v p tends to be constant. The value of such constant has been found to be b p times (12/π), where b p is a factor depending on p. As a consequence:
 $$v_p=b_p \displaystyle{{12} \over {\pi N_0 }}.$$
A simple exponential approximation has been found for b p (when N 0 is large enough) as follows:
 $$b_p=1+\displaystyle{{e^{ - 5p} } \over 2}.$$
In Fig. 7(b) the value of b p is represented for different values of N 0 as a function of p. The value of the exponential approximation for b p is also plotted, showing that it is a good approximation when N 0 ≥ 10. For smaller values, the b p factor can be obtained from Fig. 7(a). Taking into account equations (17) and (18), and the relationship between z and v established in equation (16), the z coordinate of the maximum, z p, can be calculated. The relative beam shift can be written as:
 $$\displaystyle{{z_p - z_0 } \over {z_0 }}=\displaystyle{{ - 1} \over {1+\left({\pi ^2 N_0^2 /12\, b_p } \right)}}.$$
The previous expression is a generalization of that reported in [Reference Li and Wolf16], referred as “focal shift” for the uniform case (b p = 1).
Focal shift for focused apertures: (a) product of the peak value v p times N 0 and (b) beam shift factor b p.
B) Axial beamwidth
The 3 dB beamwidth of the axial pattern has been also numerically obtained. Figure 8(a) shows the axial beamwidth in the variable v (BW v) as a function of N 0 for different values of p. The beamwidth tends to be constant when N 0 > 20. This constant is minimum for the uniform illumination (p = 1), with a value of BW v(p=1) = 5.56. For other values of p, the beamwidth can be expressed as BW v = b v·5.56, where b v is represented in Fig. 8(b) and can be approximated as:
 $$b_v=1+\displaystyle{{e^{ - 5p} } \over 4}.$$
The beamwidth in terms of z can be approximately established with the transformation expressed in equation (16) by considering that the beamwidth is approximately symmetric about the peak value v p. Under this assumption:
 $$\displaystyle{{BW_Z } \over {z_0 }}=\displaystyle{{\lpar BW_V /N_0 \pi \rpar } \over {\left({1 - \left({12\, b_p /\pi ^2 N_0^2 } \right)} \right)^2 - \lpar BW_V /2N_0 \pi \rpar ^2 }}.$$
For high values of N 0, equation (21) is simplified to
 $$\displaystyle{{BW_Z } \over {z_0 }} \cong \displaystyle{{BW_V } \over {N_0 \pi }}.$$
By substituting equation (20) in equation (22), the axial beamwidth in terms of z can be written as:
 $$\displaystyle{{BW_Z } \over {z_0 }} \cong \displaystyle{{5.56} \over {N_0 \pi }}\left({1+\displaystyle{{e^{ - 5p} } \over 4}} \right).$$
Axial 3 dB beamwidth for focused apertures: (a) beamwidth in the v variable and (b) beamwidth factor b v.
C) Transversal beamwidth
The 3 dB beamwidth of the transversal pattern in the focal plane can be first studied in terms of the variable u, as defined in equation (12). Since the pattern of equation (11) is normalized and equivalent to that of the far field response, the beamwidth in terms of u is uniquely determined depending only on p. Figure 9 shows the transversal beamwidth b u, numerically computed and approximated by the following polynomial approximation between the value extremes of 3.227 (for p = 1) and 3.982 (for p = 0):
 $$b_u=3.972 - 1.73\; p^2+1.612\; p - 0.633\; p^3.$$
The beamwidth in terms of the transversal variable (x or y) is:
 $$BW_T=\displaystyle{{b_u \lambda } \over {2\pi \, a}}z_0=b_t \displaystyle{\lambda \over {2a}}z_0\comma \;$$
where b t = b u/π varies from 1.027 to 1.268. Equation (25) has been reported in the literature using the same approximation used for the beamwidth of apertures in the far field (see for example [Reference Garcia-Pino, Llombart, Gonzalez-Valdes and Rubiños-Lopez10]).
IV. IMPACT ON THE BEAM OF THE PHASE DISTRIBUTION
As stated in Section II.B, a phase distribution across the aperture of the form in equation (9) is needed to focus the beam at a distance z 0. Another phase function can be added to model antenna misalignments or another intentionally implemented effect such as the beam scanning or axial refocusing. The impacts of the main phase effects on the focused beam are summarized next. According to [Reference Dragone27], the phase across the aperture of a reflector antenna could be expressed (using only the first and second-order terms) as:
 $$\eqalign{&\Phi (\rho ,\varphi ) \cong - \displaystyle{{2\pi } \over \lambda }L(\rho ,\varphi ); \cr & L(\rho ,\varphi ) = {L_0} + \displaystyle{{{\Delta _S}} \over {{z_0}}}\rho \cos (\varphi - {\phi _S}) \cr & \quad\quad\quad\quad + \displaystyle{{{\Delta _Q}} \over {2z_0^2 }}{\rho ^2} + \displaystyle{{{\Delta _A}} \over {2z_0^2 }}{\rho ^2}\cos 2(\varphi - {\phi _A}) + \cdots .}$$
The constant value L 0 represents the main path length from the antenna phase center to the focal point at the observation region.
The next term, characterized by ΔS and φ S means a beam scanning at the focal plane of distance ΔS in the direction determined by φ S. Simultaneously, the beam is tilted axially toward the direction from the aperture center to the displaced main beam. As a consequence, the transversal electric field intensity is slightly diminished. Figure 10 shows an example of beam deviation of 30 cm in the X direction for the numerical example of Section III with uniform amplitude.
Scanned beam 30 cm up along the X axis: (a) ZX cut showing the beam deviation and tilting and (b) YX cut showing the beam deviation.
The quadratic term ΔQ, since is of the same form than the focusing phase kρ 2/2z 0, produces an axial focal shift. The new focal location z 0′ is determined by:
 $$\displaystyle{1 \over {z_0 ^{\prime}}}=\displaystyle{1 \over {z_0 }} - \displaystyle{{2\Delta _Q } \over {z_0^2 }} \Rightarrow z_0 ^{\prime}=\displaystyle{{z_0 } \over {1 - \lpar \Delta _Q /z_0 \rpar }}.$$
For positive values of ΔQ, the focal plane is shifted farther from the aperture (z 0′ > z 0) and for negative values of ΔQ the displaced focal plane is closer to the aperture (z 0′ > z 0).
The effect of the astigmatic term ΔA is equivalent to a positive focal shift for the plane determined by the angle φ A and φ A + π, whereas a negative focal shift occurs for the cross plane described by φ A + π/2 and φ A + 3π/2. The result consists of crossed elliptical beams at each side of the focal plane and a wider beam in the focal point. Figure 11 shows this effect with the numerical example of Section III by introducing an astigmatism coefficient of ΔA = 30 cm. The astigmatism effect moves the focal location to 8.312 m in one plane and 7.711 m in the other plane.
Astigmatic beams in different planes: (a) 7.711 m, (b) 8 m and (c) 8.312 m.
V. CONCLUSION
The focused aperture antenna model is of great interest for radar imaging applications in millimeter and submillimeter bands. An analytical model has been introduced to achieve closed expressions to predict the main parameters of the spot beams that are generated in these systems: focal shift, axial beamwidth (useful to establish the range limits), and transversal beamwidth (useful to predict the available resolution). The impact of first and second-order phase distributions has been also addressed showing the scanning and axial refocusing effects, as well as the astigmatic aberration for focused spot beams.
ACKNOWLEDGEMENT
This work is partially supported by the European Regional Development Fund (ERDF), by the Spanish National Research and Development Program under projects TEC2011-28683-C02-02, Terasense CSD2008-00068 (Consolider-Ingenio 2010), and TACTICA, and by the Galician Regional Government under projects CN2012/279, CN2012/260 (AtlantTIC), and the PlanI2C (2011–2015). I would like to thank Dr. Borja González Valdés, Mrs. Yolanda Rodríguez Vaqueiro and Mr. Kyle Swartz for their help in the production of some of the figures and the English proof reading.
 Antonio Garcia-Pino was born in Valdemoro, Madrid, Spain, in 1962. He received his M.S. degree in 1985 and Ph.D. degree in 1989, both in Telecommunications Engineering from the Polytechnic University of Madrid (UPM). From 1985 to 1989 he was with the Radiation Group of UPM as a Research Assistant. He joined the Department of Technologies of Communications at the University of Vigo (Spain) as Associate Professor in 1989, becoming full Professor in 1994. During 1993 he was a Visiting Researcher at the Center for Electromagnetics Research, Northeastern University, Boston. His research interests include shaped reflector antennas for communication and radar applications and THz technology. He became a senior member of IEEE in 2005. From 2003 to 2006, he was responsible for doctoral studies, and from 2006 to 2010 he was Vice-Rector of Academic Organization and Faculty, at the University of Vigo.