I. INTRODUCTION
Ferrite materials have been the subject of numerous investigations for many years due to their wide range of applications in the fields of electronics, optoelectronics, magnetics, magneto-electronics, and electrochemical science and technology.Reference Chikazumi1–Reference Sileo, Silvia and Jacobo24 Cobalt (Co) ferrites, particularly, have been studied extensively in recent years because of their remarkable properties such as high saturation magnetization, large permeability at high frequency, and remarkably high electrical resistivity.Reference Gu, Xiang, Fan and Li6–Reference Cheng, Liao, Kuang, Xu, Yan, Chen, Zhao and Liu8 Because of their low eddy current losses, they are the only material with such wide-ranging value to electronic applications in terms of power generation, conditioning, and conversion.Reference Eerenstein, Mathur and Scott9 These properties also make them unique for application in microwave devices that require strong coupling to electromagnetic signal.Reference Khomskii10 Recently, ferrite compounds have drawn considerable attention for their potential application as electrode materials in Li-ion batteries and solid oxide fuel cells.Reference Hill11–Reference Gunjakar, More, Shinde and Lokhande19 It has been reported that the transition metal ferrites with spinel structure such as NiCo2O4, NiFe2O4 and CoFe2O4, CuFe2O4 were used as candidates for cathode materials of lithium batteries.Reference Kadam, Kanamadi, Patankar and Chougule14–Reference Gunjakar, More, Shinde and Lokhande19
The structural, electrical, and dielectric properties of Co ferrites play a key role in the designing of magnetic, electronic, microwave, and electrochemical devices. For instance, capacitors, batteries, rf circuits, high-quality filters, antennas, transformer cores, read/write heads for high-speed digital tapes, and operating devices require controlled electrical properties of Co ferrites.Reference Nuli and Qin20–Reference Sileo, Silvia and Jacobo24 Improved electrical properties, specifically enhancement in the electrical and dielectric property of Co ferrites, would be advantageous in such applications. Based on the recent observations that the Co ferrites with better electronic and magnetic performances also served as better candidates for Li batteries and supercapacitors, such enhancement is expected to improve the efficiency if used for electrochemical device applications. However, the electrical properties of a Co ferrite at room temperature are dependent on the exact chemical composition, firing temperature (if any), reactive/processing atmosphere, and the ions that substitute for Fe3+/Fe2+ ions.Reference Chikazumi1, Reference Smith and Wijn2
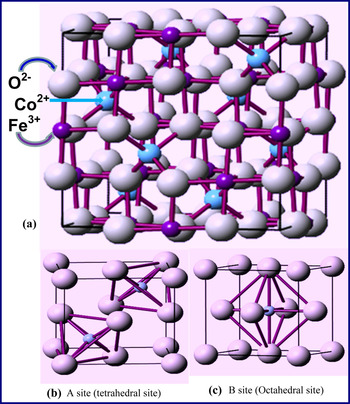
In Co ferrite, the relatively large oxygen ions form a face-centered cubic (fcc) lattice. In this cubic close-packed structure two kind of interstitial sites occur, the tetrahedral (A) and the octahedral (B) sites, which are surrounded by four and six oxygen ions, respectively (Fig. 1). In the aforementioned cubic unit cell, 64 tetrahedral sites and 32 octahedral sites are present, of which only 8 and 16, respectively, are occupied by metal ions [Fig. 1(a)].Reference Chikazumi1, Reference Smith and Wijn2 The tetrahedral (A) sites [Fig. 1(b)] are occupied by the Fe3+ ions, and the octahedral (B) sites [Fig. 1(c)] are occupied by the Co2+ and Fe3+, in equal proportions. The angle A–O–B is closer to 180° than the angles B–O–B and A–O–A, and therefore the AB pair (Fe–Fe) has a strong superexchange (antiferromagnetic) interaction.Reference Chikazumi1–Reference Vereda, de Vicente and Hidalgo-Álvarez3
(a) Inverse spinel structure of CoO.Fe1.925La0.075O3. (b) The tetrahedral and (c) octahedral network built by O ions is also shown.

Partial substitution of Fe3+ by rare earth ion in the spinel structure has been reported to lead to structural distortionReference Gu, Xiang, Fan and Li6, Reference Cheng, Liao, Kuang, Xu, Yan, Chen, Zhao and Liu8, Reference Ajmal and Maqsood25 that induces strains and significantly modifies the electrical and dielectric properties. It has been reported that inclusion of Zn, Cu, Co, and Cd in ferritesReference Devan, Kolekar and Chougule26, Reference Larson and Von Dreele27 leads to an increase in the dielectric constant because of the formation of excess Fe2+, which leads to increase in hopping of electrons between Fe2+ and Fe3+. However, transition metal (TM) ion doping and/or substitution results in semiconductor behavior of the ferrites that is not useful for microwave and electrochemical devices. In the present work an attempt has been made to study the effect of La rare earth ion doping on the structural, electrical, and dielectric properties of Co ferrite. The obvious relevance of the work is to examine whether the dielectric constant of these materials can be enhanced compared with pure Co ferrite while retaining their insulating nature. In addition, to the best of our knowledge, there are no existing reports on the effect of La substitution on the electrical and dielectric properties of Co ferrite. Therefore, such an investigation is expected to contribute significantly to our current understanding of the rare earth ion substitution in Co ferrites. Interestingly, we found that substitution of a small amount of La ions for Fe improves the electrical and dielectric properties of the Co ferrite. The results obtained are presented, and the effect of partial substitution of Fe3+ by La3+ (at B site) on the electrical resistivity and dielectric properties of Co ferrite along with a simple model to account for the observed property improvement are discussed in this paper.
II. EXPERIMENTAL DETAILS
The polycrystalline materials were prepared starting from 99.99% pure CoO, Fe2O3, and La2O3 by the conventional solid-state chemical reaction method. Appropriate amounts of powders of the starting materials were ground in a mortar and pestle for 1 h, and the mixtures were heat treated in air at 1200 °C for 12 h. For the electrical and dielectric measurements the powders were made into pellets that were then sintered at 1250 °C in air for 12 h. Structural characterization was performed by obtaining the powder x-ray diffraction (XRD) patterns using Cu Kα radiation. The measurements were performed at room temperature using a PANalytical (Natick, Ma) (X’pert PRO) x-ray diffractometer employing Cu Kα radiation (1.54 Å). Surface morphology, elemental mapping, and EDS analysis were performed using a high-performance and ultrahigh-resolution scanning electron microscope (Hitachi S-4800, San Jose, CA). Sample was prepared by dispersing CoO.Fe1.925La0.075O3 on carbon tape that was mounted on an Al stub. Direct-current (DC) electrical resistivity measurements were carried out under the vacuum of 10−2 Torr by two-probe method in the temperature range 160 to 300 K using a closed-cycle refrigerator (CCR). Resistance was measured by a Keithley electrometer. The temperature was measured using a silicon diode sensor and a Lakeshore temperature controller (Model No. 330). Dielectric measurements were carried out at room temperature with a LCR meter.
III. RESULTS AND DISCUSSION
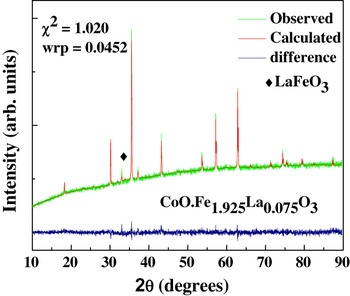
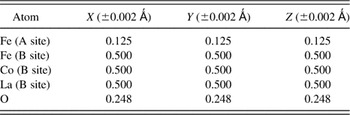
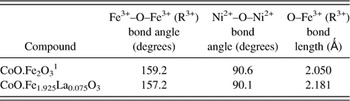
The XRD pattern obtained for CoO.Fe1.925La0.075O3 is presented in Fig. 2. The calculated patterns after the Rietveld refinement carried out using the GSAS programReference Dunitz and Orgel28 are also shown (Fig. 2). The weighted refined parameter (wrp) and the χ2 (goodness-of-the fit) values of the fitting as indicated. XRD data indicate that the CoO.Fe1.925La0.075O3 material also crystallizes in the inverse spinel phase in a manner similar to that of CoO.Fe2O3. Small amount of LaFeO3 secondary phase can be seen (Fig. 2). However, the secondary phase formation progressed with increasing La doping, and we found that the composition CoO.Fe1.925La0.075O3 was optimum to restrict or eliminate the effect of secondary phase. The weight fractions of the inverse spinel phase and LaFeO3 are determined to be 0.935 and 0.065, respectively. Refined atomic positions and are listed in Table I. The lattice constant determined from XRD for CoO.Fe1.925La0.075O3 is 8.401 Å (±0.001 Å), which is higher in magnitude than that of pure Co ferrite (8.387 Å, ±0.001 Å).Reference Smith and Wijn2 The lattice expansion can be attributed to the ionic size difference in the La3+ ions substituting the Fe3+ ions. The ionic size of La3+ (1.03 Å) is greater than that of Fe3+ (0.67 Å) and induces a lattice distortion upon substitution of Fe lattice sites in CoO.Fe2O3. The distortion in the lattice upon the substitution of Fe by La in the B site is evident from the changes in Fe–O–Fe, La–O–Fe, La–O–Co bond angles and bond lengths in the B site compared with pure CoO.Fe2O3Reference Chikazumi1, Reference Smith and Wijn2 as presented in Table II.
XRD pattern of CoO.Fe1.925La0.075O3; the experimental and calculated pattern along with the difference is shown.

Refined atomic position values of CoO.Fe1.925La0.075O3 and CoO.Fe1.925Dy0.075O3.

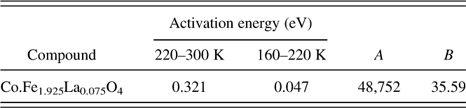
Bond angle, bond length, activation energy values, A and B parameter values of CoO.Fe1.925La0.075O3 and CoO.Fe1.925Dy0.075O3.

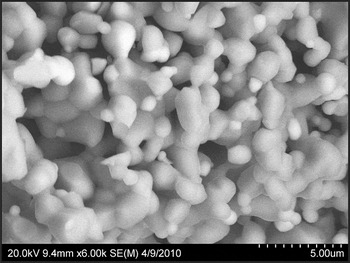
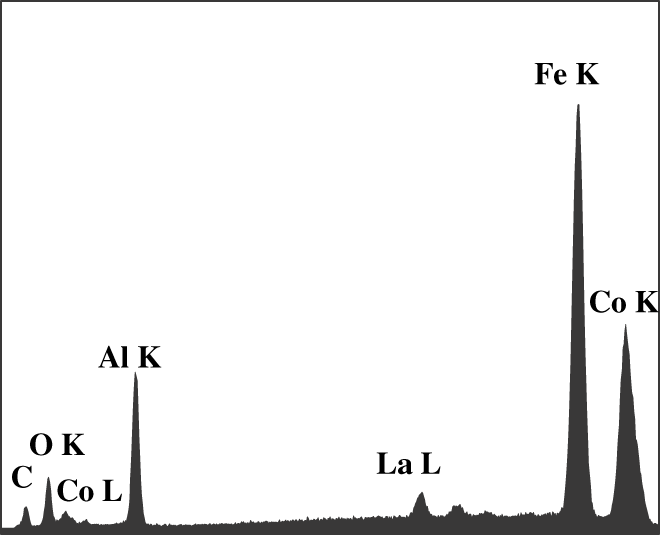
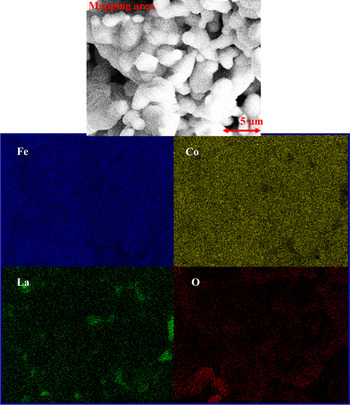
The morphology of the sample is represented in the SEM image shown in Fig. 3. It is evident that the crystallites are uniformly distributed. The presence of smooth grain boundaries can also be seen in the SEM image. The EDS measurements indicate that the grown materials are stoichiometric and homogeneous with a uniform distribution. The characteristic peaks of Fe, Co, La, and O are evident in EDS of CoO.Fe1.925La0.075O3 shown in Fig. 4. X-ray energy is characteristic of generating atoms, and, therefore, detection of x-rays emitted provides the signature of the atoms present.Reference Ramana, Ait-Salah, Utsunomiya, Morhange, Maugher, Gendron and Julien29, Reference Ramana, Ait-Salah, Utsunomiya, Becker, Mauger, Gendron and Julien30 Therefore, EDS measurements can be used to qualitatively discuss the chemical quality of CoO.Fe1.925La0.075O3. The lines identified are Fe Kα, Co Kα, O Kα, La Lα, and Co Lα at their respective energy positions, indicating that the x-rays are only due to Fe, Co, La, and O. X-ray lines from the Al grid and carbon tape can also be seen (Fig. 4), which is hard to eliminate but can be used as a reference. Elemental mapping images of CoO.Fe1.925La0.075O3 are shown in Fig. 5. The images labeled Fe, Co, La, and O are those obtained for respective elements in the particle. These images are uniform over the particle examined. X-rays emit from Fe, Co, La, and O at the same location and region, indicating the chemical homogeneity.
SEM image of CoO.Fe1.925La0.075O3. The uniform distribution of the grains can be seen in the image.

EDS spectrum of CoO.Fe1.925La0.075O3 powders grown by solid-state reaction method. The spectrum exhibits the characteristic peaks of Fe, Co, La, and O present in the sample. The x-ray lines are as indicated at their respective energy positions.

Mapping image of CoO.Fe1.925La0.075O3 powders grown by solid-state reaction method. The images labeled Fe, Co, La, and O represent the elemental mapping of the respective elements.

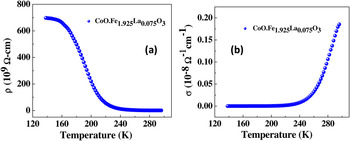
The temperature variation of DC electrical resistivity of CoO.Fe1.925La0.075O3 is shown in Fig. 6(a). The electrical conductivity of CoO.Fe1.925La0.075O3 at 300 K is 0.623 × 10⁻⁸ Ω−1 cm−1 and decreases exponentially with decreasing temperature from 300 to 160 K, indicating the typical behavior of insulators. Conductivity in ferrites is due to both hopping of electronsReference Fujiwara, Tada, Nakagawa and Abe33 and charge transport via excited states, and it can be expressed asReference Mott and Davis31, Reference Hutchins, Abu-Alkhair, El-Nahass and Abdel Hady32

(a) Temperature variation of resistivity CoO.Fe1.925La0.075O3. (b) σ versus T plot of CoO.Fe1.925Dy0.075O3. Two different slope regions are evident in both the curves.

where E 1 is the activation energy for intrinsic conduction and E 2, E 3, … are the activation energies needed for hopping conduction. A 1, A 2, and A 3 are constants, and k B is the Boltzmann constant. The σ versus 1000/T plot [Fig. 6(b)] shows two different slopes for CoO.Fe1.925La0.075O3, indicating that the conduction is through an activated process having two types conduction mechanisms. Activation energy (E a) values at different temperature ranges (300–220 K and 220–160 K) calculated from the ln σ versus 1000/T plot are listed in Table III. E a is found to be higher in the 300–220 K region (0.321 eV) than that in the 220–160 K region (0.047 eV). Decreasing E a with decreasing temperature has been typically explained by small-polaron theory.Reference Mott and Davis31 The VRHReference Hutchins, Abu-Alkhair, El-Nahass and Abdel Hady32 model of small polarons also predicts continuously decreasing E a with decreasing temperature. The activation energy value of Co.Fe1.925La0.075O4 in the temperature range 160–220 K is 0.047 eV, which is less compared with the activation energy value at the high-temperature region 220–300 K. E (0.047 eV) ≫ kT, and hence the system is in steady-state equilibrium condition. In the low-temperature regime, the energy-conserving processes that involve the absorption of the minimum amount of vibrational energy provide the dominant contribution to the thermally activated jump rates. At sufficiently high temperatures, multiphonon processes dominate the transition rate; the high-temperature jump rates are also activated.
Activation energy values, A and B parameter values of CoO.Fe1.925La0.075O3.

To obtain a clear distinction between the two conduction mechanisms [two different slopes in Figs. 6(a) and 6(b)], both the models were taken into account to fit the electrical conductivity data, namely the small-polaron model and the VRH model.Reference Mott and Davis31, Reference Hutchins, Abu-Alkhair, El-Nahass and Abdel Hady32 In the temperature regime 220–300 K, the conductivity data can be interpreted in terms of the phonon-assisted hopping model given by Mott:

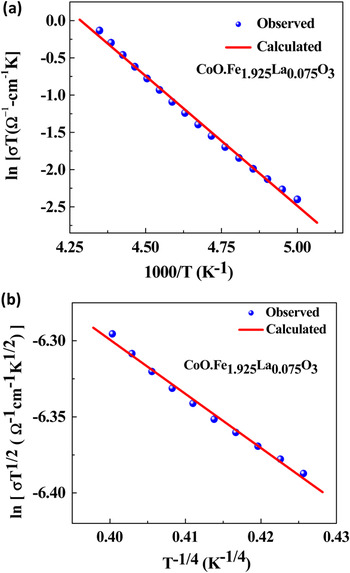
where νph is the optical phonon frequency, c is the fraction of reduced transition metal ions (the ratio of TM ion concentration in the low valence state to the total concentration of TM ions), R is the average spacing between the TM ions, α is the localization length, and E is the activation energy. Figure 7(a) shows the plot between ln σT and 1000/T. The parameters νph, R, and E calculated from the plot are given in Table III. Assuming a strong electron–phonon interaction, MottReference Mott and Davis31, Reference Hutchins, Abu-Alkhair, El-Nahass and Abdel Hady32, Reference Gangopadhyay, De and Das34, Reference Ambily and Menon35 proposed that


(a) Relation between ln σT and 1000/T of CoO.Fe1.925La0.075O3. Experimental observed data and calculated plots are as presented. An excellent fit can be seen in the temperature range 300–220 K suggests the applicability of small-polaron model. (b) ln(σ T 1/2) versus T −1/4 plot of CoO.Fe1.925La0.075O3. Experimental observed data and calculated plots are as presented. An excellent fit can be seen in the temperature range 220–160, suggesting the applicability of VRH.

where E H is the polaron hopping energy, E D is the disorder energy arising from the energy difference of neighbors between two hopping sites, and θD is the Debye temperature. The polaron radius can be calculated using the formulaReference Mott and Davis31, Reference Hutchins, Abu-Alkhair, El-Nahass and Abdel Hady32

where R is the d spacing, which is 0.2 nm in the present case. Value of r p was found to be 0.10 nm. The procedure suggested by Greaves as a modification of Mott’s model of VRH could be applied in the second temperature regime (160–220 K), where σ follows:

where A and B are constants and B is expressed as

N(E F) is the density of localized states at E F and α−1 is the decay constant of the wave function of localized states at E F. Variable range hopping model seems to be valid in the temperature range 160–220 K and a good fit of the experimental data to Eq. (6) is shown in Fig. 7(b) [ln(σT 1/2) versus T −1/4 plot]. The parameters A and B calculated from this curve are presented in Table III. The density of localized states at the Fermi level, N(E F), is ~1022, which is in good agreement with those reported for ferrites. α−1 has been calculated using Eq. (7), and it was found to be ~3.9 nm.
A good fit of the Mott’s VRH model has been verified by calculating the hopping parameters and the Mott’s requirements (R hopα ≥ 1 and E hop > k BT). Here R hop and E hop are temperature-dependent hopping distance and average polaron hopping energy, respectively.


The calculated average values of R hop and E hop at 200 K for both the compounds are found to be 0.27 nm and 1.2 eV. The values of R hopα and E hop are found to be 4.68 and 1.2 eV, respectively. The requirements (R hopα ≥ 1 and E hop > k BT) are clearly satisfied.
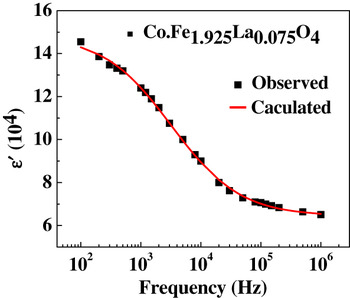
The dispersion of the real part of the dielectric constant (ε′) is shown in Fig. 8. It can be seen from the figure that ε′ decreases with increasing frequency. The decrease of ε′ with increasing frequency is typical dielectric behavior of spinel ferrites. The dispersion of ε′can be explained based on the contributions from various sources of polarizations.Reference Cole and Cole36, Reference Anderson37 The larger value of ε′ at lower frequencies, perhaps, could be due to all the contributions (i.e., atomic, electronic, ionic, interfacial, and grain boundaries). The decrease (and disappearance finally) in ionic and orientation polarizability with increasing frequency may be responsible for the decrease in ε′ at higher frequencies. Since more than one ion (O2−, R3+, and Fe3+ ions) contributes to the relaxation process, the data were fit to the modified Debye’s function, which takes the possibility of more than one ion contributing to the relaxation.Reference Cole and Cole36 The observed dispersion of ε′ can be modeled using the equation:

Frequency variation of dielectric constant of CoO.Fe1.925La0.075O3. It can be seen that the experimental data fit well to the model (see text).

where ε′ is the real part of the dielectric constant, ε∝ is the dielectric constant at 1 MHz, τ is the mean relaxation time (τ = 0.434 μs for CoO.Fe1.925La0.075O3), and α is the spreading factor of the actual relaxation times about the mean value (0.56). The larger values of the mean relaxation time in CoO.Fe1.925La0.075O3 can be attributed to the observed increase in the bond length (Table II) with the inclusion of larger La3+ ions.
The values of ε′ (at 1 kHz) in La3+ is 14.5 × 10⁴, which is higher than that of pure cobalt ferrite.Reference Manova, Kunev, Paneva, Mitov and Petrov15 The increase in the ε′ with the inclusion of La3+ could be due to the fact that the Co ferrite lattice becomes non-centrosymmetric upon substitution, giving rise to the atomic polarizability. In ferrites, rotation displacement of dipoles with the application of electric field results in orientation polarization. Rotation of dipoles may be visualized as the exchange of electrons between the ions so that the dipoles align themselves in response to the alternating field. The existence of inertia to the charge movement would cause relaxation of the polarization. In addition, formation of a small amount of the respective LaFeO3 phase at the grain boundaries leads to the piling up of charges at the grain boundaries, and this results in the interfacial polarization.Reference Anderson37 A decrease in ε′ with increasing frequency is due to the fact the dipole lags behind the applied field at higher frequencies.
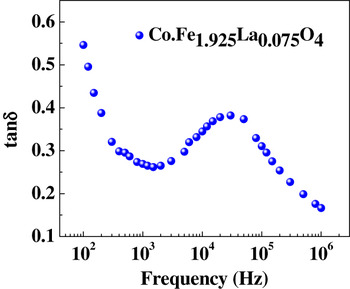
The frequency variation of tan δ is shown in Fig. 9. It is evident that the dielectric loss decreases initially with frequency, and a resonance peak is observed at 30 kHz. The resonance takes place when jumping frequency of the localized charge carriers becomes approximately equal to that of the applied alternating current (AC) field. Dielectric loss arises if the polarization lags behind the applied alternating field and is caused by the presence of the small secondary phase LaFeO3 (impurity phase). The low-dielectric loss obtained in the present case is attributed to a more structurally perfect and homogeneous sample, which in turn depends on the composition and sintering temperature of the samples.
Frequency variation of dielectric loss of CoO.Fe1.925La0.075O3.

IV. SUMMARY AND CONCLUSIONS
Improved electrical and dielectric properties are demonstrated in CoO.Fe1.925La0.075O3 when compared with pure Co ferrite. The effect is attributed to the structural changes induced by the substitution of La3+ ions for Fe3+ ions at the B site. The lattice parameter of CoO.Fe1.925La0.075O3 determined from XRD is 8.401 Å (±0.001 Å), which is higher than that reported for CoO.Fe2O3 (8.387 Å, ±0.001 Å). While the enhanced dielectric constant and improved electrical resistivity are evident in the data, key is the optimum composition without impurity phase formation as presented in this work. The dielectric constant dispersion of CoO.Fe1.925La0.075O3 fits to the modified Debye’s function with more than one ion contributing to the relaxation. Temperature-dependent electrical conductivity exhibits two distinct regions corresponding to the small polaron (220–300 K) and variable-range-hopping (160–220 K) mechanisms.
ACKNOWLEDGMENT
The authors acknowledge with pleasure the support from Lockheed Martin Co. (LMC) to perform the work presented in this paper.