





Introduction
Obsessive-compulsive disorder (OCD) is a common and debilitating mental illness characterized by persistent intrusive thoughts (obsessions) and repetitive behaviors (compulsions), affecting approximately 2%–3% of the population and leading to significant substantial functional impairment (Goodman, Storch, & Sheth, Reference Goodman, Storch and Sheth2021; Suhas & Rao, Reference Suhas and Rao2019). Accumulating evidence suggests that deficits in inhibitory control represent a core cognitive feature of OCD (Morein-Zamir, Fineberg, Robbins, & Sahakian, Reference Morein-Zamir, Fineberg, Robbins and Sahakian2010; Penadés et al., Reference Penadés, Catalán, Rubia, Andrés, Salamero and Gastó2007).
Inhibitory control refers to the ability to suppress automatic or prepotent responses in order to achieve goal-directed behavior (Fiske & Holmboe, Reference Fiske and Holmboe2019) and encompasses two distinct domains: cognitive inhibition and response inhibition (Goodman, Storch, & Sheth, Reference Goodman, Storch and Sheth2021). Cognitive inhibition involves suppressing irrelevant or interfering information and is commonly assessed using tasks such as the Stroop paradigm, whereas response inhibition refers to the suppression of motor responses and is typically measured using go/no-go or stop-signal tasks (SSTs) (Bari & Robbins, Reference Bari and Robbins2013; van Velzen, Vriend, de Wit, & van den Heuvel, Reference van Velzen, Vriend, de Wit and van den Heuvel2014). While deficits in response inhibition have been consistently observed in OCD patients (Mar et al., Reference Mar, Townes, Pechlivanoglou, Arnold and Schachar2022), findings regarding cognitive inhibition remain mixed (Doolub et al., Reference Doolub, Vibert, Botta, Razmkon, Bouquet, Wassouf and Jaafari2023; Martínez-Esparza et al., Reference Martínez-Esparza, Olivares-Olivares, Rosa-Alcázar, Rosa-Alcázar and Storch2021). These inconsistencies may partly reflect differences in task design and the modulatory influence of emotional cues. The threat-related hypothesis of OCD proposes heightened sensitivity to threatening stimuli (Beck & Clark, Reference Beck and Clark1997), underscoring the importance of examining cognitive inhibition under emotional conditions.
Neuroimaging studies indicate that cognitive and response inhibition rely on overlapping yet distinct neural systems, including frontostriatal and frontoparietal circuits (Hung, Gaillard, Yarmak, & Arsalidou, Reference Hung, Gaillard, Yarmak and Arsalidou2018; Isherwood, Keuken, Bazin, & Forstmann, Reference Isherwood, Keuken, Bazin and Forstmann2021). In OCD patients, dysfunction in the frontostriatal circuit correlates with inhibitory control deficits (Huyser et al., Reference Huyser, Veltman, Wolters, de Haan and Boer2011; Marsh et al., Reference Marsh, Horga, Parashar, Wang, Peterson and Simpson2014). However, despite accumulating neuroimaging evidence, the spatiotemporal dynamics of neural mechanisms underlying different inhibitory domains in OCD remain unclear.
Electroencephalogram (EEG) microstate analysis provides a powerful approach for characterizing sub-second neural dynamics across large-scale brain networks (Lehmann, Ozaki, & Pal, Reference Lehmann, Ozaki and Pal1987; Michel & Koenig, Reference Michel and Koenig2018). Microstates typically comprise four to eight distinct types, with state transitions occurring within approximately 80–120 milliseconds. The widely used four-class EEG microstate model captures sub-second transitions and corresponds to major resting-state networks, including the auditory, visual, default mode, and dorsal attention systems (Rieger, Diaz Hernandez, Baenninger, & Koenig, Reference Rieger, Diaz Hernandez, Baenninger and Koenig2016; Yuan et al., Reference Yuan, Zotev, Phillips, Drevets and Bodurka2012). Given extensive evidence of default mode network (DMN) dysregulation and frontoparietal circuit abnormalities in OCD (Beucke et al., Reference Beucke, Sepulcre, Talukdar, Linnman, Zschenderlein, Endrass and Kathmann2013; Stein et al., Reference Stein, Costa, Lochner, Miguel, Reddy, Shavitt and Simpson2019), this network-level mapping provides a theoretical basis for expecting selective alterations in microstates linked to internally oriented processing and attentional control. Accordingly, microstates C and D were hypothesized to be most prominently affected in OCD patients. Although emerging studies have reported abnormal microstate parameters and transitions in OCD, including changes linked to symptom improvement following neuromodulation (Cheng et al., Reference Cheng, Wang, Tang, Lin, Gao and Wang2024; Ma et al., Reference Ma, Lu, Gong, Xiao, Yang, Ju and Zhang2025), the relationship between EEG microstate dynamics and specific inhibitory control deficits has not yet been directly examined.
The present study aimed to investigate resting-state EEG microstate dynamics in OCD and their associations with cognitive and response inhibition. We hypothesized that: (1) OCD patients would exhibit impairments in both response inhibition and cognitive inhibition, with cognitive inhibition being influenced by emotional cues; (2) OCD patients would show altered microstate parameters, particularly in microstates C and D; and (3) distinct patterns of association would emerge between EEG microstates and cognitive versus response inhibition, reflecting dissociable neural mechanisms. By integrating EEG microstate analysis with behavioral measures of inhibition, this study seeks to advance the understanding of the neurocognitive mechanisms underlying OCD and to inform future development of targeted interventions.
Methods
Participants
Between June 2024 and July 2025, 91 patients with OCD, aged 15–55 years, were recruited from the Fourth People’s Hospital of Hefei City, Anhui Province. All patients were diagnosed by licensed psychiatrists according to Diagnostic and Statistical Manual of Mental Disorders, 5th Edition (DSM-5) criteria. Exclusion criteria included: (1) comorbid severe psychiatric disorders (e.g. schizophrenia, bipolar disorder, or major depressive disorder); (2) lifetime substance abuse; (3) severe neurological disorders or intellectual disabilities; (4) electroconvulsive therapy within the past six months; (5) intracranial hypertension, skull defects, or brain tumors; (6) severe physical illness, infectious disease, or immune system disorder; (7) color blindness or significant visual impairment.
Seventy-nine age-matched healthy controls (HCs) were recruited through community advertisement. All HCs underwent structured clinical interviews to exclude current or past psychiatric disorders and had no history of OCD, neurological illness, or substance abuse (except smoking). Ethical review for this study was approved by the Institutional Ethics Review Committee of the Institute of Psychology, Chinese Academy of Sciences (Approval No.: H23102). All participants provided written informed consent.
Clinical assessment
Sociodemographic and clinical information was collected using questionnaires. Symptom severity was assessed using the Yale-Brown Obsessive-Compulsive Scale (Y-BOCS) (Goodman et al., Reference Goodman, Price, Rasmussen, Mazure, Fleischmann, Hill and Charney1989), a widely used semi-structured clinical interview tool. This 10-item scale employs a 5-point scale (0–4) for obsessions and compulsions. All assessments were conducted via face-to-face interviews by trained psychology graduate students. The internal consistency coefficient for assessors at this research center was 0.865.
Experimental task
Cognitive inhibition was assessed using a modified version of the Emotional Stroop Task (EST) (Watts, McKenna, Sharrock, & Trezise, Reference Watts, McKenna, Sharrock and Trezise1986), in which emotional stimuli served as emotional primes rather than task-relevant distractors. Emotional images (60 threat-related, 60 neutral) were selected from the International Affective Picture System (IAPS) (Lang, Bradley, & Cuthbert, Reference Lang, Bradley and Cuthbert2008) and the Chinese Affective Picture System (Lu, Hui, & Yu-Xia, Reference Lu, Hui and Yu-Xia2005). Each trial began with an affective image, followed by a colored Chinese color word (‘red’, ‘green’, ‘yellow’, or ‘blue’) presented in congruent or incongruent font colors (50% each). Participants responded based on word meaning while ignoring font color. Reaction time and accuracy were recorded. Twelve practice trials preceded the task, and only participants achieving ≥80% accuracy proceeded to the formal task.
Response inhibition was measured using a SST (Fan et al., Reference Fan, Liu, Lei, Cai, Zhong, Dong and Zhu2016). Participants responded to go stimuli (green circle or triangle) and attempted to inhibit responses on stop trials when the stimulus turned red after a 2variable stop-signal delay (SSD). The SSD was dynamically adjusted (±50 ms) to achieve approximately 50% successful inhibition (Congdon et al., Reference Congdon, Mumford, Cohen, Galvan, Canli and Poldrack2012). Stop-signal reaction time (SSRT) was calculated as the primary index of response inhibition (Verbruggen et al., Reference Verbruggen, Aron, Band, Beste, Bissett, Brockett and Boehler2019). The task comprised six blocks, each containing 80 go trials and 16 stop trials (Figure 1).
EST task flow and SST task flow. In EST paradigm, the Chinese characters 红 (red), 绿 (green), 黄 (yellow), and 蓝 (blue) were displayed in either congruent or incongruent font colors.

Figure 1. Long description
The top panel labeled A details the Emotional Stroop Task. From left to right: a fixation cross is shown for 500 milliseconds, followed by either a snake or lamp photo. Next, four vertically arranged Chinese characters appear, each in a different color: red, green, yellow, blue. The word colors may be congruent or incongruent with their meanings. This display lasts 200 milliseconds on a black background, then a blank screen for 1000 to 1500 milliseconds. The bottom panel labeled B shows the Stop Signal Task. From left to right: a fixation cross, then a green circle or triangle appears for 1000 milliseconds (Go trial). In some trials, after the initial green shapes, a red circle or triangle replaces the green one for 500 milliseconds (Stop trial), with the interval labeled SSD. The sequence ends with a blank screen for 1500 to 2000 milliseconds.
Procedure
Participants first completed clinical interviews and questionnaires, followed by resting-state EEG recording (5 min eyes open, 5 min eyes closed). The EST and SST were then administered. Of the 91 OCD patients enrolled, 82 completing the resting-state EEG assessment. After excluding data with poor signal quality, 76 EEG datasets were retained for analysis. For the EST, 79 participants completed the task; those with accuracy rate below 70% were excluded, yielding 75 valid datasets. The SST was administered only between June and December 2024, during which 53 participants completed the task. To ensure valid measurement of SSRT, participants with stop accuracy above 75% or below 25% were excluded, yielding 44 usable SST datasets. Participants with missing or poor-quality EEG or behavioral data were excluded based on predefined quality criteria. The number of participants included in each analysis is reported in the ‘Results’ section.
EEG data recording and preprocessing
EEG data were recorded using a 64-channel Neuroscan system following the international 10–20 layout (Homan, Herman, & Purdy, Reference Homan, Herman and Purdy1987). Signals were sampled at 1000 Hz with electrode impedance kept below 20 kΩ, with recordings conducted in a quiet, electrically shielded room to minimize environmental noise. EEG preprocessing included band-pass filtering (0.1–70 Hz), notch filtering (48–52 Hz), visual artifact inspection, independent component analysis (ICA) for ocular and muscle artifact removal. Finally, the EEG data were downsampled to 250 Hz, refiltered within the 2–20 Hz frequency range, and then average re-referencing. These steps prepared the data for subsequent microstate analysis.
Microstate analysis
EEG microstate analysis was conducted using the EEGLAB microstate plugin (Li et al., Reference Li, Chen, Lv, Hou, Dong, Wang and Yu2022) on eyes-closed data only (Murphy, Stickgold, & Öngür, Reference Murphy, Stickgold and Öngür2020). Global field power (GFP) peaks were extracted and clustered using polarity-invariant k-means clustering. The optimal number of microstates was determined based on global explained variance (GEV) and cross-validation criteria. Microstate maps were back-fitted to continuous EEG data, with temporal smoothing applied to reduce spurious fragmentation. For each microstate, mean duration, occurrence frequency, temporal coverage, and transition probabilities were calculated.
Statistical analysis
The sample size was determined based on an a priori power analysis to ensure adequate power (1 − β = 0.80) to detect medium-sized interaction effects in the mixed-design analysis of variance (ANOVA). EEG preprocessing and behavioral data analyses followed standardized pipelines. Age, sex, and years of education were examined as potential covariates. Because no significant group differences were observed in these variables, primary analyses were conducted without covariate adjustment. The Stroop effect was calculated as the reaction time difference between incongruent and congruent trials. A 2 (group: OCD/HCs) × 2 (emotion: threat/neutral) repeated-measures ANOVA was used to assess cognitive inhibition. Group differences in SSRT were examined using one-way ANOVA. Associations between inhibitory control, clinical symptoms, and microstate parameters were examined using Pearson correlation analyses within the OCD group. Microstate parameters were analyzed using 2 (group: OCD/HCs) × 4 (microstate category: A, B, C, D) repeated-measures ANOVAs. All analyses were conducted in SPSS 26, with false discovery rate (FDR) correction applied for multiple comparisons and significance set at p < 0.05.
Results
Demographic and clinical variables
Demographic characteristics, clinical symptoms, and task performance are summarized in Table 1. No significant differences were observed between OCD patients and HCs in terms of age, sex, or years of education (all p > 0.05). Medication status was available for 84 OCD patients: 61 were receiving medication, 14 had been medication-free for more than 2 months, and 9 were medication-naïve. Among medicated patients, selective serotonin reuptake inhibitors (SSRIs) were most commonly prescribed (n = 49), including sertraline (n = 21), fluvoxamine (n = 13), fluoxetine (n = 9), and paroxetine (n = 6).
Demographic, clinical variables in OCD and HC groups

Table 1. Long description
From the top row, columns are labeled O C D, H C, and F or t with P value. Sex (male/female): O C D 48/36, H C 42/31, F 0.002 P 0.96. Age (mean plus or minus S E): O C D 28.22 plus or minus 8.55, H C 26.10 plus or minus 9.01, t 1.50 P 0.13. Year of education: O C D 14.99 plus or minus 2.52, H C 15.79 plus or minus 2.93, t minus 1.78 P 0.076. Age of onset (years): O C D 19.52 plus or minus 8.37. Medication status (medication-naive/medication-free more than 2 months/unstable medication/stable medication more than 2 months): O C D 9/14/26/35. Y dash B O C S section: Obsessions O C D 11.36 plus or minus 2.09, Compulsions O C D 9.99 plus or minus 3.58, Total O C D 21.35 plus or minus 4.63. E S T section: Threat-related congruent A C C O C D 0.95 plus or minus 0.05, H C 0.96 plus or minus 0.05, t minus 1.01 P 0.31. Threat-related incongruent A C C O C D 0.88 plus or minus 0.08, H C 0.92 plus or minus 0.07, t minus 3.18 P 0.002. Neutral congruent A C C O C D 0.96 plus or minus 0.05, H C 0.96 plus or minus 0.05, t minus 0.28 P 0.78. Neutral incongruent A C C O C D 0.89 plus or minus 0.08, H C 0.92 plus or minus 0.08, t minus 2.18 P 0.03. S S T section: Stop A C C O C D 0.54 plus or minus 0.09, H C 0.57 plus or minus 0.11, t minus 1.16 P 0.24.
Cognitive and response inhibition
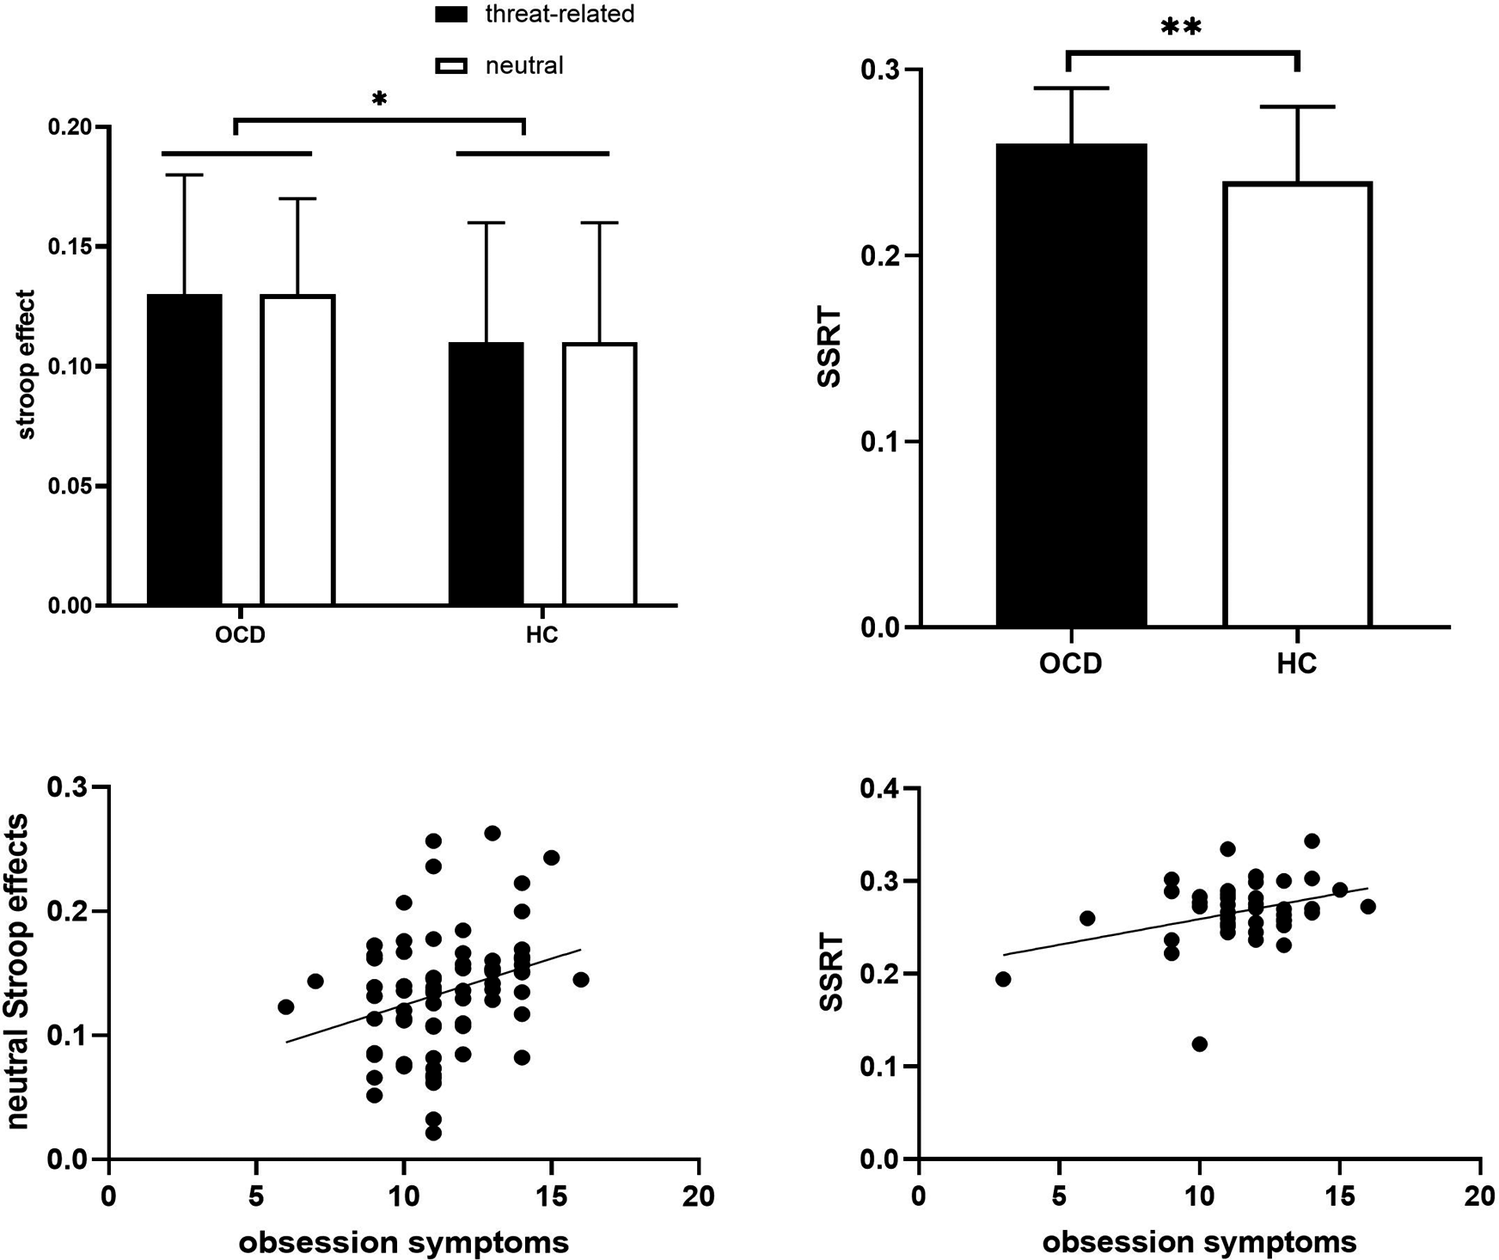
For the EST, repeated-measures ANOVA revealed no significant group × emotion interaction. However, a significant main effect of group was observed, with OCD patients showing a larger Stroop effect than HCs (F (1,146) = 4.25, p = 0.041, ηp 2 = 0.028), indicating impaired cognitive inhibition. For the SST, no group differences were observed in stop accuracy. OCD patients exhibited significantly longer SSRT than HCs (F (1,78) = 7.49, p = 0.008, ηp 2 = 0.088), indicating impaired response inhibition. Within the OCD group, obsessive symptom severity was positively correlated with the neutral Stroop effect (r = 0.294, p = 0.013) and SSRT (r = 0.355, p = 0.023) (Figure 2).
Comparison of cognitive inhibition and response inhibition between OCD and HC groups.

Figure 2. Long description
Top-left panel is a bar graph with y-axis labeled stroop effect from 0.00 to 0.20 and x-axis showing O C D and H C groups. Each group has two bars: black for threat-related and white for neutral. Both O C D and H C show similar stroop effects for both conditions, with a significant difference marked by an asterisk above the bars. Top-right panel is a bar graph with y-axis labeled S S R T from 0.0 to 0.3 and x-axis showing O C D and H C. O C D group has a higher S S R T value than H C, with a double asterisk indicating statistical significance. Bottom-left panel is a scatterplot with x-axis labeled obsession symptoms from 0 to 20 and y-axis labeled neutral Stroop effects from 0.0 to 0.3. Data points show a slight positive trend. Bottom-right panel is a scatterplot with x-axis labeled obsession symptoms from 0 to 20 and y-axis labeled S S R T from 0.1 to 0.4. Data points also show a slight positive trend. All axes and statistical markers are labeled as shown.
EEG microstate parameters and transition probabilities
The four canonical microstates explained 74.54% of the GEV in the OCD group and 73.65% in the HC group. Significant group × microstate interactions were observed for mean duration (F (3,145) = 4.77, p = 0.003, ηp 2 = 0.09), time coverage (F (3,145) = 5.89, p < 0.001, ηp 2 = 0.109), and occurrence frequency (F (3,145) = 5.52, p = 0.001, ηp2 = 0.103). Post hoc analyses showed that, compared with HCs, OCD patients exhibited longer mean duration (p = 0.009, Cohen’s d = 0.43) and greater time coverage (p = 0.008, Cohen’s d = 0.44) of microstate A, alongside shorter mean duration (p = 0.015, Cohen’s d = −0.40), reduced time coverage (p < 0.001, Cohen’s d = −0.66), and lower occurrence frequency (p < 0.001, Cohen’s d = −0.62) of microstate C (all p < 0.05; Figure 3).
Comparison of microstate parameters and transition probabilities between OCD and HC groups.

Figure 3. Long description
Panel A, top left, displays eight scalp maps in two rows: O C D group on top, H C group below, each with four columns labeled Class A, B, C, D. Color gradients range from blue to red. To the right, two grouped bar graphs show mean duration in milliseconds for each class, with O C D and H C bars side by side. Significant differences are marked with double asterisks above Class A and single asterisk above Class C. Y axis is mean duration (ms), X axis lists O C D and H C for each class. Panel B, bottom, contains two bar graphs. Left graph shows occurrence per second for each class, with O C D and H C bars grouped and triple asterisks above Class C. Right graph shows time coverage, with significant differences marked by double and triple asterisks above Class A and Class C. Legend at left identifies bar colors for Classes A through D. Error bars are present on all bars.
Regarding transition probabilities, HCs showed higher transitions from microstates A, B, and D to C, whereas OCD patients showed higher B to A transitions (all uncorrected p < 0.05). After multiple comparison correction, only the transition probabilities from microstates B and D to C remained statistically significant (Supplementary Table S1).
No significant differences were observed between OCD patients who completed the SST and those who did not in terms of OCD symptom severity or EEG microstate parameters (all p > 0.05). Furthermore, EEG microstate parameters were not significantly associated with illness duration or OCD symptom severity within the OCD group (all p > 0.05).
Associations between EEG microstates and inhibitory control
Correlation analyses within the OCD group revealed several associations between EEG microstate parameters and inhibitory control measures. Specifically, SSRT positively correlated with the average duration (r = 0.457, n = 39, p = 0.003) and temporal coverage (r = 0.324, n = 39, p = 0.044) of microstate C. Conversely, SSRT negatively correlated with the time coverage of microstate D (r = −0.322, n = 39, p = 0.046) and the occurrence frequency of microstate A (r = −0.378, n = 39, p = 0.018) and microstate D (r = −0.384, n = 39, p = 0.016). Regarding Stroop effect, it showed a positive correlation with the average duration of microstate B (r = 0.243, n = 76, p = 0.044), while exhibiting negative correlations with the time coverage of microstate D (r = −0.354, n = 76, p = 0.003), the occurrence frequency of microstate C (r = −0.316, n = 76, p = 0.008), and the occurrence frequency of microstate D (r = −0.375, n = 76, p = 0.001).
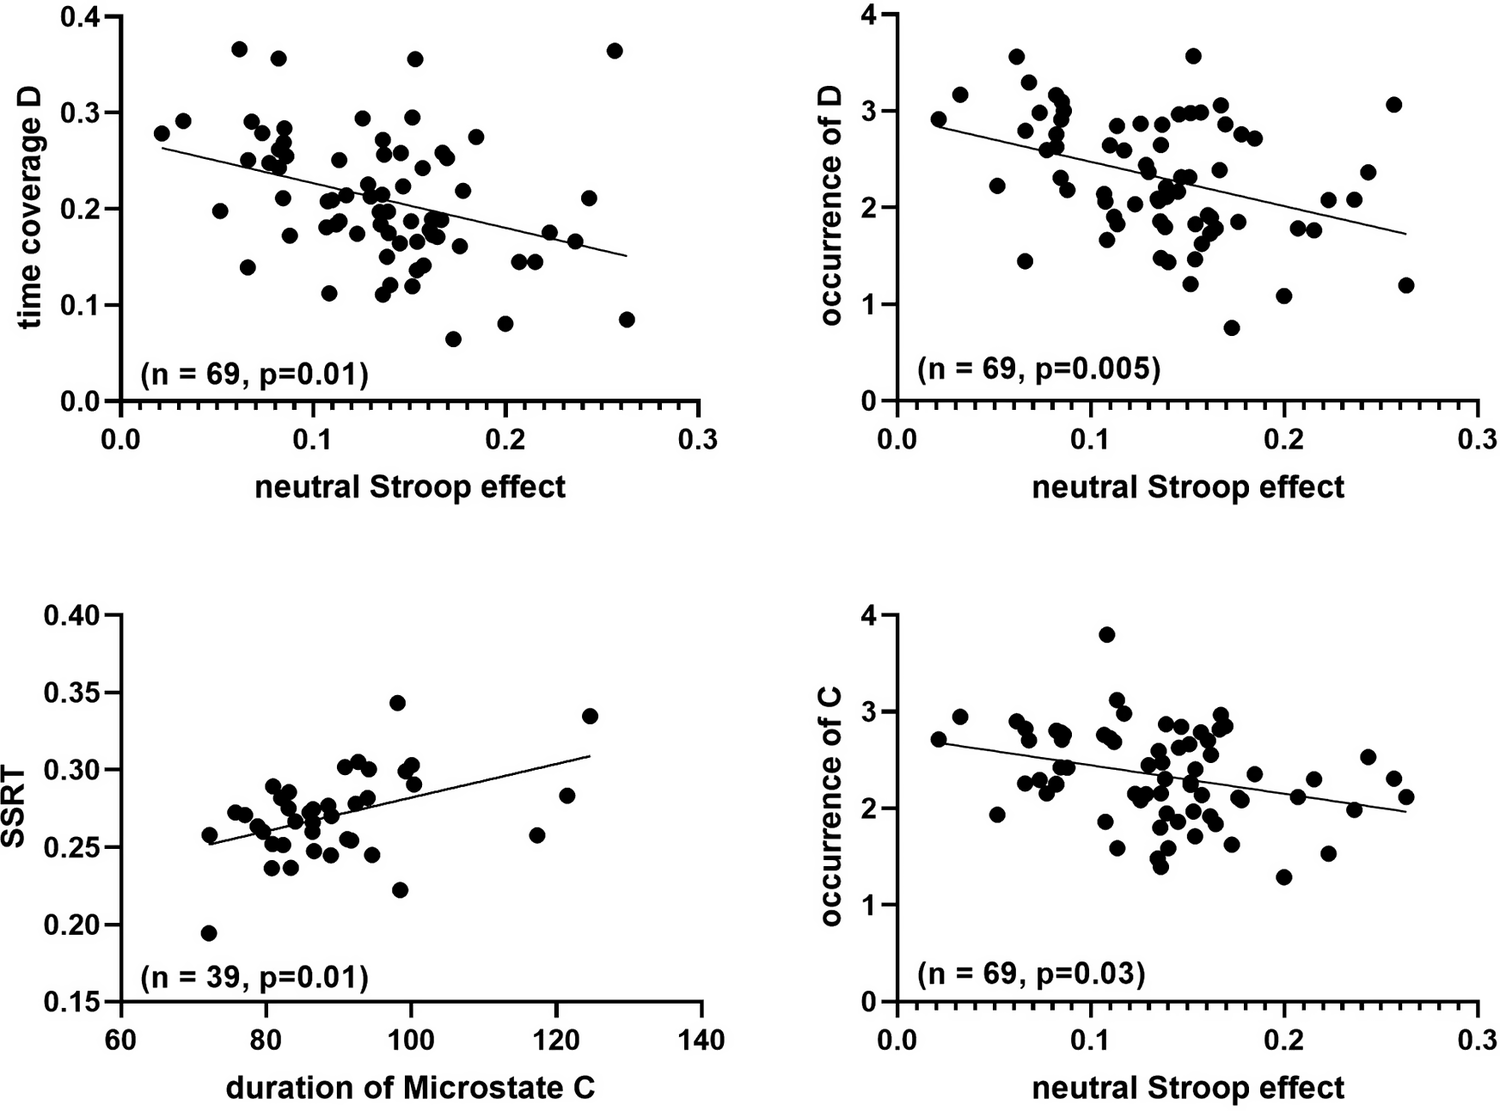
After FDR correction, only a subset of associations remained significant (Figure 4). Specifically, the positive correlation between the mean duration of microstate C and SSRT remained significant (p FDR = 0.01). For the Stroop effect, significant negative correlations persisted for the occurrence of microstate C (p FDR = 0.03), the occurrence of microstate D (p FDR = 0.005), as well as the time coverage of microstate D (p FDR = 0.01). All other correlations did not survive correction.
Relationship between inhibition control and EEG microstates in OCD.

Figure 4. Long description
Top-left panel: X axis is neutral Stroop effect from 0.0 to 0.3, Y axis is time coverage D from 0.0 to 0.4. Data points show a negative trend, with line sloping downward. Annotation reads n equals 69, p equals 0.01. Top-right panel: X axis is neutral Stroop effect from 0.0 to 0.3, Y axis is occurrence of D from 0 to 4. Data points show a negative trend, line slopes downward, annotation n equals 69, p equals 0.005. Bottom-left panel: X axis is duration of Microstate C from 60 to 140, Y axis is S S R T from 0.15 to 0.40. Data points show a positive trend, line slopes upward, annotation n equals 39, p equals 0.01. Bottom-right panel: X axis is neutral Stroop effect from 0.0 to 0.3, Y axis is occurrence of C from 0 to 4. Data points show a slight negative trend, line slopes downward, annotation n equals 69, p equals 0.03.
Finally, no significant differences were observed between medicated and non-medicated OCD patients in clinical symptoms, EEG microstate parameters, or inhibitory control performance (all p > 0.05).
Discussion
This study provides the first integrated examination of resting-state EEG microstate dynamics and their associations with cognitive and response inhibition in patients with OCD. Three main findings emerged. First, OCD patients exhibited deficits in both response inhibition and cognitive inhibition. Notably, the cognitive inhibition deficit was unaffected by threatening cues, while deficits in both domains showed a significant positive correlation with obsessive symptom severity. Second, OCD patients exhibited altered resting-state microstate dynamics, characterized by increased duration and coverage of microstate A and reduced duration, coverage, and occurrence of microstate C, along with elevated transition probabilities from microstates B and D to C. Third, distinct microstate parameters were differentially associated with response versus cognitive inhibition, suggesting functional dissociation at the level of large-scale neural dynamics.
Deficits in inhibitory control in OCD
Consistent with prior work, our findings indicated that patients with OCD exhibited deficits in both response inhibition and cognitive inhibition, supporting the view that inhibitory dysfunction represents a core cognitive feature of OCD (Chamberlain et al., Reference Chamberlain, Blackwell, Fineberg, Robbins and Sahakian2005; Suhas & Rao, Reference Suhas and Rao2019; van Velzen, Vriend, de Wit, & van den Heuvel, Reference van Velzen, Vriend, de Wit and van den Heuvel2014). Contrary to our hypothesis, cognitive inhibition deficits were not modulated by threatening emotional cues. Although earlier studies suggested enhanced emotional interference in OCD (Lavy, van Oppen, & van den Hout, Reference Lavy, van Oppen and van den Hout1994; Novara & Sanavio, Reference Novara and Sanavio2001), several investigations, including those conducted in Chinese samples have similarly reported null emotional modulation effects (Fan et al., Reference Fan, Liu, Lei, Cai, Zhong, Dong and Zhu2016; Harvey, Reference Harvey2022; Moritz et al., Reference Moritz, Jacobsen, Kloss, Fricke, Rufer and Hand2004; Sizino da Victoria, Nascimento, & Fontenelle, Reference Sizino da Victoria, Nascimento and Fontenelle2012). Several factors may account for this finding. First, emotional stimuli in our task functioned as emotional cues rather than task-relevant distractors (Rao et al., Reference Rao, Arasappa, Reddy, Venkatasubramanian and Reddy2010), which may limit their impact on response competition. Second, the present study used general affective images as emotional stimuli. In contrast, some previous studies have employed OCD-related words or images (Narayanaswamy et al., Reference Narayanaswamy, Jose, Agarwal, Kalmady, Baruah, Shivakumar and Janardhan Reddy2019), which may be more salient and therefore more effective in eliciting emotional interference effects. Third, cultural factors may also play a role, as similar null emotional modulation effects have been reported in studies conducted in Chinese populations (Fan et al., Reference Fan, Zhong, Zhu, Lei, Dong, Zhou and Liu2014, Reference Fan, Liu, Lei, Cai, Zhong, Dong and Zhu2016). Together, these findings suggest that cognitive inhibition deficits in OCD patients may be intrinsically trait-like rather than primarily driven by emotional reactivity. This aligns with the rigid cognitive characteristic of OCD, such as persistent intrusive thoughts (Abramovitch, Dar, Hermesh, & Schweiger, Reference Abramovitch, Dar, Hermesh and Schweiger2012). These hypotheses require further validation in future studies.
Both inhibitory deficits positively correlated with obsessive symptom severity, supporting the notion that inhibitory dysfunction is a core element of the OCD clinical phenotype. These findings further highlight the value of inhibitory control dysfunction as a clinically relevant and interventable therapeutic target for OCD.
Abnormalities in EEG microstates in OCD
Resting-state microstate analysis revealed selective alterations in OCD patients. Consistent with our hypotheses, microstate C showed reduced duration, coverage, and occurrence frequency. Inconsistent with our expectations, microstate D did not show significant group-level alterations after correction for multiple comparisons. In addition, we observed reliable but unanticipated increases in the duration and coverage of microstate A, indicating that OCD-related network alterations may extend beyond the initially hypothesized systems.
Microstate C is typically associated with the DMN, which is involved in self-referential and internally focused cognitive activities (Vass et al., Reference Vass, Farkas, Lányi, Kói, Csukly, Réthelyi and Baradits2025). Reduced microstate C frequency may indicate weakened or unstable DMN activity, consistent with earlier findings of altered DMN connectivity in OCD patients (Beucke et al., Reference Beucke, Sepulcre, Eldaief, Sebold, Kathmann and Kaufmann2014; Guo et al., Reference Guo, Zhu, Zhou, Ma, He, Wang and Zhang2025). Ren et al. (Reference Ren, Ran, Qiu, Lv, Wang, Wang and Zhao2024) similarly found significantly shorter microstate C duration in OCD patients compared to HCs, consistent with the present findings. In contrast, group-level findings for microstate D were mixed, in line with previous OCD studies reporting either nonsignificant or heterogeneous alterations (Cheng et al., Reference Cheng, Wang, Tang, Lin, Gao and Wang2024; Ma et al., Reference Ma, Lu, Gong, Xiao, Yang, Ju and Zhang2025; Ren et al., Reference Ren, Ran, Qiu, Lv, Wang, Wang and Zhao2024). These inconsistencies may reflect substantial inter-individual variability and methodological sensitivity. Importantly, the absence of robust group-level differences does not preclude the functional relevance of microstate D, as supported by its significant associations with cognitive inhibition performance observed in the present study. Future studies using task-based EEG paradigms will be important to determine whether microstate D alterations emerge more robustly during cognitive control demands.
Increased duration and coverage of microstate A, previously associated with internal verbalization and arousal-related processes (Antonova et al., Reference Antonova, Holding, Suen, Sumich, Maex and Nehaniv2022; Michel & Koenig, Reference Michel and Koenig2018), may reflect heightened internally focused or ruminative processing in OCD. Our findings align with prior studies showing increased microstate A in OCD patients (Yoshimura et al., Reference Yoshimura, Pascual-Marqui, Nishida, Kitaura, Mii, Saito and Kinoshita2019). Current findings regarding microstate A in OCD patients remain controversial. Inconsistent with the present study, some studies have reported significantly shorter duration of microstate A in OCD patients compared to HCs (Cheng et al., Reference Cheng, Wang, Tang, Lin, Gao and Wang2024; Ren et al., Reference Ren, Ran, Qiu, Lv, Wang, Wang and Zhao2024), while others found no difference in the duration of microstate A between OCD patients and HCs (Ma et al., Reference Ma, Lu, Gong, Xiao, Yang, Ju and Zhang2025). These inconsistent findings may stem from differences in subject types, sample sizes, and the number of EEG electrodes used. Larger-scale studies are warranted.
Furthermore, OCD patients also exhibited elevated transition probabilities from microstates B and D to microstate C. Microstate B has been linked to self-visualization, autobiographical memory recall, and linguistic thought processes (Vass et al., Reference Vass, Farkas, Lányi, Kói, Csukly, Réthelyi and Baradits2025), whereas microstate D is characterized by a central–frontal configuration with source activity originating in the frontoparietal network (D’Croz-Baron, Bréchet, Baker, & Karp, Reference D’Croz-Baron, Bréchet, Baker and Karp2021; Diaz et al., Reference Diaz, Van Der Sluis, Moens, Benjamins, Migliorati, Stoffers and Linkenkaer-Hansen2013). The increased transition probability from microstates B and D to microstate C may indicate inefficient or unstable shifts toward DMN-dominant processing modes, reflecting network instability. As reported in studies of major depressive disorder and schizophrenia, unstable switching between microstates has been suggested to reflect trait-like intermediate phenotypes across psychiatric disorders (Thirioux et al., Reference Thirioux, Langbour, Bokam, Wassouf, Guillard-Bouhet, Wangermez and Jaafari2024; Yang et al., Reference Yang, Liu, Wang, Li and Liu2025); however, this proposal remains tentative and warrants further validation in longitudinal and intervention-based studies.
Associations between inhibitory control and EEG microstates
A key finding of this study is the dissociable association between microstate dynamics and distinct components of inhibitory control. Longer duration of microstate C was associated with poorer response inhibition, as indexed by SSRT. Given that microstate C has been linked to internally oriented networks and self-referential processing based on EEG–functional magnetic resonance imaging (fMRI) studies (D’Croz-Baron, Bréchet, Baker, & Karp, Reference D’Croz-Baron, Bréchet, Baker and Karp2021; Pan, Hoid, Gu, & Li, Reference Pan, Hoid, Gu and Li2020; Vass et al., Reference Vass, Farkas, Lányi, Kói, Csukly, Réthelyi and Baradits2025), this pattern may reflect increased internally focused processing related to impaired motor inhibition, although this interpretation is correlational.
In contrast, increased occurrence and temporal coverage of microstate D were associated with smaller Stroop effects, suggesting better cognitive inhibition. As microstate D corresponds to attentional control networks (Tarailis, Koenig, Michel, & Griškova-Bulanova, Reference Tarailis, Koenig, Michel and Griškova-Bulanova2024; Wang, Ding, Zhang, & Yang, Reference Wang, Ding, Zhang and Yang2021), this pattern is more consistent with compensatory engagement of control-related systems supporting cognitive control. Consistent with this interpretation, Qin et al. (Reference Qin, Liu, Wang, Wang, Liang, Chen and Zhao2025) reported that microstate D metrics were positively correlated with information processing speed and working memory performance in patients with major depressive disorder. Together, these findings indicate distinct associations between EEG microstate dynamics and different aspects of inhibitory control in OCD. Importantly, these associations are correlational in nature and do not permit causal inferences, which will need to be further explored in future studies.
Interestingly, no significant correlations were observed between EEG microstate parameters and OCD symptom severity, despite associations with inhibitory control performance. This dissociation may reflect the clinical heterogeneity of OCD (Stein et al., Reference Stein, Costa, Lochner, Miguel, Reddy, Shavitt and Simpson2019) and the limited sensitivity of global severity measures, such as the Y-BOCS, to specific neural dynamics. Consistent with prior work, EEG microstates appear to be more closely linked to specific cognitive processes than to overall symptom severity (Casas Osorio, Ramirez Lopez, & Renza Torres, Reference Casas Osorio, Ramirez Lopez and Renza Torres2025; Peng et al., Reference Peng, Fan, Li, Zhu, Tian and Zhang2024). Importantly, accumulating evidence suggests that EEG microstates may reflect intermediate neural markers that capture trait-like vulnerabilities while remaining sensitive to therapeutic modulation (Cheng et al., Reference Cheng, Wang, Tang, Lin, Gao and Wang2024; de Bock et al., Reference de Bock, Mackintosh, Maier, Borgwardt, Riecher-Rössler and Andreou2020).
Although no significant differences were observed between medicated and non-medicated patients in the present study, the potential modulatory effects of SSRIs on resting-state EEG microstate dynamics and inhibitory control should not be ignored. Previous studies have suggested that EEG microstates may serve as neurophysiological markers and predictors of treatment response to SSRIs (Lei et al., Reference Lei, Liu, Zhang, Guo, Liu, Hu and Zhang2022; Zhang et al., Reference Zhang, Yang, Cui, Huang, Xie, Luo and He2025), and serotonergic modulation has been shown to influence response inhibition systems (Hughes et al., Reference Hughes, Rittman, Regenthal, Robbins and Rowe2015). In addition, no significant associations were observed between EEG microstate parameters and duration of illness, possibly reflecting illness heterogeneity or limited sensitivity of resting-state markers to illness duration. Together, these findings highlight the need for longitudinal and drug-naïve designs to clarify the influence of treatment and illness course on EEG microstate alterations.
Several limitations should be acknowledged. First, it was an exploratory cross-sectional study; future longitudinal research is needed to further elucidate these mechanisms and their roles in the pathogenesis and maintenance of OCD patients. Second, this study employed only EEG technology; future research should integrate fMRI with EEG to establish precise neural circuit associations for microstates. Third, emotional images in the EST served as primes rather than task-relevant distractors, which may have reduced sensitivity to emotional modulation effects on cognitive inhibition. Fourth, although no significant differences were observed between medicated and non-medicated patients, the small sample of non-medicated patients limits statistical power. This finding should be interpreted cautiously, and future studies comparing first-episode medication-naïve patients with those receiving long-term stable treatment are warranted.
In summary, this study demonstrates that resting-state EEG microstate dynamics are differentially associated with cognitive and response inhibition in OCD. Microstate C was linked to response inhibition deficits, whereas microstate D was associated with cognitive control performance. These findings indicate the existence of functional dissociation in large-scale resting-state brain dynamics: abnormally activated self-referential neural networks may hinder response inhibition, while enhanced activation of attention-related networks may promote cognitive control. This study highlights the utility of EEG microstates as intermediate neural markers for assessing inhibitory dysfunction in OCD patients, laying the groundwork for developing personalized interventions targeting specific neural substrates. Future research should expand these findings using multimodal neuroimaging and longitudinal designs to further validate microstate-based cognitive subtype classification and its correlation with treatment response.
Supplementary material
The supplementary material for this article can be found at http://doi.org/10.1017/S0033291726104498.
Data availability statement
The data that support the findings of this study are available on request from the corresponding author.
Acknowledgments
We thank all the subjects whose participation made this study possible.
Author contribution
RR.Z.: Conceptualization; formal analysis; writing – original draft preparation; QH.G., RM.F., Y.L.: investigation; DM.W.: project administration, supervision; H.S., JL.G., AZ.W.: resources, supervision; X-Y.Z.: writing – review and editing; supervision; project administration; funding acquisition; All authors have contributed to and have approved the final manuscript.
Funding statement
This study was funded by the Brain Science and Brain-like Intelligence Technology – National Science and Technology Major Project (2021ZD0202102) and the State Key Laboratory of Cognitive Science and Mental Health.
Competing interests
None.





 Open access

