Introduction
Nitrogen fertilizer applied to annual row crop systems that are tile drained leads to nitrate-N pollution of surface waters, and this combination of practices in the Upper Mississippi region contributes one third of total N load to the Gulf of Mexico (MPCA, 2013). The area of the Gulf Hypoxia Zone averages about three times larger than the goal of 5,000 km2 set by the US Federal Hypoxia Task Force, and hypoxia occurs nearly every summer (Turner and Rabalais, 2003). To reach the goal set by the Hypoxia Task Force, N loads to the Gulf need to be reduced by 45%.
Research has attributed this nitrate-N pollution in the Midwestern US agricultural region to a combination of controllable and uncontrollable factors including edaphic, climatic, and agronomic factors (Lazarus et al., Reference Lazarus, Mulla and Wall2014). Agricultural fields in the cornbelt region tend to be large, thus displaying significant within-field variability in soil organic matter and yield potential (Papiernik et al., Reference Papiernik, Lindstrom, Schumacher, Farenhorst, Stephans, Schumacher and Lobb2005; Scharf et al., Reference Scharf, Kitchen, Sudduth, Davis, Hubbard and Lory2005). Yet more than two thirds of these fields still receive blanket input applications of N fertilizer (Erickson and Widmar Reference Erickson and Widmar2015). Additionally, more than 90% of growers in Minnesota apply N fertilizer before planting, while 30% apply anhydrous ammonia in the fall (MPCA, 2013) thus increasing the potential of N losses. A recent comprehensive study conducted by the Minnesota Pollution Control Agency (MPCA, 2013) found that tile drainage contributes 37% to 43% of nitrate-N to surface waters for dry and wet years, respectively.
As a result of the above factors, there are: 1) temporal and spatial mismatches between N amendments and crop requirements that lead to low N use efficiencies (40-50%) for corn (Cassman et al., Reference Cassman, Dobermann and Walters2002); and 2) significant losses of nitrate-N in tile drainage discharge to surface waters.
Split and variable rate nitrogen (VRN) application have been proposed as best management practices to address this asynchrony in N fertilizer application relative to crop growth and development. Growers are recommended to apply a small amount of N at or before planting and delay the majority of N until plant N uptake rate peaks at around growth stage V6-V8. Side-dressing can be based on crop sensing (Mulla, Reference Mulla2013) or in-season modeling of plant available N.
Research has shown that VRN can help increase yield (Raun et al., Reference Raun, Solie, Johnson, Stone, Mullen, Freeman, Thomason and Lukina2002) and improve N use efficiency, and thus reduce N losses via leaching, runoff and denitrification (Tremblay and Belec Reference Tremblay and Belec2006; Schepers et al., Reference Schepers, Varvel and Watts1995). However, little is known about the impact of VRN on both water quality and yield under tile drained conditions. Research is needed to improve our understanding of the impact of VRN on crop production and water quality under conventional tile drainage and under a variety of management practices and weather conditions. Drainmod is a simulation model that has been successfully used to assess impacts of alternative drainage management practices on drainage discharge and water quality, at field scale (Skaggs et al., 1995). However, Drainmod has not been used to study the impacts of VRN fertilizer management strategies on water quality. The overall objective of this study is to compare field measurements of drain flow discharge and nitrate losses with Drainmod simulations to study the impact of VRN on water quality, the N budget and crop yield for rainfed corn in southern Minnesota. Specifically, we will compare conventional N management practices to VRN practices based on their impact on nitrate-N leaching, nitrate-N loads and corn yield.
Materials and Methods
Site Description
Experimental Site
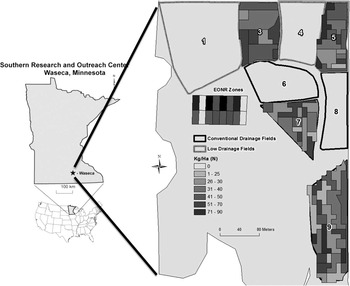
The study site is located in southern Minnesota at the University of Minnesota Southern Research and Outreach Center, at Waseca, Minnesota (Figure 1). The drainage experiment site at Waseca consists of nine plots ranging in size from 0.8 to 2.4 ha. Each plot has a subsurface drainage system with depths of either 0.9 m (shallow) or 1.2 m (deep). Drain spacing was calculated so as to achieve drainage intensities of 1.3 cm d−1 (low intensity) and 5.1 cm d–1 (high intensity), calculated using the Hooghoudt equation. Drain spacings are 12 and 24 m for the 1.2 m depth, and 9 and 18 m for the 0.9 m depth—resulting in four treatments of differing drain depth and spacing combinations to achieve high and low drainage intensities. The drainage design is described in more detail in Sands et al. (Reference Sands, Song, Busman and Hansen2008).
Study location and design. The EONR zones are used as an N reference for VRN plots 3, 5, 7 and 9. Plots 6, 7, 8 and 9 are conventionally drained (high intensity), while plots 1, 3, 4 and 5 have low intensity drainage.

Site soil characteristics, topography
The soils and topography at the site are typical for south-central Minnesota. Major soil types at the site are Webster silty clay loam (fine-loamy, mixed, superactive, mesic Typic Endoaquolls) and Nicollet clay loam (fine-loamy, mixed, superactive, mesic Aquic Hapludolls). Average annual precipitation is approximately 889 mm; precipitation during the growing season (May through September) is approximately 533 mm (averages are the 30 year normal, 1982–2010).
Water monitoring and sampling
Plots were outfitted with tipping buckets to provide a continuous measurement of subsurface drainage flow rates for the years 2003–2008. Nitrogen concentrations were recorded on an event basis for the years 2003 to 2008, and on a weekly basis in 2016. Nitrogen load data for the years 2003–2008 set was estimated using the Army Corps of Engineers model, FLUX, using the daily flow and sampled N concentration measurements.
Field Management
Corn (Zea mays L.) and soybean (Glycine max L.) were grown in rotation for four years, starting with soybean in 2003, with corn following corn for the fifth year (a soy-corn-soy-corn-corn rotation). Anhydrous ammonia was applied for corn pre-plant in April at a rate of 142 kg N/ha in 2004, 134 kg N/ha in 2006, and 185 kg N/ha in 2007. No spring N fertilizer was applied during soybean years. An application of NPK fertilizer (nitrogen, phosphorus and potassium) was applied following soybean harvest in the fall, at a rate of 66/168/224, 0/0/224, and 27/112/134 kg/ha in 2003, 2005, and 2008 respectively.
2016 Variable N Experiment
In the 2016 growing season, rainfed corn was planted at a seeding density of 85,000 seed/ha on April 22nd (Pioneer hybrid P0157AMX). A VRN treatment applied in June was compared to the conventional pre-plant flat rate N treatment at two drainage intensities (Figure 1). The low intensity plots represent the conventional drainage rate for the region (1.3 cm d–1), while the high intensity plots represent an increased drainage rate (5.1 cm d–1). The experimental design is completely randomized with two replicates within each drainage intensity. In 2016, conventional N fertilizer treatments were compared with VRN treatments applied on eight of the drainage intensity study site plots described above. The conventional N treatment consisted of applying the economically optimum N rate (EONR of 151 kgN/ha based on Minnesota Extension Service recommendations) to sub-fields 1, 4, 6 and 8 one day before planting (April 22, 2016), while the in-season VRN treatment consisted of a rate of 50 kg N/ha of nitrogen applied to sub-fields 3, 5, 7 and 9 before planting (April 22nd, 2016), and the remaining 46 to 56 kg N/ha applied at growth stage V6 (June 20, 2016). The VRN side-dress application rate was derived from Crop Circle Green NDVI sensing at V6 based on two reference zones, each with N response plots used for confirming the EONR (Figure 1). The field was harvested with a combine equipped with a Raven yield monitor the first week of November 2016.
Drainmod Simulation
Model Description
The hydrologic model Drainmod was used to simulate drainage, nitrate-N concentration and loads, and soil N processes for the drainage plots. Drainmod is a process-based, distributed, field-scale model, developed to describe the hydrology of poorly or artificially drained lands (Skaggs et al., Reference Skaggs, Fausey and Evans2012). It conducts water balances on hourly and daily time scales, and predicts hydrologic parameters including infiltration, runoff, evapotranspiration, seepage, water table depth, and subsurface drainage on a daily, monthly, and annual time step (Skaggs et al., Reference Skaggs, Fausey and Evans2012). The companion model, Drainmod N-II predicts N transport and transformation processes in the vadose zone, predicting processes such as mineralization, immobilization, nitrification, as well as N flows out of the system in the form of plant uptake, denitrification, volatilization, and losses from surface runoff and subsurface drainage.
Selection of model parameters
Initial input parameters describing the soil water and chemical properties were based on values determined by Luo et al. (Reference Luo, Sands, Youssef, Strock, Song and Canelon2010) from field soil samples, soil survey information, and literature review. Soil samples taken from the site were used to determine model inputs including: soil particle distributions, soil water characteristic curves, and saturated hydraulic conductivity. Hydraulic conductivity showed great variability based on both lab measured samples and county soil survey data at the study site (Luo et al., Reference Luo, Sands, Youssef, Strock, Song and Canelon2010), so the initial model inputs based on the latter two sources were subsequently adjusted during the calibration process. Soil organic matter (4.7–6.2%) was estimated in each plot using kriging interpolation based on soil sampling data from a 0.4 ha grid taken in the spring of 2016 before planting.
Climatic data from the Waseca experiment station for the years 2003–2016 was used as model input, including daily maximum and minimum temperatures, and hourly precipitation. Simulations were run with a 5-year soybean/corn rotation starting with soybean in 2003 and alternating with corn for 4 years, with the 5th year as corn following corn.
Model Calibration
Drainmod was calibrated for the years 2003–2008, corresponding to period of continuous observed drainage and nitrate-N load measurements. Model calibration was done for one plot within each depth/spacing combination (plots 3, 4, 6, and 7), and validated for the remaining plots (1, 2, 5, 8, and 9). For model calibration, urea N fertilizer was applied only during corn years, 7 days before planting and incorporated at a depth of 15 cm. Model performance was evaluated by calculating the monthly Nash-Sutcliffe Coefficient of Efficiency (NSE) and by visual analysis of monthly trends in the simulated subsurface drainage and nitrate-N loads compared to the measured data for each plot.
Model Simulation—Variable Rate Side-Dressing vs. Single Uniform Application
Following model calibration, the model was run for all years of climate data, 2003–2016. Plots 1, 4, 6, and 8 were simulated using conventional fertilizer management, with a single application of urea N fertilizer 7 days pre-plant at a depth of 15 cm (same as model calibration parameters). Plots 3, 5, 7, and 9 were simulated using the VRN fertilizer management scheme, with half the N fertilizer applied 7 days pre-plant, with the remaining N surface applied 59 days post planting—a fertilization strategy that matched what was done in the field in 2016. The model simulated results for nitrate-N concentration were compared against the measured data as an indication of model performance in predicting N dynamics for variable-rate management practices.
Results and Discussion
Model Calibration
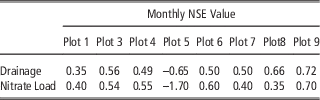
The NSE values for monthly drainage and nitrate-N load are summarized in Table 1. Generally, a monthly NSE value of 0.5 or greater is considered acceptable while a value of 0.7 or greater is considered good, though no specific recommendations apply for evaluating Drainmod N values (Moriasi et al., Reference Moriasi, Arnold, Van Liew, Bingner, Harmel and Veith2007, Skaggs et al., Reference Skaggs, Fausey and Evans2012). Most NSE values in the table are acceptable to good, with the exception being plot 5. The poor results for plot 5 are likely due to instrument malfunction resulting in no data collection for the year 2004; unusually low flow for the year 2008 also indicates possible instrument malfunction that year as well. Nitrate-N load exhibited slightly lower (but still acceptable) NSE scores than for drainage.
Summary of monthly NSE values for subsurface drainage and nitrate-N load for plots during calibration and validation (years 2003–2008)

Nitrate-N Concentration: Measured and Simulated
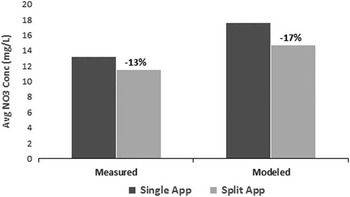
The average of modeled daily or weekly measured nitrate-N concentrations for the period of field-data collection in 2016 (days 110–274) are shown in Figure 2. The higher modeled nitrate-N concentrations are not surprising, given the influence of daily storm events.
Measured or modeled nitrate-N concentration, as an average of all days in the collection period (days 110–274, year 2016) for all plots within an N fertilizer treatment.

For both measured and simulated nitrate-N concentrations, VRN plots tend to show lower nitrate-N concentrations than those treated with the single uniform rate spring application. The measured data show a 13% reduction in nitrate-N concentration for VRN plots compared to single application plots (Figure 2). A similar comparison for modeled results shows a 17% reduction with split application plots, thus confirming the pattern revealed by the measured data (Figure 2).
Simulated Drainage and Nitrate-N Load
Lacking measured drainage data for 2016, nitrate load for the single and split application treatments was estimated using Drainmod predictions. Simulated drainage for the first 274 days of 2016 was approximately 25 cm for the low intensity plots and approximately 30 cm for the high intensity plots. The VRN treatments had no influence on water discharge from tile drains.
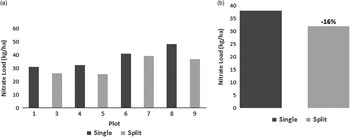
The model-simulated nitrate-N load for each plot is shown in Figure 3. Comparing plots within the same drainage intensity, the split application treatment shows a lower load compared to the single application. Averaged over all plots within the same fertilizer treatment, Drainmod results show a 16% reduction in nitrate-N load with the split application compared to the single application treatment (Figure 3b).
Annual simulated nitrate-N load for the first 273 days of 2016 for: a) all plots; and b) averaged for all plots within a given N fertilizer treatment (single or split application). Plots 1–5 are low intensity drainage design; plots 6–9 are high intensity drainage design.

Nitrogen Budgets
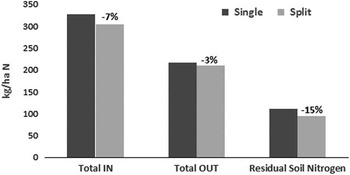
For all simulation years (2003–2016), Drainmod results show an overall reduction in the N added to, lost from, and stored in the soil system for the split application treatment compared to the single application treatment. The amount of N being added to the system was reduced overall by 7%, with a 3% reduction in the amount of N being lost from the system, and a reduction of 15% in the residual soil N (Figure 4).
Drainmod results for soil N additions, losses, and residual soil N for single and VRN treatments.

VRN Impact on Corn Grain Yield
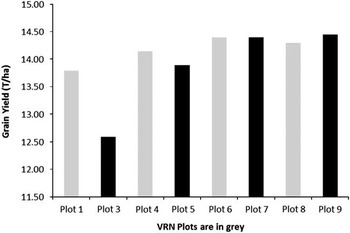
Figure 5 shows grain yield in each plot in 2016. A paired t test comparison (Varvel et al. Reference Varvel, Wilhelm, Shanahan and Schepers2007) conducted for each of the four VRN plots showed no significance difference between 2016 relative yield data and relative corn yield data from the 2004, 2006 and 2007 growing seasons. Crop yield was slightly lower in VRN plots than conventional plots for low intensity drainage because of low yield in plot 3. Historical yield data for this plot has always been low relative to other plots, even with conventional fertilizer treatments. Since VRN plots received, on average, 30% less N than the conventional plots, we can conclude that VRN treatment increased N use efficiency in high intensity drainage plots. Similar findings have been reported elsewhere where the authors showed improvement in NUE following application of VRN (Raun et al., Reference Raun, Solie, Johnson, Stone, Mullen, Freeman, Thomason and Lukina2002).
Corn grain yield for each plot.

Conclusions
Variable rate side-dress N (VRN) applications to maize in June, 2016 resulted in significant reductions in nitrate-N concentrations and modeled N load losses in tile drainage at the Waseca, Minnesota study site in comparison with a single uniform N application applied at planting. Crop yield was not significantly affected by the VRN strategy, except in a single low intensity drainage plot. Crop N use efficiency was generally improved with the VRN strategy in comparison with the conventional uniform single rate strategy. Drainmod was accurate in estimating impacts of the VRN strategy on nitrate-N losses in tile drainage. Overall, this study shows that there are significant water quality benefits to a VRN side-dress strategy in corn.
Acknowledgements
Funding for this project was provided by the Minnesota Department of Agriculture.